

Abstract
With only 1% protein by weight, tooth enamel is the most highly mineralized tissue in mammals. The focus of this study was to evaluate contributions of the proteins on the fracture resistance of this unique structural material. Sections of enamel were obtained from the cusps of human molars and the crack growth resistance was quantified using a conventional fracture mechanics approach with complementary finite element analysis. In selected specimens the proteins were extracted using a potassium hydroxide treatment. Removal of the proteins resulted in approximately 40% decrease in the fracture toughness with respect to the fully proteinized control. The loss of organic content was most detrimental to the extrinsic toughening mechanisms, causing over 80% reduction in their contribution to the total energy to fracture. This degradation occurred by embrittlement of the unbroken bridging ligaments and consequent reduction in the crack closure stress. Although the organic content of tooth enamel is very small, it is essential to crack growth toughening by facilitating the formation of unbroken ligaments and in fortifying their potency. Replicating functions of the organic content will be critical to the successful development of bio-inspired materials that are designed for fracture resistance.
Keywords: crack growth resistance, fracture toughness, enamel, organic content, proteins, teeth
INTRODUCTION
Hard biological tissues are structural materials that are constructed from a combination of minerals and organic substances. Owing to their constituents and complex micro structure, these materials are often classified as biological composites [1, 2]. In general, the hardness and stiffness of these materials have been found to correlate with the degree of mineral concentration [3, 4]. But despite the high mineral content, they often exhibit a combination of strength and toughness that far exceeds those properties of the individual constituents [5–7].
There are several “very” highly mineralized biological materials, including seashells (nacre), sea urchin spines and dental enamel, with organic content of less than 5% by weight. These materials are in a special class. According to their mineral content they would be expected to exhibit predominately brittle behavior and low fracture resistance. However, experimental studies on dental enamel [8–10] and sea shells [11–13] show that they possess fracture toughness comparable to, or even greater than that of some tough ceramics. Apparently, the secret to this performance is attributed to the complex hierarchical structure and the functions of the organic material residing at the interfaces of the mineral components [13–16].
Based on their mechanical behavior, natural materials are serving as models in the design of new structural materials. In fact, several bio-inspired materials have been developed using novel approaches [17–22]. But while the degree of improvement in the strength and toughness of these bio-inspired materials is promising, it is not substantially greater than that of their constituents. Something is missing! The two mostly likely sources for the disparity in performance is a lower degree of structural hierarchy in the bioinspired systems, and the absence of an organic interface. Several studies have explored the importance of structural hierarchy to the toughness of materials [9, 23–27]. Collectively they have found that toughening in natural composites occurs at various length scales. The level of hierarchy assists in desensitizing the microstructure to intrinsic flaws via optimizing the aspect ratio of mineral-protein structures and the crystal size [23, 25, 28]. The organic content serves a wide range of functions. For instance, in hard tissues the proteins provide sites for nucleation and mineralization during the development process [29]. Of course, proteins function as a cohesive medium facilitating stress transfer between the minerals constituents [30,31]. As such, they play an important role on the mechanical behavior of natural materials including their capacity for viscoelastic/viscoplastic deformation, creep response and toughness [32–38]. Yet, the specific contribution of the proteins in bestowing toughness to these materials is not clearly understood.
Within the group of highly mineralized materials, tooth enamel is nearly 96% mineral by weight, with the remainder consisting of a combination of organic proteins (1%) and water (3%) [39]. The mineral consists of carbonated hydroxyapatite crystals that are arranged into an assembly forming long keyhole-shaped rods with an approximate diameter of 4–8 μm, depending on location [40]. The microstructure of enamel is dominated by the rods (also regarded as prisms), which are combined with a spatially varying amount of inter-rod substances at their interface [40]. The crystal orientation within the rods varies spatially as well. Within the head region the crystals are aligned with the longitudinal axis, whereas those in the tail (or inter-rod) region are oriented obliquely [41]. The interface between adjacent rods is separated by a narrow zone sometimes referred to as the rod sheath, and consists of crystallites with less well-defined orientation and a slightly higher degree of organic content. Overall, the proteins serve as the cohesive material between adjacent crystallites and, to a greater extent, at the rod interfaces as well [39]. There are also some spatial variations in the distribution of the enamel rods. Closest to the tooth’s surface the rods extend towards the Dentin Enamel Junction (DEJ) in nearly parallel arrangement. Beyond approximately one third the distance from the tooth’s surface to the DEJ they follow a complex decussating structure [42,43]. Rod decussation leads to the appearance of alternating bands of reflected light in light microscopy, which are known as “Hunter Schreger bands” after their first observers [44].
Tooth enamel undergoes an increase in resistance to fracture with crack extension and achieves a fracture toughness ranging between 2 and 4 MPa.m0.5 [8,9]. This response has been attributed to a synergistic contribution of various energy dissipation mechanisms that arise from the hierarchical structure, which stem from decussation of the enamel rods and the organic content [8,9,45,46]. Although the enamel proteins are considered a principal contributor to the toughness, no study has performed a quantitative assessment of their contributions to the fracture process. This study explores the importance of the enamel proteins to the fracture resistance of this tissue for the first time, and quantifies their contributions to the fracture toughness of this highly mineralized material.
MATERIALS AND METHODS
Caries free human third molars were obtained from participating clinics in the state of Maryland according to an approved protocol (Y04DA23151) issued by the Institutional Review Board of the University of Maryland Baltimore County. The teeth were placed in Hanks Balanced Salt Solution (HBSS) at extraction with record of donor age and gender. All of the teeth were obtained from donors between 17 and 25 years of age. Each tooth was inspected by transillumination method at receipt, and those with signs of visible damage or decay were discarded. Within one month of extraction the selected teeth were sectioned using a slicer/grinder under water-based coolant using diamond abrasive slicing wheels as outlined in Yahyazadehfar et al. [10]. Sectioning was performed to obtain cubes of cuspal enamel approximately 2×2×2 mm3 (one from each tooth) as shown in Figure 1(a).
Figure 1.

Specimen preparation, geometry and orientation of crack growth. a) Bucal-lingual section of molar with potential inset of occlusal enamel highlighted. Note the Longitudinal (L) and Transverse (T) directions of crack growth. The letters “o” and “i” refer to the outer and inner enamel, respectively. b) Geometry of inset CT specimen. The molded enamel inset is approximately 2×2×2 mm3 and embedded within a dental resin composite. All dimensions are in millimeters. c) Relative placement of the back channel in enamel inset for the longitudinal and transverse crack growth directions. The arrows indicate the direction of crack growth. For the transverse direction, samples are shown for crack growth within the outer enamel.
The fracture resistance was characterized in two conditions, namely as sectioned (i.e. the control) and after removal of the proteins (i.e. deproteinized). To achieve the second group, selected enamel cubes from the donor teeth were submerged in a Potassium Hydroxide (KOH) solution with normality of 2.0 and pH level of 11.6. The necessary duration of submersion was assessed by monitoring the concentration of dissolved proteins in the solution using UV-VIS spectrophotometry (BioTek, Epoch microplate spectrophotometer). This technique enables a determination of the concentration of proteins in the solution by measuring the optical absorbance of amino acids (fragments of proteins) at a certain wavelength. A wavelength of 280 nm was chosen for the present study after Stoscheck [47]. Each enamel sample was stored in a separate closed container with 100 μL of KOH to avoid evaporation of the solution. The protein concentration in the solution was measured every day for nine consecutive days. Daily measurements showed that the concentration of proteins in the KOH solution was very low (close to zero) for the first four days. After seven days the protein concentrations reached a range of between 0.20 and 0.38 mg/mL, which plateaued by the ninth day. The measured values of protein in the solution were consistent with the theoretical concentration expected for the volume of enamel cubes, which confirmed that the treated enamel was fully deproteinized by the KOH exposure period.
To characterize the fracture resistance, the sectioned enamel cubes of the control and treated groups were molded within a commercial dental resin composite (Vit-l-escence, Ultra dent Products, Inc., South Jordan, UT, USA) according to Figure 1(b). Detailed descriptions of this process have been described elsewhere [8,45]. Additional features were introduced to the molded sections to achieve a Compact Tension (CT) specimen geometry, including a back channel (1 mm deep) and two holes to enable Mode I loading. The reduced thickness at the back-channel reduces the opening mode load necessary to achieve crack initiation and growth, while maintaining an acceptable surface area for bonding to the inset enamel. Lastly, a chevron notch was introduced in the inset enamel cube using a razor blade and diamond paste after [8, 10]. A total of 30 specimens were prepared for the evaluation.
The crack growth resistance was evaluated in two orthogonal directions, including parallel to the axis of the rods (longitudinal) and perpendicular to the rods (transverse). Both directions involve crack growth occuring in plane with the rods as evident in Figure 1(c). A total of 12 deproteinized specimens were evaluated including the longitudinal (n=5) and transverse (n=7) directions. For the control condition, 18 specimens were evaluated in the longitudinal (n=11) and transverse (n=7) directions. In those prepared with transverse orientation, sectioning was performed to achieve crack growth in the outer enamel (closest to occlusal surface). Results from some of the expeiments on the control specimens were also utilized in [10] for an evaluation of the anisotropy in crack growth of enamel.
To develop a sharp and well-defined crack from the prepared notch, all of the specimens were subjected to an initial period of cyclic loading using a commercial universal testing frame (Enduratec, Model 3100, Eden Prairie, MN, USA) equipped with a 40 Newton load cell. Thereafter, incremental monotonic loading was conducted to achieve stable crack growth using a dedicated universal testing system complemented with a microscopic imaging system (Optem zoom 70×l 391940, QIOPTIQ, Luxembourg). The initial loading sequence was conducted with 1 N increments followed by a small degree of unloading (~ 0.2 N) until the onset of crack extension. Thereafter, the loading was conducted using 0.5 N increments until the point of instability. Hydration of the samples was maintained during loading using a saturated cotton swab that cradled the specimen and retained moisture applied with an eyedropper of HBSS. Digital images were acquired during each stage of loading to identify the displacement field and crack lengths using Digital Image Correlation (DIC). A detailed description of the microscopic DIC process and its application to these experiments is given elsewhere [48]. In short, the Crack Opening Displacement (COD) distributions were obtained and used to precisely identify the crack tip from the location of zero opening-mode displacement.
Using the crack length measurements and corresponding opening mode load from the incremental loading experiments, the stress intensity (KI) distribution was calculated according to [44]
| (1) |
where P is the opening load (Newtons) and the quantities a, B, B* and W are measures of the specimen geometry as illustrated in Figure 1(b). The stress intensity distribution is a function of the elastic modulus and Poisson’s ratio of the inset (E1, v1) and molding materials (E2, v2) as defined in Equation 1. There is a wide range of mechanical properties reported in the literature for enamel. For example, the elastic modulus and hardness of enamel range between 17–120 GPa and 1–6 GPa, respectively [e.g. 46, 49–52]. The wide range of reported values is associated with testing being conducted at various length scales, as well as due to the differences in testing methods. Nevertheless, the upper range in the values of modulus have all been obtained by nanoinentation. Within the finite element study, the elastic modulus and Poisson’s ratio were assigned as 30 GPa, and 0.29, respectively which are accordance with the macro-scale mechanical properties [46, 54]. These two quantities for the molding material corresponded to the resin composite and were 6 GPa, and 0.33 according to Yahyazadehfar et al. [53]. Equation 1 is a function of α = a/W and the term λ, which is given by
| (2) |
Following completion of the experiments, the fracture surfaces of the specimens were evaluated using Scanning Electron Microscopy (SEM: JEOL JSM 5600 and HITACHI S4700). Additional sacrificial specimens were also prepared and tested to a sub-critical crack length for documenting the participating toughening mechanisms. For these specimens the crack face was polished prior to the testing with 3μm and 0.1 μm diamond particle suspensions and etched with 35% Phosphoric acid for 10 seconds to enhance the observation of microstructure.
For the specimens used in evaluating crack growth in the transverse direction, the width spanned the distance from the DEJ to the occlusal surface of the donor teeth. As such, the fracture surface consisted of a combination of decussated and non-decussated enamel. Decuassation of the enamel rods is critical to the fracture resistance of enamel [9, 53, 55]. Thus, the specimens in this group were evaluated post-failure using the SEM to quantify the degree of decussation (D) from the ratio of decussated fracture area to total fracture area [53]. The estimates of D for each specimen with transverse orientation provided an objective measure of rod characteristics that were used to differentiate those most representative of outer enamel. Only those speecimens with D≤ 40% were accepted for the present study. The average degree of decussation for the control and deproteinized groups was 21 ± 7 % and 34 ± 4%, respectively. A two-way analysis of variance (ANOVA) and Tukey-Kramer tests were performed to identify significant differences between the measures of fracture resistance as a function of orientation and proteins; significance was identified by p≤0.05. A post-hoc power analysis was performed and showed that the number of samples evaluated in each of the groups was adequate to avoid type I errors.
Finite Element Analysis
To quantify the contribution of extrinsic and intrinsic mechanisms to the fracture resistance, a hybrid approach was adopted in which results from the experiments were used as the solution for a finite element model of the fracture process. Briefly, a 2D half model of the enamel inset CT specimen (Figure 2a) was developed using commercial software (ABAQUS Standard, Version 6.9, Dassault Systems). The half-model was constructed according to the dimensions of specimens in the experiments, and consisted of approximately 3500 8-node quadrilateral plane strain elements (CPE8R). A mesh convergence analysis was performed to determine an adequate mesh density. The crack was defined on the symmetry plane of the model and a symmetric condition was applied to the portion that remained intact (i.e. region without crack). At the crack tip the mesh consisted of concentric arcs of quadrilateral elements collapsed down to triangles at the crack tip to define the singularity condition (Figure 2b). This approach allows a smooth transition between the region requiring fine mesh and the coarser mesh further away.
Figure 2.

Details of the finite element model. a) Geometry of the inset CT specimen b) crack tip mesh (element type CPE8R) c) Expected stress-strain curve for enamel and Ramberg-Osgood curve fitting d) Constitutive behavior of springs used to model extrinsic toughening.
To account for inelastic deformation ahead of the crack tip the constitutive behavior of enamel was defined using the Ramberg-Osgood model. The one dimensional Ramberg-Osgood plasticity model is defined as [56]
| (3) |
where σ and ε are the stress and strain, respectively, σo is the yield stress, E is Young’s modulus, α is the yield offset and n is the hardening exponent for the plastic (nonlinear) term (where n>1). A stress-strain curve has not been reported for macro-scale tensile loading of enamel in the literature. Hence, a stress-strain curve was defined for the model (Figure 2(c)) with elastic modulus of 30 GPa [46, 54] and yield strength of 30 MPa after Lawn and Lee [57]. Due to the brittle nature of enamel, the inelastic strain to failure is expected to be very small. The two parameters of α and n in the Ramberg-Osgood model were estimated by curve fitting to be 0.86 and 20.14, respectively.
The cohesive zone behind the crack tip was simulated with a series of non-linear spring elements distributed with a constant distance of 25 μm from one another. The length of the cohesive zone was defined according to experimental observations of the bridging zone, which ranged from 400 μm to 1000 μm, and varied according to the crack direction and length. The near-tip COD distributions obtained from the experimental measurements were used as a solution for stable crack growth simulated using the finite element model. By definition the springs consisted of three components of behavior including damage initiation, damage evolution, and failure as shown in Figure 2(d). The final constitutive behavior of the springs was determined using an iterative process. Briefly, the parameters defining constitutive behavior of the springs were modified until the experimental and the numerical COD profiles reached agreement within a 5% difference. The remaining spring loads were documented and the corresponding bridging stresses were calculated by dividing the spring load by the effective area of the springs. Separate finite element models were developed for the longitudinal and transverse directions of crack growth and for the selected crack lengths examined. Each of the models were used to determine the cohesive zone bridging stress distribution and to calculate the contribution of extrinsic and intrinsic mechanisms to the fracture process.
After achieving agreement between the experimental and numerical COD profiles, the J-integral for each specimen was estimated numerically using a defined set of 15 contours surrounding the crack tip [58]. Moreover, the energy absorbed by the bridging ligaments and plastic deformation around the crack tip was obtained separately. The total J-integral was calculated according to
| (4) |
where Jtip corresponds to the J-integral due to elastic deformation (i.e. LEFM), Jpl accounts for the energy spent by plastic deformation around the crack tip (intrinsic toughening), and the last term in this equation quantifies the energy exhausted by the work of the posterior ligaments that are represented in the model by the spring elements (extrinsic toughening). The relative contribution of the intrinsic and extrinsic mechanisms to the fracture resistance was estimated from the ratios of the individual components of energy (i.e. of deformation and the individual toughening mechanisms) to the total energy to fracture (Jtotal). Differences in the degree of toughening were evaluated for the two crack growth directions and with regards to the protein content. The apparent toughness was then estimated from the J-integral values according to [58]
| (5) |
where J is either Jtip or Jtotal for estimation of the linear elastic (Kc) or effective (Keff) fracture toughness, respectively, and E*=E/(1-ν2) according to the plane strain condition. It is important to note that Keff accounts for contributions of the elastic and inelastic deformation, as well as extrinsic toughening.
RESULTS
Typical load vs load-line displacement curves for quasi-static crack growth within representative control and deproteinized enamel specimens are shown in Figure 3. There are two distinctive regions evident in each of these responses. Region I represents pre-loading and the elastic response, whereas Region II contains the incremental crack growth response until the point of instability. The intersection of these two regions are defined by a distinct drop in load, which occurs at the onset of crack initiation, and is evident in both deproteinized and control responses. A comparison of the curves in Figure 3 for the two conditions reveals some subtle differences. In general, the initiation of crack growth within the control specimens occurred at loads between 4 and 6 Newtons. The initation of crack growth in the deproteinized enamel began at slightly lower loads, ranging between 3 and 5 Newtons. Furthermore, the crack growth process in the deproteinized enamel exhibited less stability overall before resulting in catastrophic fracture.
Figure 3.

Load versus load-line displacement distributions for crack extension in the longitudinal direction within enamel inset CT specimens. Examples are show for the control and deproteinized conditions. The transition from Region I to Region II behavior is identified by a distinct drop in load, which occurs at the onset of crack initiation.
The portion of crack growth history corresponding to stable extension (Region II) of each specimen was used to develop the crack growth resistance curve (i.e. R-curve). A representative R-curve for an enamel specimen of the deproteinized group is shown in Figure 4(a). The responses were quantified in terms of the three characteristic parameters including the initiation toughness (Ko), growth toughness (Kg), and apparent fracture toughness (Kc) as highlighted in this figure. A comparison of R-curves for longitudinal crack growth in the control and deproteinized enamel specimens is shown in Figure 4(b); the responses for the transverse direction of growth are shown in Figure 4(c). Regardless of the direction, the responses exhibit an increase in the resistance to fracture with crack extension. However, as evident in these figures the deproteinized specimens underwent unstable fracture at a lower stress intensity.
Figure 4.

Crack growth resistance of the enamel. a) Representative crack growth resistance curve (R-curve) for the longitudinal direction in a deproteinized specimen. The quantities Ko, Kg, Kc represent the initiation, growth and fracture toughness (maximum Ki), respectively. b) a comparison of the crack growth resistance in the longitudinal direction for control and deproteinized specimens. c) a comparison of the crack growth resistance in the transverse direction for control and deproteinized specimens.
A comparison of the crack growth resistance behavior of the enamel specimens as quantified by the R-curve parameters (Figure 4) is shown in Figure 5. Specifically, the average initiation toughness for the control and deproteinized enamel specimens is shown in Figure 5(a). There was no significant difference in the values of Ko between the two directions of crack growth. However, removal of the proteins caused a significant (25%) reduction in the Ko (0.40 ≤ Ko ≤ 0.62 MPa•m0.5) for the longitudinal direction. For the transverse direction, the Ko values obtained for the control and deproteinized groups were not significantly different (p > 0.05). A comparison of the average growth toughness for the enamel specimens is shown in Figure 5(b). For both directions of crack growth there was a significant difference (p ≤ 0.05) between the control and deproteinized specimens. Removal of the proteins resulted in nearly 60% reduction of the growth toughness with respect to the control in the longitudinal direction. For the transverse direction the reduction in Kg was nearly 70%. As evident from the responses for Kc in Figure 5(c), removal of the proteins was also detrimental to the apparent fracture toughness. For both directions of crack growth the Kc of the deproteinzed group was reduced by approximately 40% with respect to the control specimens.
Figure 5.
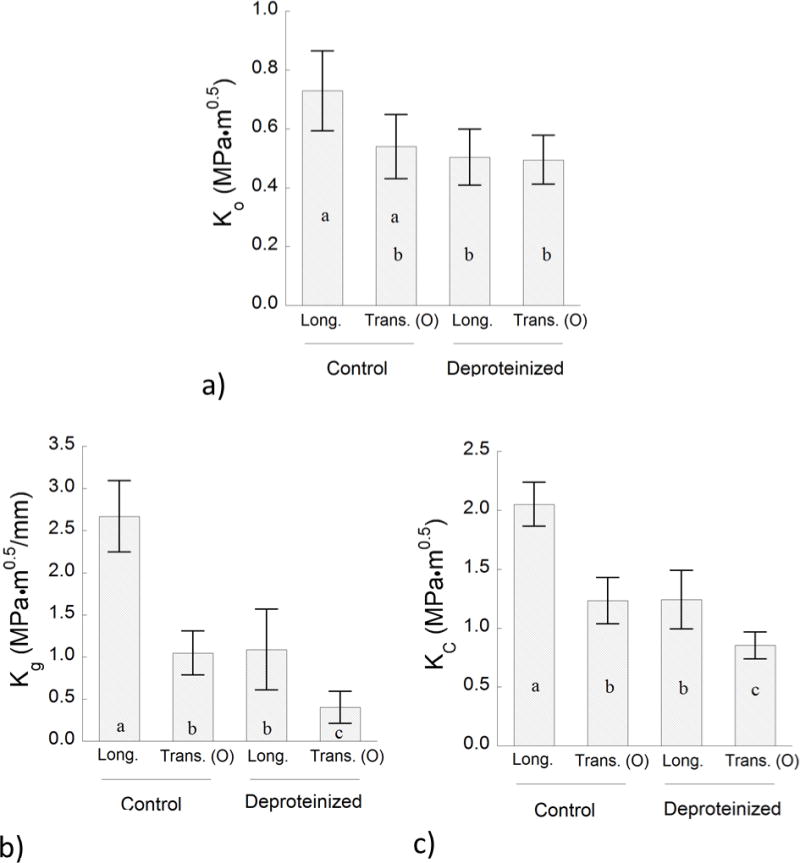
A comparison of the fracture behavior for the control and deproteinized specimens in the two directions of crack growth. a) initiation toughness (Ko), b) growth toughness (Kg), c) fracture toughness (Kc)
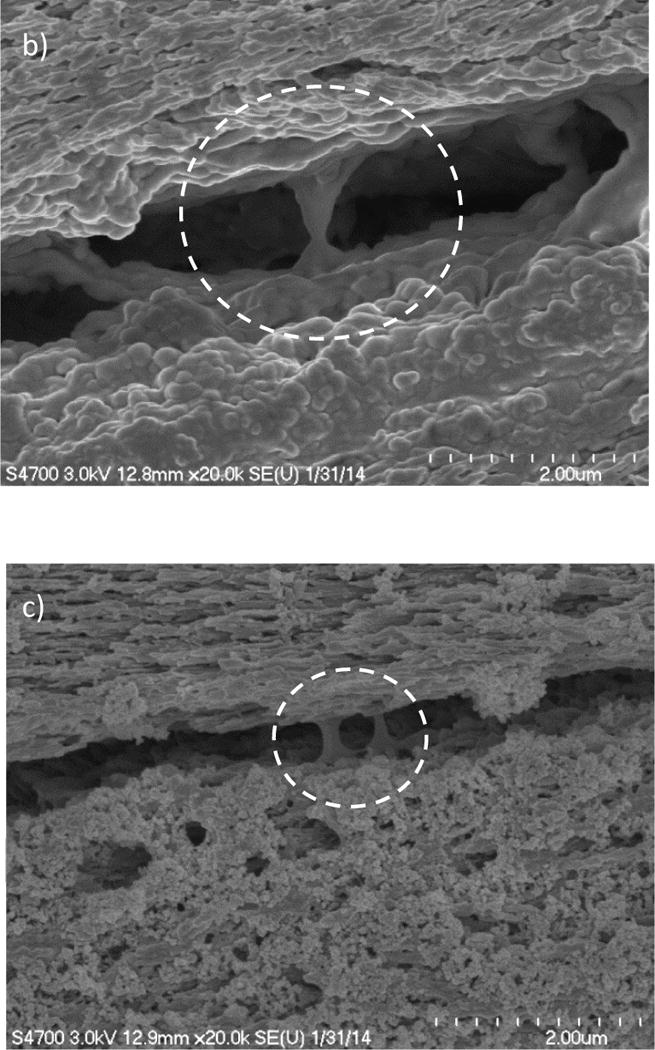
Details concerning the mechanisms of toughening operating in the longitudinal direction of crack growth are shown in Figure 6. Specifically, the crack path in a control specimen is shown in Figure 6(a). Within the outer enamel the cracks followed the rod direction and extended primarily along the interface of adjacent rods. However, as the crack entered the region of decussated rods (i.e. inner enamel) the path of extension became more tortuous. Several different toughening mechanisms were observed at the micro-level (Figure 6(b)) including crack bridging constituted by bundles of rods (e.g. Figure 6(c)), crack deflection and crack bifurcation imposed by the rod curvature (e.g. Figure 6(d)). These mechanistic features are consistent with those identified in previous investigations on the fracture resistance of enamel [9, 10].
Figure 6.

Toughening mechanisms contributing to crack growth in enamel. a) A micrograph of the crack path for the longitudinal direction. Note that the crack starts at the notch (left) and extends as indicated by the arrow. b) Crack growth in the inner (decussated) enamel. Several crack branches develop in the inner enamel as evident in the crack path. c) An example of crack bridging formation within the inner enamel. d) An example of crack bifurcation as the result of severe variation of prisms orientation between the parazone and diazone regions.
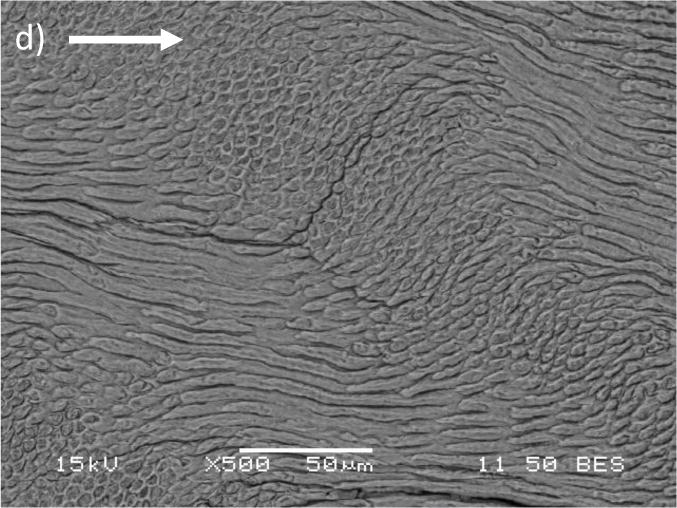
Crack bridges were not limited to the micro-scale, but were observed at lower length scales as well. For example, mineral bridges (Figure 7(a)) were commonly found in the crack wake within both the decussated and non-decussated enamel, and occurred at the interface of adjacent rods. There was also evidence of organic ligaments in the form of protein bridges as shown in Figures 7(b) and 7(c). The majority of protein bridges were identified in specimens that underwent longitudinal crack growth and within the “inner” enamel, where there is greater protein content [59–61]. Protein ligaments were identified in both the main crack (Figure 7(b)) and peripheral micro-cracks adjacent to the crack tip as shown in Figure 7(c).
Figure 7.

Evidence of bridging ligaments at the sub-micron level for crack growth in the longitudinal direction. a) crack extension along the inter-rod region with unbroken ligaments of mineral between the adjacent enamel rods. Protein ligament bridges were evident in the control specimens (b) in the crack wake within the inner enamel, and (c) in microcracks ahead of the crack tip within the specimen of (b).
The crack path within a representative deproteinized enamel specimen and corresponding to the longitudinal direction of extension is shown in Figure 8(a). In the outer enamel the cracks primarily extend along the interface of adjacent rods, as observed in the control. However, there were some notable differences in the extension process as the cracks proceeded within the region of decussation. In the deproteinized specimens, crack deflection was only observed to a limited extent as evident in Figure 8(b). Rather, crack extension primarily occurred along the plane of maximum opening mode stress intensity despite changes in the rod orientation in the decussated region, which caused fracture of the rods. Moreover, although crack bridges developed as the crack proceeded within the region of decussation (Figure 8(c)) they were scant and structurally very weak (consisting of one or two rods). There was no evidence of protein ligament bridges, as expected, and only a small number of active mineral ligaments in peripheral microcracks about the K-dominant region.
Figure 8.

Path of crack growth in a representative deproteinized enamel specimen in the longitudinal direction. a) Micrograph of crack path. The arrow indicates the crack growth direction. b) Micrograph detailing crack extension in the transition region from the outer to decussated enamel. Note that there is no evidence of bridging ligaments. c) Micrograph of crack propagation in th inner enamel. There is no evidence of crack deflection, bridging ligaments or microcracks as noted for the control specimens.
The displacement fields obtained from the DIC analysis were used to quantify the crack opening displacement (COD) distribution behind the crack tip. Representative COD distributions for stable cracks (and lengths a′ ≥ 1.5 mm) just prior instability are shown in Figure 9. The COD distributions from the finite element models are presented without the introduction of extrinsic mechanisms of toughening (i.e. “traction free”), and with assignment of a cohesive zone (i.e. “cohesive”). A comparison of the COD distributions for enamel with proteins is shown in Figure 9(a). Clearly the posterior traction forces of the bridging elements are necessary to achieve agreement with the experimental COD distribution. A similar comparison for the enamel after removal of the proteins is shown in Figure 9(b). Although the response for the traction-free model does not agree with the experiment, the discrepancy is less than noted for the control condition. For transverse crack growth there were limited differences in the COD profiles between results of the experiments and traction-free models (not shown), even in the enamel with proteins. Therefore, posterior bridging by unbroken ligaments was not an important part of the fracture process for transverse crack growth.
Figure 9.

A comparison of the crack opening displacement profiles from the experiments and finite element models. The crack profile is shown from the symmetry plane (i.e. COD/2) for longitudinal crack growth. a) short crack b) long crack. Note that inelastic deformation occurring in front of the crack tip was defined for both traction-free and cohesive model simulations.
After achieving agreement between the experimental and numerical COD distributions, the finite element results were used in estimating the energy to fracture and fracture toughness for long cracks (~1.65 mm) in the two crack growth directions. These results are presented in Table 1 for the longitudinal direction of crack growth. Considering the control, the average estimated fracture energy attributed to the bridging ligaments (Jbr) and inelastic deformation (Jpl) was approximately 41 ± 4 J/m2 and 8 ± 0.5 J/m2, respectively; the sum of these two components represents approximately 35% of the total energy to fracture (136±11 J/m2). According to the larger value of Jbr, enamel is primarily extrinsically toughened. For the deproteinized specimens, the bridging ligaments (Jbr) and inelastic deformation (Jpl) contributed approximately 6 ± 2 J/m2 and 2 ± 0.5 J/m2, respectively to the total fracture energy. The sum of these components contributes approximately 15% of the total energy required for crack propagation (45±15 J/m2). It is important to note that removal of the proteins caused over 60% reduction in the energy release rate. The largest reduction was realized in the contribution of the extrinsic mechanisms of toughening, which decreased by over 80%. When evaluated in terms of the critical stress intensity, removal of the proteins resulted in over 40% reduction in the effective toughness.
Table 1.
Finite element results for the components of fracture energy and toughness of the control and deproteinized enamel for the longitudinal direction of crack growth.
| Jtip | JPl | Jbr | Jtotal | KLEFM | Keff | ||
|---|---|---|---|---|---|---|---|
| Control | Sample 1 | 85.8 | 7.8 | 37.2 | 130.8 | 1.68 | 2.08 |
| Sample 2 | 94.0 | 8.3 | 45.3 | 147.6 | 1.76 | 2.20 | |
| Sample 3 | 79.6 | 7.5 | 41.2 | 128.3 | 1.62 | 2.05 | |
|
| |||||||
| Average | 86.5±7.2 | 7.9±0.40 | 41.2±4.1 | 135.5±10.5 | 1.68±0.1 | 2.11±0.1 | |
|
| |||||||
| Deproteinized | Sample 1 | 50.2 | 2.6 | 8.5 | 61.3 | 1.29 | 1.42 |
| Sample 2 | 33.4 | 2.1 | 5.7 | 41.2 | 1.05 | 1.16 | |
| Sample 3 | 26.2 | 1.9 | 4.3 | 32.4 | 0.93 | 1.03 | |
|
| |||||||
| Average | 36.6±12.3 | 2.2±0.40 | 6.2±2.1 | 45.0±14.8 | 1.09±0.2 | 1.2±0.2 | |
Units for J and K are Pa•m and MPa•m1/2, respectively.
I. Jtip is the fracture energy estimated for linear elastic behavior and is used to calculate Kc
II. Jpl accounts for the energy spent in plastic deformation
III. Jbr is the energy stored in the spring elements
IV. Jtotal is the total fracture energy used to calculate Keff
A summary of the measures of fracture resistance for the transverse direction of crack growth is presented in Table 2. Removal of the proteins also caused a decrease in the critical energy release rate from 34±14 J/m2 to 28±11 J/m2 (a 20% reduction). Yet, in contrast to results for the longitudinal direction, extrinsic toughening had limited contribution to the fracture resistance for both the control or deproteinized enamel. The estimated fracture energy related to inelastic deformation did not exceed 5% of the total energy for crack propagation, even in the control specimens. When evaluated in terms of the effective toughness, there was limited influence of the enamel proteins for transverse crack growth. Removal of the proteins resulted in only 5% reduction in the value of Keff.
Table 2.
Finite element results for the components of fracture energy and toughness of the control and deproteinized enamel for the transverse direction of crack growth.
| Jtip | JPl | Jbr | Jtotal | KLEFM | Keff | ||
|---|---|---|---|---|---|---|---|
| Control | Sample 1 | 47.4 | 2.3 | 0.0 | 49.7 | 1.25 | 1.28 |
| Sample 2 | 27.4 | 1.6 | 0.0 | 29.0 | 0.95 | 0.98 | |
| Sample 3 | 20.4 | 1.3 | 0.0 | 21.7 | 0.82 | 0.85 | |
|
| |||||||
| Average | 31.7±14.0 | 1.7±0.5 | 0.0±0.0 | 33.5±14.5 | 1.0±0.2 | 1.0±0.2 | |
|
| |||||||
| Deproteinized | Sample 1 | 37.2 | 3.5 | 0.0 | 40.7 | 1.11 | 1.16 |
| Sample 2 | 23.0 | 1.9 | 0.0 | 24.9 | 0.87 | 0.90 | |
| Sample 3 | 17.5 | 1.2 | 0.0 | 18.7 | 0.76 | 0.78 | |
|
| |||||||
| Average | 25.9±10.2 | 2.2±1.2 | 0.0±0.0 | 28.1±11.3 | 0.91±0.2 | 0.95±0.2 | |
Units for J and K are Pa•m and MPa•m1/2, respectively.
I. Jtip is the fracture energy estimated for linear elastic behavior and is used to calculate Kc
II. Jpl accounts for the energy spent in plastic deformation
III. Jbr is the energy stored in the spring elements
IV. Jtotal is the total fracture energy used to calculate Keff
DISCUSSION
Regardless of the direction of crack growth, removal of the enamel proteins caused a significant decrease in the fracture resistance. However, the extent of degradation was orientation dependent, and the most substantial changes occurred for cracks extending in the longitudinal direction, i.e. from the occlusal surface towards the DEJ. The largest degradation overall was observed in the growth toughness (Figure 5), which was reduced by more than 60%. Although the removal of proteins also caused a decrease in the degree of toughening for crack extension transverse to the rods, the overall reduction in fracture toughness for this orientation was less than 25%. Clearly the importance of organic proteins on the fracture resistance of enamel is direction dependent and warrants further discussion.
One approach for examining the orientation-dependence in fracture resistance is in terms of the anisotropy. For example, the anisotropy in the initiation toughness (ratio of Ko for the longitudinal and transverse direction) decreased from approximately 1.3 to 1.0 with removal of proteins. There was essentially no decrease in the degree of anisotropy for the growth toughness after removal of the proteins. The ratio of Kg remained near 2.5. Nevertheless, the loss of organic proteins caused a significant decrease in Kg for both directions (Figure 5(b)). Again, the average Kg for the longitudinal direction was reduced by nearly 60%. Regarding the apparent fracture toughness, the degree of anisotropy decreased from approximately 1.6 to 1.3. The reduction in anisotropy reflected in the values of Kg and Kc is critically important as it diminishes the potency of a key mechanism contributing to the fracture resistance of enamel cusps. Specifically, the anisotropy in toughness serves to deflect cracks extending parallel to the rods and facilitates further energy dissipation by encouraging growth in the transverse direction [10]. That diversion deters cracks from reaching the dentin and the tooth’s center, which is critical to tooth survival.
To the authors’ knowledge, the present investigation is the first to quantitatively evaluate the importance of proteins on the fracture behavior of enamel, or any of the biological materials in the “very” highly mineralized group. He and Swain [62] denatured the proteins in enamel via thermal treatment (i.e. burning) and explored the changes in elastic modulus, hardness and indentation creep response via nanoindentation. The hardness and elastic modulus of enamel have been correlated with the mineral content and the orientation of the apatite crystallites [63–65]. Results of their study showed that denaturation caused an increase in the elastic modulus and hardness, and essentially eliminated the viscoelastic/creep response. The indentations placed in the burnt samples reportedly exhibited peripheral microcracks, suggesting that the thermal treatment caused embrittlement. Dehydration is an issue with burning, but not with the KOH treatment. Additional advantages of the KOH process include preservation of the crystallinity and that removal of the proteins occurs without oxidation of the minerals [66]. But there are recognized limitations of the KOH treatment as well. While extraction by KOH was considered superior to burning, success of the KOH treatment relied on diffusion of the solution and release of the proteins, which required a relatively long exposure period (9 days). In addition, the 280nm UV-VIS approach is known to have limited ability to detect low protein concentration in solution and is expected to have contributed to the absence of detected protein concentration in the first few days of treatment. Nevertheless, this technique has been used with success in a prior evaluation of enamel [66]. Future studies aimed at the importance of proteins on the properties of enamel may benefit from adopting more precise techniques for monitoring protein removal and methods for confirming the residual protein content after completion of the treatment.
In the longitudinal direction, crack growth toughening was primarily associated with the extrinsic mechanisms, which constituted over 30% of the total energy to fracture (Table 1). Indeed, the cracks in this orientation proceed within the inner enamel and encounter the decussated enamel rods. As such, toughening ensues from the formation of unbroken ligament bridges that operate over multiple length scales [8, 9, 45, 67, 68]. These bridges work as a symphony of traction elements that cause development of a distributed posterior traction. The hybrid evaluation enabled an opportunity for further understanding the degradation in these. toughening mechanisms with removal of proteins. Estimations for the Crack Closure Stress (CCS) distribution behind the crack tip corresponding to crack extension in the longitudinal direction are shown in Figure 10(a); the results are shown together for the control and deproteinize.d conditions. The CCS is presented as a function of crack opening displacement (δ) in Figure 10(b). This distribution represents the effective constitutive behavior (or cohesive law) of the unbroken ligaments as determined from the iterative approach. According to the hybrid evaluation, removal of the proteins reduced the maximum CCS by a factor of two. Interestingly, in the control condition the the unbroken ligaments lost their capacity for sustaining traction at just over 4 μm of opening displacement. This value was substantially reduced (~2 μm) for the deproteinized enamel, which suggests that removal of the proteins caused a reduction of the strength of the unbroken ligament bridges as well as a decrease in the capacity for deformation. Hence, removal of the proteins did not change the primary mechanism of toughening it simply reduced its potency. Ang et al. [68] estimated the closure stress for very short cracks induced by Vicker’s indentations in bovine enamel. Their assessment adopted the cohesive zone solution of the Dugdale–Muskhelishvili crack model, which assumes that toughening is restricted to bridging stresses behind the crack tip. The estimated bridging stresses ranged from roughly 160 to 800 MPa over a cohesive zone length of 1 to 10 μm [68]. Clearly the magnitude of closure stresses that develop farther from the crack tip are far smaller.
Figure 10.
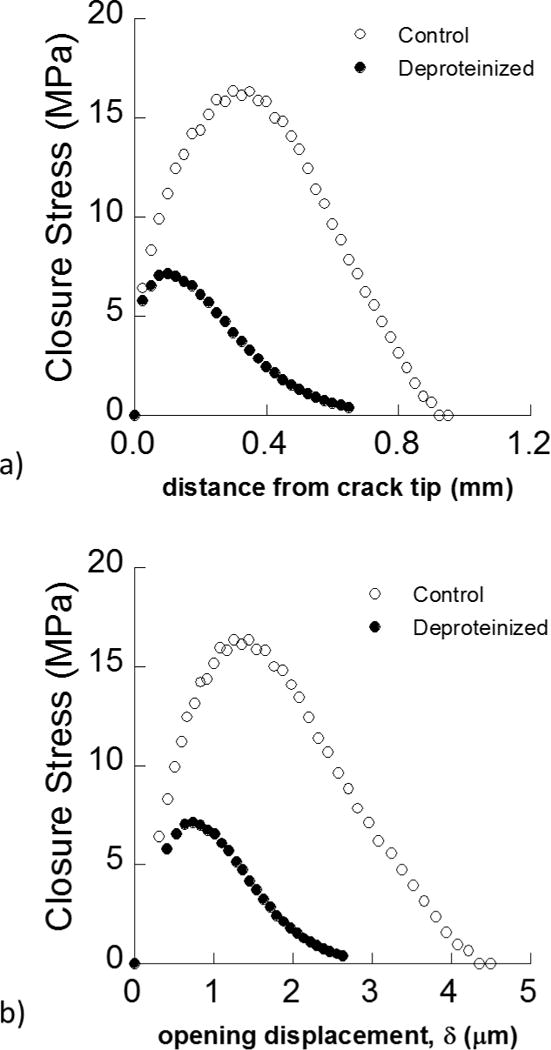
A comparison of the Crack Closure Stress (CCS) profiles for young and deproteinized enamel as a function a) distance from crack tip b) crack opening displacement.
In highly mineralized biomaterials such as enamel and nacre the proteins are credited with several energy dissipation mechanisms including viscoelastic deformation, crack divergence, crack branching and delamination [38]. The origin of this superior behavior of proteinized systems occurs at the nano-scale of all natural materials comprised of staggered structures [69]. The organic content serves as a natural adhesive that binds the minerals via polymeric bonding and sacrificial bonds [30, 31]. Energy dissipation is achieved through the unfolding of proteins, and provides a significant amount of toughening at the nano-scale [70]. Theoretical models for large aspect ratio mineral crystals are combined with protein layers have shown that the systems undergo substantial interfacial shear deformation that is the key to the strength and fracture toughness [24, 35, 71]. In addition, the elastic mismatch of minerals and proteins can foster the development of microcracks, which results in a redistribution of stresses in front of the crack tip [35]. Yet, these theoretical models are unable to predict the real contribution of protein content on the toughening of enamel. According to Bajaj and Arola [8], the toughness solely generated by bridging ligaments develop by the enamel proteins is near 0.10 MPa•m0.5, which is approximately 10% of the intrinsic toughness of enamel. Similarly, estimates for the toughness of proteins active at the interface of mineral platelets in nacre result in values of between 1 to 10 J/m2 [12, 72], which are also very low. The comparatively low toughness of the interface guides the crack to more complex micro structural regions that achieve crack arrest via additional toughening mechanisms [72].
The microscopic analysis for the control samples (Figure 7) revealed that crack bridging at the crystallite level consisted of both mineral and protein ligaments. The mineral ligaments consist of several crystallites that are coupled by a thin layer of proteins (e.g. Figure 7(a)). During crack propagation, these ligaments contribute to the closure stress distribution and dissipate energy by extension and pullout. The protein ligaments (e.g. Figures 7(b) and (c)) dissipate energy by molecular unfolding and rupture of the bonds at the intersection with the mineral crystals [33]. In the deproteinized enamel, there was no evidence of protein ligaments in the crack wake. While mineral bridges were identified in the deproteinized specimens their effectiveness was diminished (Figure 10(b)) by the remaining comparatively weak “sacrificial bonds” between the crystallites of apatite in the absence of the organic content [30]. The SEM analysis showed that removal of the proteins also influenced the extrinsic toughening mechanisms at greater length scales. At the micro level, the effectiveness of the other extrinsic toughening mechanisms such as crack deflection and crack branching were diminished as well (e.g. Figure 8(c)).
Recent advances in fabrication methods such as freeze casting [73], layer by layer deposition [16, 18, 21], thin film deposition [19] and self-assembly [74, 75] provide opportunities for fabricating new classes of engineering materials. Guided by the micro structure of enamel and its ability to deflect cracks toward regions less threatening, Mirkhalaf et al [76] introduce millimeter sized key-hole enamel rod patterns on the surface of glass panels by laser cutting. The patterned glass tolerated 200 times greater fracture energy in relation to the regular glass. According to the most recent experimental evaluations the most potent toughening mechanisms in enamel consist of those that originate from the decussation of rods [9,10]. Thus, future explorations of enamel-inspired structural materials could prove fruitful. It appears that the largest improvements in fracture resistance will be realized by identifying an interfacial material that mimics the constitutive behavior of the proteins and that adheres to the mineral-like components with the same resolve.
Despite the importance of the findings, there are some recognized concerns and limitations. The concerns related to the KOH treatment and monitoring the process of protein extraction were raised and addressed earlier. While it is believed that the protein content was completely removed by the KOH treatment, it was not possible to confirm that through measurements of the protein content afterwards. Of additional concern, the cuspal thickness in some teeth was not adequate to section a cube that consisted exclusively of enamel. A few of the longitudinal specimens did include a portion of the DEJ and dentin near the adhesive bond with resin composite in the frontal field, as evident to the right in Fig. 6(a) and 7(a)). It is important to note that the cracks reached instability at quite a distance before reaching these regions, at least 0.5 mm or greater distance, which was noted from nearly complete drop of the opening mode load. Hence, while it is most desirable that the specimens, these features are not expected to have contributed to the fracture resistance of the samples or the R-curve behavior.
It is easy to dwell on the implications of the findings to the fields of materials science and engineering. The removal of only 1% protein results in nearly 40% decrease in the fracture toughness! But the results are of most immediate importance to the field of dentistry. For instance, teeth whitening procedures cause removal of proteins and potentially even demineralize enamel [77–79]. Post-treatments incorporating mineralizing ions have been added to whitening procedures to help restore the mineral content. This process helps to increase the hardness and elastic modulus to levels that are akin to those prior to the whitening treatment [80–81]. Yet, removal of the enamel proteins is an irreversible process and there is currently no procedure for replacing the lost proteins. New treatments aimed at replacing the enamel proteins post-whitening may be necessary. A recent preliminary study reported that enamel undergoes a process of crack-healing involving crack closure [82]. The question that arises is whether this healing process is purely cosmetic, or if it also restores the integrity of the tissue as well. Further investigations aimed at understanding the contributions of the enamel proteins to healing and their effectiveness appear warranted.
CONCLUSIONS
Based on the results from this investigation, the following conclusions were drawn:
Both the control and deproteinized enamel specimens exhibited rising R-curve behavior in the two directions of crack growth evaluated. However, the deproteinized enamel exhibited substantially less crack growth toughening and lower apparent fracture tougnness.
For the longitudinal direction of crack extension, the average growth toughness (Kg) and fracture toughness (Kc) of the control were 2.66 ± 0.42 MPa•m0.5/mm and 2.05 ± 0.19 MPa•m0.5, respectively. The average Kg (1.09 ± 0.48 Mm0.5/mm) and Kc (1.24 ± 0.24 MPa•m0.5) of the deproteinized enamel were reduced by nearly 60% and 40%, respectively, with respect to the control.
For the transverse direction of extension, the average Kg and Kc of the control enamel were 1.05 ± 0.26 MPa•m0.5/mm and 1.23 ± 0.20 MPa•m0.5, respectively. The average Kg (0.45 ± 0.17 MPa•m0.5/mm) and Kc (0.95 ± 0.20 MPa•m0.5) of the deproteinized enamel were reduced by approximately 60% and 25%, respectively, with respect to the control.
Removal of the proteins resulted in a decrease in the degree of anisotropy in the fracture resistance. When expressed in terms of the ratio of fracture toughness for the longitudinal and transverse directions, there was a reduction in the degree of anisotropy for both the Ko and Kc. Thus, the proteins are critically important to enamel’s ability to deflect cracks from extending towards the dentin and pulp and continuing growth about the tooth’s circumference.
For the longitudinal direction of crack growth enamel is primarily extrinsically toughened. The intrinsic and extrinsic mechanisms of toughening contributed approximately 5% and 30% of the total energy to fracture. However, for the transverse direction of crack growth, extrinsic toughening had minimal contribution to the crack growth resistance.
Removal of proteins caused up to 85% reduction in the contribution of extrinsic toughening to the total energy to fracture. This degradation was attributed to embrittlement and weaking of the bridging ligaments, which manifested as a reduction of the crack closure stress. While mineral bridging ligaments were identified in the deproteinized specimens, they appear to have limited effectiveness in resisting crack growth.
Acknowledgments
The authors acknowledge that this study was supported in part by the National Institutes of Dental and Craniofacial Research through grant (R01 DE016904) and the National Science Foundation (NSF DMR 1337727). The authors would also like to thank Ultradent Products Inc for supplying the Vit-l-escence resin composite.
Footnotes
Publisher's Disclaimer: This is a PDF file of an unedited manuscript that has been accepted for publication. As a service to our customers we are providing this early version of the manuscript. The manuscript will undergo copyediting, typesetting, and review of the resulting proof before it is published in its final citable form. Please note that during the production process errors may be discovered which could affect the content, and all legal disclaimers that apply to the journal pertain.
References
- 1.Baer E, Hiltner A, Morgan RJ. Biological and Synthetic Hierarchical Composites. Phys Today. 1992;45(10):60–67. [Google Scholar]
- 2.Dunlop JWC, Fratzl P. Biological composites. Annu Rev of Mate Res. 2010;40:1–24. [Google Scholar]
- 3.Currey J, Brear K, Zioupos P. Notch sensitivity of mammalian mineralized tissues in impact. Proc Biol Sci. 2004;271(1538):517–522. doi: 10.1098/rspb.2003.2634. [DOI] [PMC free article] [PubMed] [Google Scholar]
- 4.Espinosa HD, Rim JE, Barthelat F, Buehler MJ. Merger of structure and material in nacre and bone-perspectives on de novo biomimetic materials. Prog Mater Sci. 2009;54:1059–1100. [Google Scholar]
- 5.Barthelat F. Biommimetics for next generation materials. Phil Trans R Soc A. 2007;365:2907–19. doi: 10.1098/rsta.2007.0006. [DOI] [PubMed] [Google Scholar]
- 6.Meyers MA, Chen PY, Lin AYM, Seki Y. Biological Materials: Structure and mechanical properties. Prog Mater Sci. 2008;53:1–206. doi: 10.1016/j.jmbbm.2008.02.003. [DOI] [PubMed] [Google Scholar]
- 7.Launey ME, Ritchie RO. On the fracture toughness of advanced materials. Adv Mater. 2009;21:2103–2110. [Google Scholar]
- 8.Bajaj D, Arola D. On the R-curve behavior of human tooth enamel. Biomater. 2009;30(23–24):4037–46. doi: 10.1016/j.biomaterials.2009.04.017. [DOI] [PMC free article] [PubMed] [Google Scholar]
- 9.Bechtle S, Habelitz S, Klocke A, Fett T, Schneider GA. The fracture behavior of dental enamel. Biomater. 2010;31(2):375–384. doi: 10.1016/j.biomaterials.2009.09.050. [DOI] [PubMed] [Google Scholar]
- 10.Yahyazadehfar M, Bajaj D, Arola D. Hidden contribution of the enamel rods on the fracture resistance of human teeth. Acta Biomater. 2013;9:4806–14. doi: 10.1016/j.actbio.2012.09.020. [DOI] [PMC free article] [PubMed] [Google Scholar]
- 11.Sarikaya M, Gunnison KE, Yasrebi M, Aksay IA. Mechanical property-microstructural relationships in albone shell. MRS proceedings. 1989;174:109–116. [Google Scholar]
- 12.Barthelat F, Espinosa HD. An experimental investigation of deformation and fracture of nacre-mother of pearl. Exp Mech. 2007;47(3):311–24. [Google Scholar]
- 13.Rabiei R, Bekah S, Barthelat F. Failure mode transition in nacre and bone-like materials. Acta Biomater. 2010;6:4081–89. doi: 10.1016/j.actbio.2010.04.008. [DOI] [PubMed] [Google Scholar]
- 14.Kamat S, Su X, Ballarini R, Heuer AH. Structural basis for the fracture toughness of the shell of the conch strombus gigas. Nature. 2000;405:1036–40. doi: 10.1038/35016535. [DOI] [PubMed] [Google Scholar]
- 15.Barthelat F, Tang H, Zavattieri PD, Li C-M, Espinosa HD. On the mechanics of mother-of-pearl: A key feature in the material hierarchical structure. J Mech Phys Solids. 2007;55(2):306–337. [Google Scholar]
- 16.Meyers MA, Lin AYM, Chen PY, Muyco J. Mechanical Strength of Abalone Nacre: Role of the Soft Organic Layer. J Mech Behav Biomed Mat. 2008;1:76–85. doi: 10.1016/j.jmbbm.2007.03.001. [DOI] [PubMed] [Google Scholar]
- 17.Tang ZK, Kotov NA, Magonov S, Ozturk B. Nanostructured artificial nacre. Nat Mater. 2003;2:413–418. doi: 10.1038/nmat906. [DOI] [PubMed] [Google Scholar]
- 18.Podsiadlo P, Kaushik A, Arruda E, Waas A, Shim B, Xu J. Ultrastrong and stiff layered polymer nanocomposites. Science. 2007;318:80–83. doi: 10.1126/science.1143176. [DOI] [PubMed] [Google Scholar]
- 19.Chen L, Ballarini R, Kahn H, Heuer A. Bioinspired micro-composite structure. J Mater Res. 2007;22:124–31. [Google Scholar]
- 20.Munch E, Launey ME, Alsem DH, Saiz E, Tomsia AP, Ritchie RO. Tough, bio-inspired hybrid materials. Science. 2008;322:1516–20. doi: 10.1126/science.1164865. [DOI] [PubMed] [Google Scholar]
- 21.Bonderer L, Studart A, Gaukler L. Bioinspired design and assembly of platelet reinforced polymer films. Science. 2008;319:1069–73. doi: 10.1126/science.1148726. [DOI] [PubMed] [Google Scholar]
- 22.Launey ME, Munch E, Alsem DH, Saiz E, Tomsia AP, Ritchie RO. A novel biomimetic approach to the design of high-performance ceramic-metal composites. J Roy Soc Interface. 2010;7:741–53. doi: 10.1098/rsif.2009.0331. [DOI] [PMC free article] [PubMed] [Google Scholar]
- 23.Gao HJ, Ji BH, Jager IL, Arzt E, Fratzl P. Materials become insensitive to flaws at nanoscale: lessons from nature. Proc Natl Acad Sci USA. 2003;100(10):5597–600. doi: 10.1073/pnas.0631609100. [DOI] [PMC free article] [PubMed] [Google Scholar]
- 24.Gao HJ. Application of fracture mechanics concepts to hierarchical biomechanics of bone and bone-like materials. Inter J Frac. 2006;138:101–137. [Google Scholar]
- 25.Buehler MJ, Keten S, Ackbarow T. Theoretical and computational hierarchical manomechanics of protein materials: deformation and fracture. Prog Mater Sci. 2008;53:1101–1241. [Google Scholar]
- 26.Sen D, Buehler MJ. Structure hierarchies define toughness and defect-tolerance despite simple and mechanically inferior brittle building blocks. Sci Rep. 2011;1 doi: 10.1038/srep00035. article 35. [DOI] [PMC free article] [PubMed] [Google Scholar]
- 27.Bargmann S, Scheider I, Xiao T, Yilmaz E, Schneider GA, Huber N. Towards bio-inspired engineering materials: Modeling and simulation of the mechanical behavior of hierarchical bovine dental structure. Comput Mater Sci. 2013;79:390–401. [Google Scholar]
- 28.Ballarini R, Kayacan R, Ulm FJ, Belytschko T, Heuer AH. Biological structures mitigate catastrophic fracture through various strategies. Int J Fract. 2005;135(1–4):187–97. [Google Scholar]
- 29.Hunter GK, Hauschka PV, Poole AR, Rosenberg LC, Goldberg HA. Nucleation and inhibition of hydroxyapatite formation by mineralized tissue proteins. Biochem J. 1996;317:59–64. doi: 10.1042/bj3170059. [DOI] [PMC free article] [PubMed] [Google Scholar]
- 30.Fanter GE, Hassenkam T, Kindt JH, Weaver JC, Birkedal H, Pechenik L, Cutroni JA, Cidade GA, Stucky GD, Morse DE, Hansma PK. Sacrificial bonds and hidden length dissipate energy as mineralized fibrils separate during bone fracture. Nat Mater. 2005;4:612–16. doi: 10.1038/nmat1428. [DOI] [PubMed] [Google Scholar]
- 31.Fanter GE, Oroudjev E, Schitter G, Golde LS, Thurner P, Finch M, Turner P, Gutsmann T, Morse DE, Hansma H, Hansma PK. Sacrificial bonds and hidden length: unraveling molecular mesostructures in tough materials. Biophys J. 2006;90(4):1411–8. doi: 10.1529/biophysj.105.069344. [DOI] [PMC free article] [PubMed] [Google Scholar]
- 32.Jackson AP, Vincent JFV, Turner RM. The mechanical design of nacre. Proc Roy Soc Lond. 1988;234(1277):415–40. [Google Scholar]
- 33.Smith BL, Schaeffer TE, Viani M, Thompson JB, Frederick NA, Kindt J, et al. Molecular mechanistic origin of the toughness of natural adhesives fibres and composites. Nature. 1999;399(6738):761–3. [Google Scholar]
- 34.Song F, Soh AK, Bai YL. Structural and mechanical properties of the organic matrix layers of nacre. Biomater. 2003;24(20):3623–31. doi: 10.1016/s0142-9612(03)00215-1. [DOI] [PubMed] [Google Scholar]
- 35.Ji BH, Gao HJ. Mechanical properties of nanostructure of biological materials. J Mech Phys Solid. 2004;52(9):1963–90. [Google Scholar]
- 36.Neves NM, Mano JF. Structure/mechanical behavior relationships in crossed-lamellar sea shells. Mater Sci Eng. 2005;25(2):113–118. [Google Scholar]
- 37.Lopez MI, Meza Martinez PE, Meyers MA. Organic interlamellar layers, mesolayers and mineral nanobridges: contribution to strength in abalone (Haliotis rufescence) nacre. Acta Biomater. 2014;10(5):2056–64. doi: 10.1016/j.actbio.2013.12.016. [DOI] [PubMed] [Google Scholar]
- 38.Mayer G. New toughening concepts for ceramic composites from rigid natural materials. J Mech Behav Biomed Mater. 2011;4:670–681. doi: 10.1016/j.jmbbm.2010.08.001. [DOI] [PubMed] [Google Scholar]
- 39.Nanci A. Ten Cate’s Oral Histology: Development, Structure, and Function. 7. Mosby-Year Book Inc; 2008. [Google Scholar]
- 40.Robinson C, Kirkham J, Shore R. Dental Enamel Formation to Destruction. CRC Press; 1995. [Google Scholar]
- 41.White SN, Luo W, Paine ML, Fong H, Sarikaya M, Snead ML. Biological organization of hydroxyapatite crystallites into a fibrous continuum toughens and controls anisotropy in human enamel. J Dent Res. 2001;80:321–327. doi: 10.1177/00220345010800010501. [DOI] [PubMed] [Google Scholar]
- 42.Boyde A. The structure and development of mammalian enamel. Queen Mary University of London; 1964. [Google Scholar]
- 43.Macho GA, Jiang Y, Spears IR. Enamel microstructure-a truly three-dimensional structure. J Hum Evol. 2003;45(1):81–90. doi: 10.1016/s0047-2484(03)00083-6. [DOI] [PubMed] [Google Scholar]
- 44.Homma K. Historical studies on the Striae of Hunter-Schreger. Dent Jpn. 1990;27:141–145. [PubMed] [Google Scholar]
- 45.Bajaj D, Arola D. Role of prism decussation on the fatigue crack growth and fracture of human enamel. Acta Biomater. 2009;5(8):3045–56. doi: 10.1016/j.actbio.2009.04.013. [DOI] [PMC free article] [PubMed] [Google Scholar]
- 46.Ang SF, Bortel EL, Swain MV, Klocke A, Schnieder GA. size-dependent elastic/inelastic behavior of enamel over millimeter and nanometer length scales. Biomater. 2010;31:1955–1963. doi: 10.1016/j.biomaterials.2009.11.045. [DOI] [PubMed] [Google Scholar]
- 47.Stoscheck CM. Quantitation of protein. Methods Enzymol. 1990;182:50–69. doi: 10.1016/0076-6879(90)82008-p. [DOI] [PubMed] [Google Scholar]
- 48.Zhang D, Nazari A, Soappman M, Bajaj D, Arola D. Methods for examining the fatigue and fracture behavior of hard tissues. Exp Mech. 2007;47(3):325–336. [Google Scholar]
- 49.Mahoney E, Holt A, Swain M, Kilpatrick N. The hardness and modulus of elasticity of primary molar teeth: and ultra-micro-indentation study. J of Dent. 2000;28(8):589–94. doi: 10.1016/s0300-5712(00)00043-9. [DOI] [PubMed] [Google Scholar]
- 50.Cuy TL, Mann AB, Livi KJ, Teaford MF, Weihs TP. Nanoindentation mapping of the mechanical properties of human molar tooth enamel. Arch Oral Bio. 2002;47(4):281–91. doi: 10.1016/s0003-9969(02)00006-7. [DOI] [PubMed] [Google Scholar]
- 51.He LH, Swain MV. Understanding the mechanical behavior of human enamel from its structure and compositional characteristics. J Mech Behav Biomed Mater. 2008;1(1):18–29. doi: 10.1016/j.jmbbm.2007.05.001. [DOI] [PubMed] [Google Scholar]
- 52.Park S, Wang DH, Zhang D, Romberg E, Arola D. Mechanical properties of enamel as a function of age and location in the tooth. J Mater Sci Mater in Med. 2008;19(6):2317–24. doi: 10.1007/s10856-007-3340-y. [DOI] [PubMed] [Google Scholar]
- 53.Yahyazadehfar M, Nazari A, Kruzik JJ, Quinn GD, Arola D. An Inset CT specimen for evaluating fracture in small samples of material. J Mech Behav Biomed Mater. 2014;30:358–68. doi: 10.1016/j.jmbbm.2013.10.017. [DOI] [PMC free article] [PubMed] [Google Scholar]
- 54.Bajaj Crack. Ph D Dissertation, University of Maryland. Baltimore County, Ann Arbor: ProQuest/UMI; 2010. Growth Resistance of human Tooth Enamel: Mechanism of Toughening and Energy Dissipation. [Google Scholar]
- 55.Bajaj D, Nazari A, Eidelman N, Arola D. A comparison of fatigue crack growth in human enamel and hydroxyapatite. Biomater. 2008;29(36):4847–4854. doi: 10.1016/j.biomaterials.2008.08.019. [DOI] [PMC free article] [PubMed] [Google Scholar]
- 56.Ramberg W, Osgood WR. Description of stress-strain curves by three parameters. NACA (technical note) 1943;902(19930081614):1–28. [Google Scholar]
- 57.Lawn BR, Lee JJW. Analysis of fracture and deformation modes in teeth subjected to occlusal loading. Acta Biomater. 2009:2213–21. doi: 10.1016/j.actbio.2009.02.001. [DOI] [PubMed] [Google Scholar]
- 58.Anderson TL. Fracture mechanics fundamentals and applications. 3. Boca Raton, FL: CRC Press; 2005. [Google Scholar]
- 59.Robinson C, Briggs HD, Atkinson PJ, Weatherel JA. Matrix and Mineral changes in developing Enamel. J Dent Res. 1979;58:871–82. doi: 10.1177/00220345790580024101. [DOI] [PubMed] [Google Scholar]
- 60.Robinson C, Weatherell JA, Hallsworth AS. Variation in composition of dental enamel within ground tooth sections. Caries Res. 1971;5(1):44–57. doi: 10.1159/000259731. [DOI] [PubMed] [Google Scholar]
- 61.Setally Azevedo Macena M, de Alencar e Silva Leite ML, de Lima Gouveia C, de Lima TA, Athayde PA, de Sousa FB. A comparative study on component volumes from outer to inner dental enamel in relation to enamel tufts. Arch Oral Biol. 2014;59(6):568–77. doi: 10.1016/j.archoralbio.2014.03.001. [DOI] [PubMed] [Google Scholar]
- 62.He LH, Swain MV. Influence of environment on the mechanical behavior of mature human enamel. Biomater. 2007;28:4512–4520. doi: 10.1016/j.biomaterials.2007.06.020. [DOI] [PubMed] [Google Scholar]
- 63.Ge J, Cui FZ, Wang XM, Feng HL. Property variations in the prisms and the organic sheath within enamel by nanoindentation. Biomater. 2005;26:3333–39. doi: 10.1016/j.biomaterials.2004.07.059. [DOI] [PubMed] [Google Scholar]
- 64.Eimar H, Ghadimi E, Marelli B, Vali H, Nazhat SN, Amin WM, Torres J, Ciobanu O, Albuquerque Junior RF, Tamimi F. Regulation of enamel hardness by its crystallographic dimensions. Acta Biomater. 2012;8(9):3400–3410. doi: 10.1016/j.actbio.2012.06.002. [DOI] [PubMed] [Google Scholar]
- 65.An B, Wang R, Zhang D. Role of crystal arrangement on the mechanical performance of enamel. Acta Biomater. 2012;8:3784–3793. doi: 10.1016/j.actbio.2012.06.026. [DOI] [PubMed] [Google Scholar]
- 66.Taube F, Ylmen R, Schukarev A, Nietzsche S, Noren JG. Morphological and chemical characterization of tooth enamel exposed to alkaline agents. J Dent. 2010;38:72–81. doi: 10.1016/j.jdent.2009.09.006. [DOI] [PubMed] [Google Scholar]
- 67.Padmanabhan SK, Balakrishnan A, Chu MC, Kim TN, Cho SJ. Micro-indentation fracture behavior of human enamel. Dent Mater. 2010;26(1):100–104. doi: 10.1016/j.dental.2009.07.015. [DOI] [PubMed] [Google Scholar]
- 68.Ang SF, Schulz A, Pacher Fernandes R, Schneider GA. Sub-10-micrometer toughening and crack tip toughness of dental enamel. J Mech Behav Biomed Mat. 2011;4:423–432. doi: 10.1016/j.jmbbm.2010.12.003. [DOI] [PubMed] [Google Scholar]
- 69.Buehler MJ, Yung YC. Deformation and failure of protein materials in physiologically extreme conditions and disease. Nat Mater. 2009;8:175–188. doi: 10.1038/nmat2387. [DOI] [PubMed] [Google Scholar]
- 70.Sumitomo T, Kakisawa H, Owaki Y, Kagawa Y. In situ transmission electron microscopy observation of reversible deformation in nacre organic matrix. J Mat Res. 2008;23(5):1466–71. [Google Scholar]
- 71.Barthelat F, Rabiei R. Toughness amplification in natural composites. J Mech Phys Sol. 2011;59:829–840. [Google Scholar]
- 72.Khayer DA, Rabiei R, Barthelat F. The weak interfaces within tough natural composites: experiments on three types of nacre. J Mech Behav Biomed Mater. 2013;19:50–60. doi: 10.1016/j.jmbbm.2012.09.004. [DOI] [PubMed] [Google Scholar]
- 73.Deville S, Saiz E, Nalla RK, Tomsia AP. Freezing as a path to build complex composites. Science. 2006;311:515–8. doi: 10.1126/science.1120937. [DOI] [PubMed] [Google Scholar]
- 74.Zhang S. Fabrication of novel biomaterials through molecular self-assembly. Nat Biotech. 2003;21:1171–78. doi: 10.1038/nbt874. [DOI] [PubMed] [Google Scholar]
- 75.Walther A, Bjurhager I, Malho JM, Pere J, Ruokolainen J, Berglund LA, Ikkala O. Largearea, lightweight and thick biomimetic composites with superior material properties via fast, economic, and green pathways. Nano Lett. 2010;10:2742–48. doi: 10.1021/nl1003224. [DOI] [PubMed] [Google Scholar]
- 76.Mirkhalaf M, Dastjerdi AK, Barthelat F. Overcoming the brittleness of glass through bioinspiration and micro-architecture. Nat Comm. 2014;5:3166–74. doi: 10.1038/ncomms4166. [DOI] [PubMed] [Google Scholar]
- 77.Efeoglu N, Wood D, Efeoglu C. Microcomputerised tomography evaluation of 10% carbamide peroxide applied to enamel. J Dent. 2005;33(7):561–7. doi: 10.1016/j.jdent.2004.12.001. [DOI] [PubMed] [Google Scholar]
- 78.Jiang T, Ma X, Wang Y, Tong H, Shen X, Hu Y, Hu J. Investigation of the effects of 30% hyrogen peroxide on human tooth enamel by raman scattering and laser-induced fluorescence. J Biomed Opt. 2008;13(014019):1–9. doi: 10.1117/1.2870114. [DOI] [PubMed] [Google Scholar]
- 79.Lubarsky GV, Lemoine P, Meenan BJ, Deb S, Mutreja I, Carolan P, Petkov N. Enamel proteins mitigate mechanical and structural degradation in mature human enamel during acid attack. Mat Res Expr. 2014;1(2):1–20. (025404) [Google Scholar]
- 80.Attin T, Betke H, Schippan F, Wiegand A. Potential of fluoride carbamide peroxide gels to support post-bleaching enamel re-hardening. J Dent. 2007;35:755–59. doi: 10.1016/j.jdent.2007.06.005. [DOI] [PubMed] [Google Scholar]
- 81.Chen HP, Chang CH, Liu JK, Chuang SF, Yang JY. Effect of fluoride containing bleaching agents on enamel surface properties. J Dent. 2008;36:718–725. doi: 10.1016/j.jdent.2008.05.003. [DOI] [PubMed] [Google Scholar]
- 82.Rivera C, Arola D, Ossa A. Indentation damage repair and crack repair in human enamel. J Mech Behav Biomed Mater. 2013;21:178–84. doi: 10.1016/j.jmbbm.2013.02.020. [DOI] [PMC free article] [PubMed] [Google Scholar]