

Abstract
Background
Equitable distribution of health system resources has been a serious challenge for long ago among the health policy makers. Conducted studies have mostly ever had emphasis on equality rather than equity. In this paper we have attempted to examine both equality and equity in resources distribution.
Method
This is an applied and descriptive study in which we plotted Lorenz and concentration curves to describe graphically the distribution of hemodialysis beds and nephrologists as two complementary resources in health care in relation to hemodialysis patients. To end this, inequality and inequity were measured by calculating Gini- coefficient, concentration and Robin Hood indices. We used STATA and EXCEL software to calculate indicators.
Results
The results showed that inequality was not seen in hemodialysis beds in population level. However, distribution of nephrologists without considering population needs was accompanied with some sort of inequality. Gini- coefficient for beds and nephrologists distribution in population level was respectively 0.02 and 0.38. Hence, calculation of concentration index for distribution of hemodialysis beds and nephrologists with regard to population needs indicated that unlike beds distribution, equity gap between nephrologists distribution against patients distribution among the provinces was considerably significant again.
Conclusion
Our results imply that although hemodialysis beds in Iran have been distributed in connection with the population need, nephrologists’ distribution is not the same as hemodialysis beds one and this imbalance in complementary resources, can affect both efficiency and equitable access to services for population.
Keywords: Equity, Lorenz curve, Gini- coefficient, Concentration index
Introduction
Issues related to the equity in distribution of health resources are considered as the most important challenges for researchers, planners and policy-makers in the health sector (1, 2). Equity, by definition, means equal distribution of resources among the people in consideration of their needs (3–6). Conducted studies in Iran have mostly assessed the geographical distribution of resources in population level. That is, distribution without considering the population needs. These studies point out that Iran’s provinces have enjoyed the equitable distribution of non-cardiac intensive care beds and human resources but kidney transplant beds and NICU (Neonatal Intensive Care Unit) have been unfairly distributed (7–9). One of the most applicable indicators used across the world to measure the size of inequity and equality in health care resources is Gini coefficient (10, 11). However, other indicators like concentration index and Robin Hood have also been applied to take out the scale of equity in distributed resources (11, 12). Hospital beds and specialists in health systems are considered as two of the most precious resources (13). In most cases inappropriate distribution of this complementary resources can, on one hand, lead to the wasting health resources and, on the other hand, imposing extra cost on patients (14). The issue is as much important that the world health organization (WHO) has also emphasized on the necessity of attention to the equity principle in distribution of health resources, because one of the leading indicators in health systems (i.e. access) is met with equitable distribution (15, 16). These problems are mostly seen among the developing countries due to weaknesses in information infrastructure of health system (17, 18). Chronic kidney diseases (CKD) and end-stage renal disease (ESRD) are of the most important conditions that not only threaten the physical health of patients but they also have an enormous potential to impose huge pressure on the budget restrictions of health systems (19). Poor referrals and diagnosis, which may be resulted from inequity in distribution of kidney – related specialties, can provide the situation for high-risk patients to reach (ESRD). In other words, management and control of these kinds of diseases, to a large extent, depend on the ways upon which the related resources have been distributed (20). The more distribution is equitable, the easier management and their control would be (17). Therefore, management and control of risk factors increasing chronic kidney failure and also improving quality of services delivered to the dialysis patients depend on the implementing of integrated medical practices as well as providing equitable access to complementary needed resources (21). According to the recent statistics, there are 18545 hemodialysis patients, 3775 hemodialysis beds and 335 nephrologists in Iran. Statistics show that annually growth rate of hemodialysis patients in Iran is about 12%. Additionally, the prevalence of (CKD) in Iran is nearly 20 times more than ESRD (19). Thus necessity of paying attention to equity as a rational and moral principal in distribution of resources whether physically or humane among the provinces can be a suitable strategy to slow the quantity of patients demanding kidney replacement treatments through earlier diagnosis and as well as help the improvement of quality of delivered services to the hemodialysis patients and finally can reduce the pressure on scarce resources (19, 20).
Lorenz curve and Gini coefficient along with concentration index and Robin Hood are among the frequently used indicators very often applied to analyze equity and equality in distribution of health resources (22, 23). Lorenz curve compares the distribution of a specific variable with equal distribution of same variable, while in calculation of concentration index; the distribution of two different variables is assessed (21). According to the best available information, in Iran such a study with this approach has not been conducted yet.
Thus, this study aimed to evaluate equity in geographical distribution of nephrologists and hemo-dialysis beds at the same time in Iran based on the need indicator (i.e. the number of hemodialysis patients in population deciles) using Lorenz curve, Gini coefficient, concentration and Robin Hood index, in order to provide better understanding for policy makers from the status of complementary resources allocation and a clue for making decision towards narrowing inequitable gap in access to health care resources.
Methods
Geographical units of analysis
Iran consists of 30 provinces that generally all of health care services in every Province are supervised through medical science university. In this research, we considered every Province as an analysis unit. Therefore, all data for 2011 year including the number of hemodialysis patients, hemodialysis beds and the number of nephrologists per each Province were collected from heath ministry of Iran. Then we calculated data parameters (e.g. the number of beds and nephrologists per 10000 populations and the number of patients per 10000 populations).
Measuring equality and equity
We used Gini coefficient to assess equality in distribution of beds and nephrologists in population level. Its values range from ‘0’ (zero) (perfect equality) to ‘1’ (one) (maximum inequality) (25). In present study we used suggested formula by Brown (26) as follows:
- G:
Gini index
- Yi:
cumulative percentage of hemodialysis beds and nephrologists in its province
- Xi:
cumulative percentage of beds and nephrologists to population in its province
- K:
total number of provinces
To achieve this aim, we sorted (x) axis in ascending order once according to bed- to - population ratio and once more in the same order based on nephrologists- to- population ratio . Then we plotted cumulative percentage of the proportion of beds and nephrologists in (y) axis against cumulative percentage of sorted population in (x) axis to shape Lorenz curve. In the next stage, in order to evaluate the status of equity in distribution of hemodialysis beds and nephrologists with regard to hemodialysis patients, we ranked the population based on the number of hemodialysis patients in every Province in a descending order on (x) axis, and also placed the cumulative percentage of hemodialysis patients, beds and nephrologists in (y) axis to provide the feasibility of comparison between distribution of beds and nephrologists with patients at the same time on one graph. Then we plotted the corresponding points in (x) and (y) axes to construct three concentration curves and finally computing concentration index. It is defined as 2* area between 45 line and concentration curve. If variable is disproportionately concentrated on poorest or richest people, its value would be different from – ‘1’(minus one) to ‘1’(positive one) and in proportionate distribution, its value is ‘0’(zero) (27). We named the distance between concentration curve in patients’ distribution and two other concentration curves (i.e. beds and nephrologists)” equity gap” (figure 3).
Fig. 3:

Concentration curve of distribution of hemodialysis patients, hemodialysis beds and nephrologists
In addition, we measured the scale of inequity in distribution of hemodialysis beds and nephrologists with another indicator namely Robin Hood firstly by comparing real need and allocated resources in each population decile and then subtracting real need from extra allocated resources and finally by summing total extra allocated resources. We assumed that this extra allocated resources should be redistributed toward in need population deciles (12). STATA (version 11) and Excel software were used for calculation of indicators.
- R=
Robin Hood index
- i=
the number of deciles
- n=
total number of deciles
- A=
access in i decile(%)
- N=
need in i decil(%)
Results
Findings related to geographical distribution of hemodialysis patients:
There were 18585 hemodialysis patients in Iran in 2011. Tehran had the maximum number of patients with 3991 and the minimum number of hemodialysis patients belonged to the Elam Province with 85 patients. In other words, 21% of these patients belonged to the Tehran province. In general, 5 provinces including Tehran, Fars, Isfahan, Khorasan-e Razavi and Khuzestan had 50% of hemodialysis patients (Table 1). On average, there were 25 dialysis patients per 100000 populations. The number of patients per 100000 populations varied greatly from minimum 9 in Sistan and Belochestan Province to 34 in Bushehr Province. Table 1 also shows that 50% of population compromises 55% of patients and in the same way 75% of population accounts for 80% of patients. The Gini coefficient of the distribution of hemodialysis patients in population level was 0.06 (Table 2).
Table 1:
Iran population, the number of hemodialysis patients, nephrologists, hemodialysis beds and their cumulative percentage in each province
| ID | Province | Population | N patient |
N Neph |
N bed |
PCP | BCP | PACP | NCP |
|---|---|---|---|---|---|---|---|---|---|
| 1 | Tehran | 14795116 | 3991 | 151 | 666 | 0.20 | 0.18 | 0.22 | 0.45 |
| 2 | Khorasan rezavi | 5940766 | 1811 | 21 | 378 | 0.28 | 0.28 | 0.31 | 0.51 |
| 3 | Fars | 4528514 | 1348 | 22 | 289 | 0.34 | 0.36 | 0.39 | 0.58 |
| 4 | Esfahan | 4804458 | 1240 | 30 | 247 | 0.40 | 0.42 | 0.45 | 0.67 |
| 5 | khozestan | 4471488 | 972 | 13 | 201 | 0.46 | 0.48 | 0.50 | 0.71 |
| 6 | West azarbayejan | 3016301 | 904 | 2 | 168 | 0.50 | 0.52 | 0.55 | 0.71 |
| 7 | East azarbayejan | 3691270 | 896 | 14 | 188 | 0.55 | 0.57 | 0.60 | 0.76 |
| 8 | Mazanderan | 3037336 | 788 | 11 | 163 | 0.59 | 0.62 | 0.64 | 0.79 |
| 9 | Gilan | 2453469 | 769 | 5 | 154 | 0.63 | 0.66 | 0.69 | 0.80 |
| 10 | Golestan | 1687086 | 454 | 3 | 97 | 0.65 | 0.69 | 0.71 | 0.81 |
| 11 | Kermanshah | 1905793 | 441 | 5 | 78 | 0.67 | 0.71 | 0.73 | 0.83 |
| 12 | Kerman | 2947346 | 413 | 6 | 84 | 0.71 | 0.73 | 0.76 | 0.84 |
| 13 | Ghom | 1127713 | 367 | 5 | 61 | 0.73 | 0.75 | 0.78 | 0.86 |
| 14 | Hamedan | 1699588 | 360 | 7 | 82 | 0.75 | 0.77 | 0.80 | 0.88 |
| 15 | Kordestan | 1467585 | 330 | 3 | 87 | 0.77 | 0.79 | 0.81 | 0.89 |
| 16 | Markazi | 1392435 | 328 | 5 | 84 | 0.79 | 0.81 | 0.83 | 0.90 |
| 17 | Bushehr | 943535 | 322 | 1 | 52 | 0.80 | 0.83 | 0.85 | 0.91 |
| 18 | Hormozgan | 1558878 | 318 | 3 | 73 | 0.82 | 0.85 | 0.87 | 0.92 |
| 19 | Ardabil | 1242956 | 304 | 2 | 72 | 0.84 | 0.87 | 0.88 | 0.92 |
| 20 | Yazd | 1065893 | 280 | 9 | 64 | 0.85 | 0.88 | 0.90 | 0.95 |
| 21 | Ghazvin | 1212464 | 280 | 3 | 37 | 0.87 | 0.89 | 0.91 | 0.96 |
| 22 | Lorestan | 1758226 | 272 | 3 | 64 | 0.89 | 0.91 | 0.93 | 0.97 |
| 23 | Sistan and belochestan | 2733205 | 242 | 2 | 44 | 0.93 | 0.92 | 0.94 | 0.97 |
| 24 | Zanjan | 983369.3 | 226 | 3 | 47 | 0.94 | 0.93 | 0.95 | 0.98 |
| 25 | Semnan | 624482 | 210 | 2 | 67 | 0.95 | 0.95 | 0.96 | 0.99 |
| 26 | Charmehal | 892909.3 | 203 | 2 | 51 | 0.96 | 0.97 | 0.97 | 0.99 |
| 27 | South khorasan | 676794.1 | 150 | 1 | 32 | 0.97 | 0.98 | 0.98 | 1.00 |
| 28 | North khorasan | 838780.8 | 148 | 0 | 33 | 0.98 | 0.98 | 0.99 | 1.00 |
| 29 | Kohkiloiyeh and boyrahmad | 669139.6 | 93 | 1 | 23 | 0.99 | 0.99 | 1.00 | 1.00 |
| 30 | Ilam | 566332.4 | 85 | 0 | 36 | 1.00 | 1.00 | 1.00 | 1.00 |
| total | 74733230 | 18545 | 335 | 3722 | - | - | - | - |
N Neph: Number of Nephrologists PCP: Population cumulative percentage, BCP: Bed cumulative percentage, PACP: Patient cumulative percentage, NCP: nephrologists’ cumulative percentage
Table 2:
Distribution of health care resources and hemodialysis patients along with their dependent Indices
| Resources | index | Value |
|---|---|---|
| hemodialysis Bed in population level | Gini coefficient | 0.03 |
| Nephrologists in population level | Gini coefficient | 0.38 |
| hemodialysis beds with regard to need | Concentration index | -0.02 |
| Nephrologists with regard to need | Concentration index | -0.31 |
| hemodialysis beds with regard to need | Robin Hood index | 0.24 |
| Nephrologists with regard to need | Robin Hood index | 0.02 |
| Hemodialysis Patients in population level | Gini | 0.06 |
Findings related to the distribution of hemodialysis beds:
Total number of hemodialysis beds was 3722. Tehran had the highest number of hemodialysis beds with 666(17.9%) and Kohkiloyeh and Boyerahmad Province had the minimum number with 23(0.6%) beds. Figure 1 and Table 1 show that distribution of beds in population level is nearly proportionate. Gini coefficient was 0.03. There were 5 beds per 100000 populations and that this proportion in Semnan with 10.8 beds was the highest while Sistan and Belochestan with 1.6 had the lowest ratio (Table 1). We also traced the beds distribution with regard to the number of patients; in fact, we were going to calculate the status of hemodialysis beds distribution based on need indicator. In accordance with this aim, therefore, we calculated concentration index. It was -0.02. Table 1 show that 50% of population has access to 52% of beds, while the same percentage of population has 55% of patients.
Fig. 1:
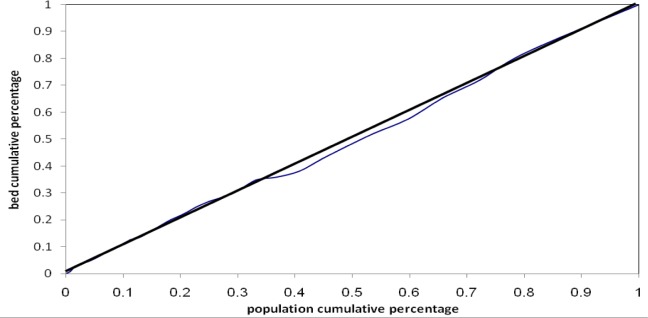
Lorenz curve of hemodialysis beds distribution in population level
That is, in both scenarios, beds distribution is, to a large extent, equivalent and equitable. On average, there were 5 patients per bed. Qazvin had the maximum proportion of patient to bed with 5.7 patients per bed and Ilam had the minimum proportion with 4.2. It shows that the provinces which have the highest number of patients have proportionately higher beds. This proportion also signifies that, the gap between Tehran and Elam provinces in terms of difference in bed distribution with regard to need is just 1.5 hemodialysis patients.
Findings related to the nephrologists distribution
Total number of nephrologists was 335. Tehran had the highest number of nephrologists with 151 and Elam and north Khorasan did not have any nephrologists. Nearly 45% of nephrologists were busy working in Tehran. The Number of nephrologists per 100000 populations was 0.45. Moreover, the proportion of dialysis patient to nephrologists was 55. Figure 2 and 3 show Lorenz and concentration curves for cumulative distribution of nephrologists firstly, in relation to the population level and secondly, with regard to patients (i.e. based on need). Gini coefficient and concentration index for figure 2 and 3 is 0.38 and -0.31 respectively.
Fig. 2:
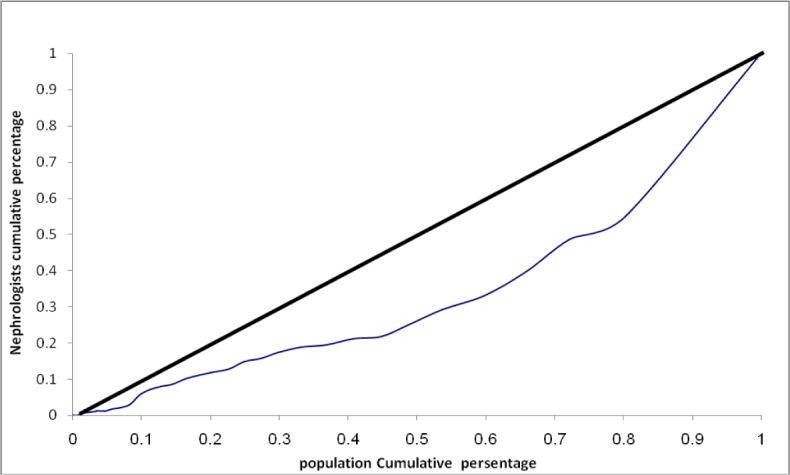
Lorenz curve of nephrologists’ distribution in population level
Table 1 shows that 25% population including 22% patients, have accounted for 45% of nephrologists and 50% population compromising 52% of patients, have access to 71% of nephrologists, indicating significant inequality and inequity in distribution of nephrologists among population deciles. Calculation of Robin Hood index (25%) as such confirms that the distribution of nephrologists is accompanied with great much of inequity (Table 3).
Table 3:
Access and need (%) to nephrologists among the population deciles for calculation of Robin Hood index
| Deciles | Access (%) | Need (%) | Difference (%) |
|---|---|---|---|
| 1 | 21 | 10 | +11 |
| 2 | 24 | 11 | +13 |
| 3 | 6 | 10 | -4 |
| 4 | 8 | 9 | -1 |
| 5 | 11 | 10 | +1 |
| 6 | 5 | 10 | -5 |
| 7 | 6 | 11 | -5 |
| 8 | 7 | 10 | -3 |
| 9 | 7 | 10 | -3 |
| 10 | 5 | 9 | -4 |
Robin Hood index=11+13+1=25 %(0.25)
Discussion
In Iran, several studies have tried to deal with the distribution of health care resources. The results of conducted study by Mobaraki et al. (28) showed that distribution of employed licenses among the medical sciences universities between 2005 to 2009 has been equitable and only small part of them should be redistributed till absolute equity to be attained. Shahabi et al. concluded that the distribution of specialists with regard to hospital beds during 2001-2006 has been proportionate (29). However, none of these studies had considered need index as base of equitable distribution. In other words, these studies have only taken into account the distribution of health care resources in population level (8, 9). More specifically, paying attention to the population needs which is usually perceived through the number of patients or prevalence of disease and other relevant indicators and also dealing with the distribution in population level at the same time has not ever been investigated.
Access to NICU beds in Iran was not consistent with the population needs. It seems that this is among the few studies which have paid attention to the equity in access with considering need rather than the number of population (7).
In present study, we first investigated the status of hemodialysis beds distribution and nephrologists in population level using Lorenz curve and Gini coefficient, that is, without considering the population needs. The results showed that Gini coefficient for hemodialysis beds distribution in population level was 0.03, it indicates that the distribution of hemodialysis beds among the population percentiles is to a large extent equivalent. This equality in distribution of ICU, post ICU and NICU beds has been confirmed by Amerion et al. as well (8). However, in other study, they illustrated that the distribution of kidney transplant beds in Iran lacked equality (9). The results of study carried out in china showed that the distribution of hospitals beds with considering Gini coefficient as determining measure was equitable (30).
But unlike hemodialysis beds, nephrologists distribution as one of the precious human resources related to kidney failures lacked the equality seen in the distribution of hemodialysis beds. We proved this claim by both calculation of Gini coefficient of 0.38 and Robin Hood index as 0.25. Our results correspond with the result of conducted study in Albania which states the distribution of general practitioners had moderate inequality. However, the trend was declining (31). In contrast, the assessment of physicians distribution using Gini coefficient in U.S.A between 1970-1998 revealed that the trend of inequality was increasing (32).
But what here is noteworthy is that judgment regarding the equitable-oriented distribution of health care resources without considering population needs is unvalued. To end this, we secondly followed the distribution of resources according to the population needs. That is, the number of hemodialysis patients. In this phase, we placed the distribution of both above mentioned resources (i.e. hemodialysis beds and nephrologists) against hemodialysis patients’ distribution. As figure 3 shows, the distribution of beds and nephrologists dose not exactly lie on hemodialysis patients’ distribution.
We assumed that if concentration curves for beds and nephrologists distribution placed on concentrations curve for patients’ distribution, we could have concluded that these complementary resources have been equitably distributed. But both calculation of concentration indices and Robin Hood indicated that some sort of inequity exists in distribution of hemodialysis beds and especially nephrologists. However, the scale of this inequity in nephrologists’ distribution among the provinces was by far greater than hemodialysis beds one. Concentration index for beds and nephrologists was respectively -0.02 and -0.32. These coefficients imply that nephrologists distribution is 16-fold more inequitable than beds one. We named this inconformity between resources distribution and hemodialysis patients’ distribution” equity gap”.
Of consequences such inappropriateness in distribution is poor access to required services. Results showed that the distribution of nephrologists was not consistent with the hemodialysis patients. This obstruction in access can result in poor referrals and diagnosis. As studies have pointed out, the prevalence rate of hemodialysis in Iran is 12% while, prevalence of (CKD) is 20 times more (19). So this claim is not too far from the reality that if the policies targeting resources allocation in health system are not manipulated, the pressures on health system and society will be intensified.
Thus, According to the high cost of hemodialysis (19, 20, 33) and severe budget restrictions which health systems are faced with, it necessitates, in order to manage and control the increasing trend of ESRD patients, equity –oriented approaches in resources allocation to be put into top priority.
Generally speaking, findings revealed that firstly, the number of hemodialysis patients has been under the consideration of health ministry in process of efficiently hemodialysis beds allocation. However, such criterion seemingly has not been used in nephrologists’ distribution. Secondly, prevalence of hemodialysis among the provinces varied. As Bushehr and Sistan-Belochestan provinces had the highest and lowest rate respectively. High prevalence of diabetes mellitus as a major risk factor (34) in Bushehr and also its low prevalence in Sistan and Belochestan can be likely connected with such variation in prevalence rate (35).
To sum up, it should be said that, on one side, the doctors’ authority in choosing their workplaces along with more facilities in big cities and, on the other side, the lack of strong determination among the officials in health ministry regarding the need-oriented distribution, have led to these inequities in developing countries and finally, the results indicated that, the root of many difficulties comes back to inappropriate distribution rather than shortage of resources. Therefore tracking equity-oriented approach in resources distribution can both overcome the challenges of access and lead to efficiency in resource allocation. Lack of access to detailed data across the provinces was our limitation which did not allow us to track the scale of inequity inside the provinces which is suggested to be pursued in next researches.
Health policy implications
Using population level indicators as a basis for measuring the state of health resource distribution may be effective especially when the burden of disease has been equally distributed in population level or at least in lack of any relying indicator. But in the presence of need – oriented indicators like the number of patients in every geographical district, resources distribution based on population level is no longer logical. In the present study we used the number of patients as a need indicator to capture the better understanding of population need. Attained results emphasize that the root of some troubles can be attributed to the disproportionately distributed resources.
The more sensible indicators are than population needs, the more equitable distribution will be.
Conclusion
Attaining to high level of efficiency and effectiveness in resource allocation process is accessible if firstly, distribution of resources is consistent with population needs and secondly in cases that maximum effectiveness is relevant to more than one resource, complementary roles of resources should be considered.
Ethical considerations
Ethical issues (Including plagiarism, Informed Consent, misconduct, data fabrication and/or falsification, double publication and/or submission, redundancy, etc.) have been completely observed by the authors.
Acknowledgments
We would like to thank Department of Special Diseases, Ministry of Health and Medical Education of Iran, for its kind cooperation in providing data. The authors declare that there is no conflict of interest. This research has not been funded by any source.
References
- Berndt DJ, Fisher JW, Rajendrababu RV, Studnicki J (2003). Measuring healthcare ineq-uities using the Gini index. System Sciences, Proceedings of the 36th Annual Hawaii International Conference on, IEEE; p. 10. [Google Scholar]
- Nishiura H, Barua S, Lawpoolsri S, Kittitrakul C, Leman MM, et al. (2004). Health inequalities in Thailand: geographic distribution of medical supplies in the provinces. Southeast Asian J Trop Med Public Health, 35(3):735–740. [PubMed] [Google Scholar]
- Beauchamp TL, Childress JF (2001). Principles of biomedical ethics: Oxford University Press, USA. [Google Scholar]
- Rawls J (1985). Justice as fairness: political not metaphysical. Philosophy & Public Affairs, 14(3):223–251. [Google Scholar]
- Daniels N, Kennedy BP, Kawachi I (1999). Why justice is good for our health: the social determinants of health inequalities. Daedalus, 128(4):215–251. [PubMed] [Google Scholar]
- Feinberg J (1995). Justice. In: Encyclopedia of Bioethics. Ed, Reich WT. New York: Macmillan, pp. 802–810. [Google Scholar]
- Rashidian A, Yousefi nouraei R, Azemikhah A, Heydarzadeh M, Changizi N, et al. (2008). perinatal careregionalization and geogeraphical distribution model in the islamic republic of iran. Hakim, 11(2):1–1. [Google Scholar]
- Ameryoun A, Meskarpour-Amiri M, Dezfuli-Nejad ML, Khoddami-Vishteh H, Tofighi S (2011). The Assessment of Inequality on Geographical Distribution of Non-Cardiac Intensive Care Beds in Iran. Iranian J Publ Health, 40(2). [PMC free article] [PubMed] [Google Scholar]
- Ameryoun A, Mesgarpour- Amiri M, Amini AH (2010). Rate of inequality in kidney transplantation services access in Iran. Iranian Journal of Critical Care Nursing (IJCCN). [Google Scholar]
- Matsumoto M, Inoue K, Bowman R, Kajii E (2010). Self-employment, specialty choice, and geographical distribution of physicians in Japan: A comparison with the United States. Health Policy, 96(3):239–244. [DOI] [PubMed] [Google Scholar]
- Munga MA, Mæstad O (2009). Measuring inequalities in the distribution of health workers: the case of Tanzania. Hum Resour Health, 7(1):4. [DOI] [PMC free article] [PubMed] [Google Scholar]
- Kennedy BP, Kawachi I, Prothrow-Stith D (1996). Income distribution and mortality: cross sectional ecological study of the Robin Hood index in the United States. BMJ, 312(7037):1004–1007. [DOI] [PMC free article] [PubMed] [Google Scholar]
- Thornicroft G, Tansella M (2002). Balancing community-based and hospital-based mental health care. World Psychiatry, 1(2):84. [PMC free article] [PubMed] [Google Scholar]
- Graves N, Halton K, Lairson D (2007). Economics and preventing hospital‐acquired infection: broadening the perspective. Economics, 28(2):178–184. [DOI] [PubMed] [Google Scholar]
- Calman K (1994). The ethics of allocation of scarce health care resources: a view from the centre. J Med Ethics, 20(2):71–74. [DOI] [PMC free article] [PubMed] [Google Scholar]
- Asada Y (2005). Assessment of the health of Americans: the average health-related quality of life and its inequality across individuals and groups. Popul Health Metr, 3(1):7. [DOI] [PMC free article] [PubMed] [Google Scholar]
- Lai D, Huang J, Risser JM, Kapadia AS (2008). Statistical properties of generalized Gini coefficient with application to health inequality measurement. Soc Indic Res, 87(2):249–258. [Google Scholar]
- Health Metrics Network (2008). Framework and Standards for Country Health Information Systems. Geneva, World Health Organization, (Available at: http://www.healthmetricsnetwork.org) [Google Scholar]
- Mahdavi-Mazdeh M, Zamyadi M, Nafar M (2008). Assessment of management and treatment responses in hemodialysis patients from Tehran province, Iran. Nephrol Dial Transplant, 23(1):288–293. [DOI] [PubMed] [Google Scholar]
- Khan S, Amedia CA (2008). Economic burden of chronic kidney disease. J Eval Clin Pract, 14(3):422–434. [DOI] [PubMed] [Google Scholar]
- Richard JB, Aldigier JC, Le Mignot L, Glaudet F, Said B, et al. (2008). Equity of accessibility to dialysis facilities. Studies in Health Technology and Informatics; 150: 777–781. [PubMed] [Google Scholar]
- Theodorakis P, Mantzavinis G (2005). Inequalities in the distribution of rural primary care physicians in two remote neighboring prefectures of Greece and Albania. Rural Remote Health, 5(3): 457. [PubMed] [Google Scholar]
- Thomas V, Wang Y, Fan X (2001). Measuring education inequality: Gini coefficients of education: World Bank-free PDF. [Google Scholar]
- McIntyre D, Mooney G (2007). The economics of health equity: Cambridge University Press. [Google Scholar]
- Brown RL, Prus SG (2006). Income inequality over the later-life course: A comparative analysis of seven OECD countries. Annals of Actuarial Science, 1(2):307–317. [Google Scholar]
- Brown MC (1994). Using Gini-style indices to evaluate the spatial patterns of health practitioners: theoretical considerations and an application based on Alberta data. Soc Sci Med, 38(9):1243–1256. [DOI] [PubMed] [Google Scholar]
- O’Donnell O, Van Doorsslaer E, Wagstaff A, Lindelow M (2008). Analyzing health equity using household survey data: a guide to techniques and their implementation: World Bank Publications. [Google Scholar]
- Mobaraki H, Hassani A, Kashkalani T, Khalilnejad T, Ehsani Chimeh E (2013). Equality in Distribution of Human Resources: the Case of Iran’s Ministry of Health and Medical Education. Iranian J Publ Health, 42(Supple 1): 161–165. [PMC free article] [PubMed] [Google Scholar]
- Shahabi M, Tofighi SH, Maleki MR (2010). The Nurse and Specialist Physicians Manpower Distribution by Population and Its Relationship with The Number of Beds at Public Hospitals in Iran’s 2001–2006. Journal of Health Management, 13(41):7–14. [Google Scholar]
- Xu J, Wu N, Jin S, Wang F, Wang Y, et al. (2010). Analysis of inpatient bed allocation equity and utilization in the city community health service center of China. J Huazhong Univ Sci Technolog Med Sci, 30(2):141–144. [DOI] [PubMed] [Google Scholar]
- Theodorakis PN, Mantzavinis GD, Rrumbullaku L, Lionis C, Trell E (2006). Measuring health inequalities in Albania: a focus on the distribution of general practitioners. Hum Resour Health, 4: 5. [DOI] [PMC free article] [PubMed] [Google Scholar]
- Horev T, Pesis-Katz I, Mukamel DB (2004). Trends in geographic disparities in allocation of health care resources in the US. Health Policy, 68(2):223–232. [DOI] [PubMed] [Google Scholar]
- Ranasinghe P, Perera Y S, makarim M FM, Wijesinghe A, Wanigasuriya K (2011). The cost in provision of hemodialysis in a developing country: A multi-centered study. BMC Nephrol, 12: 42. [DOI] [PMC free article] [PubMed] [Google Scholar]
- Aghighi M, Heidary Rouchi A, Zamyadi M, Mahdavi-Mazdeh M, Nourozi SH, et al. (2008). Dialysis in iran. Iran J Kidney Dis, 2(1):11–15 [PubMed] [Google Scholar]
- Ministry of Health and Medical Education (2009). Iran’s Health Outlook Indicators Report. (Available at: behdasht.gov.ir/uploads/291_1041_simayei-salamat.pdf), [In Persian].