Abstract
Background:
In many countries, including our own, cardiovascular disease is the most common cause of mortality and morbidity. Myocardial infarction (heart attack) is of particular importance in heart disease as well as time and type of reaction to acute myocardial infarction and these can be a determining factor in patients’ outcome.
Methods:
In order to reduce physician attendance time and keep patients informed about their condition, the smart phone as a common communication device has been used to process data and determine patients’ ECG signals. For ECG signal analysis, we used time domain methods for extracting the ST-segment as the most important feature of the signal to detect myocardial infarction and the thresholding methods and linear classifiers by LabVIEW Mobile Module were used to determine signal risk.
Results:
The sensitivity and specificity as criteria to evaluate the algorithm were 98% and 93.3% respectively in real time.
Conclusions:
This algorithm, because of the low computational load and high speed, makes it possible to run in a smart phone. Using Bluetooth to send the data from a portable monitoring system to a smart phone facilitates the real time applications. By using this program on the patient’s mobile, timely detection of infarction so to inform patients is possible and mobile services such as SMS and calling for a physician’s consultation can be done.
Keywords: ECG, R-Detection, Myocardial Infarction, ST elevation
1. INTRODUCTION
Cardiovascular disease is the most common cause of mortality, morbidity and health costs in our own country Iran and in many other countries. Moreover, according to published reports, with the increase of coronary artery disease, this disease is considered to be the first cause of mortality in developing countries (1). Myocardial infarction (MI) or its serious form acute myocardial infarction (AMI) is the medical term for a heart attack. Early mortality (within 30 days) associated with a heart attack is 30%, and despite improvements in emergency medical services, more than 50% occur before reaching the hospital (2). The initial reaction time for people suffering from AMI is important and can be a determining role in their fate. Evidence shows that the rate of illness and death decreased in patients who experienced AMI and received standard treatment in the first two hours (1). Fortunately, in recent years the treatment of coronary perfusion has developed and so it can reduce damages caused by AMI.
By decreasing the interval between the onset of symptoms and administration time of drugs, better results can be achieved (3). An Australian study shows that if treatment is started up to one hour of onset of symptoms, the mortality rate decreases 45%, and if treatment is started after three hours of symptom onset, the mortality decreases 23% (4). Another study in the U.S. shows that only 5% of patients received reperfusion therapy within the first hour after the onset of symptoms, and most delayed coming to the emergency department (3).
The classic symptoms of a heart attack include chest discomfort or pain felt in the chest that lasts a few minutes, dizziness, fainting, nausea, sweating, and shortness of breath. The pain may spread to the shoulders, neck and arms. Most people have not experienced heart problems, so they usually do not think that it is the start of a heart disease (1). In response to these symptoms, patients may deny symptoms, consult with relatives, and wait for symptoms to hopefully resolve spontaneously and so go untreated due to lack of knowledge of the nature of symptoms and their importance (4, 5, 3). So, to avoid damages caused by delay, we should seek a way to raise awareness of heart attack victims about their situation.
Today the mobile phone has become an integral part of human life, so it can be used as an acceptable means to diagnose patients and thus encourage more patient cooperation. In our project we have attempted to take a step toward early diagnosis of heart attack by sending the heart signal recorded by a portable ECG device to the patient’s smart phone to be processed in real time. If the condition was found to be abnormal, the data was sent to the patient’s physician, so that the doctor could quickly communicate with his/her patient by mobile services if necessary (1). A view of the system can be seen in Figure 1.
Figure 1.

Mobile-ECG system
ECG Signals include P, QRS and T waves. Various changes in the ECG signal, depending on the place and the development and progression of the disease have been reported.
ST segment changes are common symptoms of infarction. According to ST segment changes, we can divide MI into two categories: ST-elevated myocardial infarction (STEMI) and non ST-elevated myocardial infarction (non STEMI) (6). In STEMI, the ST-segment elevation is the earliest sign of MI (7). Thus, we should follow the ST segment to detect myocardial infarction. Figure 2 shows a normal and ST-elevated ECG signal
Figure 2.
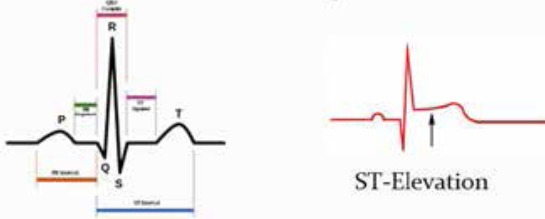
Normal and ST-elevated ECG signal
2. METHODS
In this project, we intended to process data of heart attack patients and increase their survival rates by timely diagnosis. Hence, we designed software to communicate with a mobile ECG by sending the recorded signal to a mobile phone via Bluetooth. The block diagram of the algorithm can be seen in Figure 3.
Figure 3.

Block diagram of the algorithm
2.1. The database
The first phase of the work was to provide data that was recorded from a patient for whom MI had been reported. In this regard, data from the European ST-T database PhysioNet was used (8).
This data included e0108, e0123, e0124, e0126. Each record is two hours in duration and contains two signals, each sampled at 250 samples per second with a 12-bit resolution over a nominal 20 mV input range. In addition, we used MIT-BIH arrhythmia data as normal data to better assess the algorithm.
2.2. Data transmission system design:
In this project, it is assumed that the data was sent from a portable data acquisition system to the smart phone (Figure 4). So a program must be provided in order to replace the data acquisition system. Therefore, the offline data analyzed in the previous section must be converted to real time so conditions associated with a portable data acquisition system can be provided.
Figure 4.
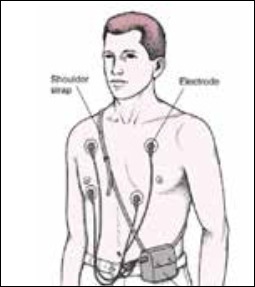
A portable data acquisition system
We used LabVIEW 8.6 software for designing the program because it is a powerful tool for image processing applications, digital signal processing (DSP), data analysis, control equipment, networking programs, and many other engineering applications. This version has 25 toolkits including a mobile module. The mobile module provides an advanced graphical environment from LabVIEW for devices that have Windows mobile for Pocket PC devices. This module provides applications such as remote control systems, monitoring and portable data acquisition systems. To operate the mobile module we needed a computer with Windows Vista/XP or Windows 2000 and a mobile with Windows Mobile 5.0, 6.0 or Pocket PC 2003. The data can be sent to the phone via USB or Bluetooth. For designing the data transmission system, first the data was converted to real time by using a five second moving window that was shifted one second in a repeated loop. Then the data was sent in a 1-byte buffer via Bluetooth.
Bluetooth Technology, because of having features such as being wireless, low-powered, low-cost and capable of 1 Mbps data transmission rates in the range of at least 10 m, makes it highly desirable for our application. In addition, we used Samsung Omnia i900 with Windows mobile 6.1 in order to provide LabVIEW Mobile Module conditions. Finally, the data received by the mobile phone via Bluetooth was entered into the processing stage.
2.3. R-Detection
Since we wanted to detect the ST segment, first we had to detect the R-peak as a reference. There are several methods for detecting the R-peak, in this project, according to the reference (9), we used the Hilbert transform to detect the R-peak. In this reference, the Hilbert transform has been suggested in order to detect the R-peak in a Holter monitor because of short implementation time and lack of computational complexity. The results show that the error is less than 0.005 at R-peak detection. In mathematics and signal processing, the Hilbert transform of a real time function x (t) is defined as when the integral exists:

In equation 1 the independent variable has not changed as result of this transformation, so the output xˆ(t) is also a time dependent function. It is normally not possible to calculate the Hilbert transform as an ordinary improper integral because of the possible singularity at τ = t. The integral should be considered as a Cauchy principal value. In mathematics, the certain Cauchy principal value is defined as:

Where b is a point at which the behavior of the function x(t) is such that


So when the Hilbert transform exists, it is written as presented in equation 1. Other forms for H(x(t)) can be obtained by change of variable, that is


A Hilbert transform of a square wave is shown below (Figure 5):
Figure 5.
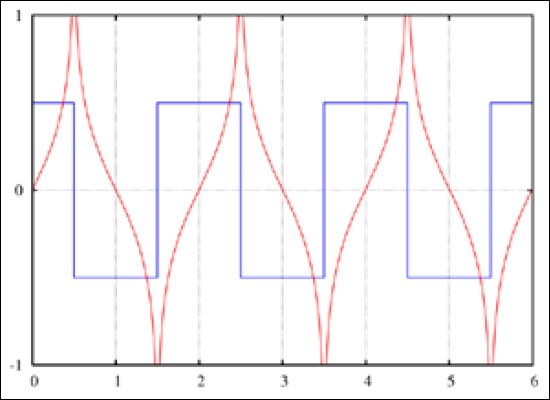
A Hilbert transform of a square wave
Figure 6 shows the simulation of the R-peak detection algorithm in LabVIEW:
Figure 6.
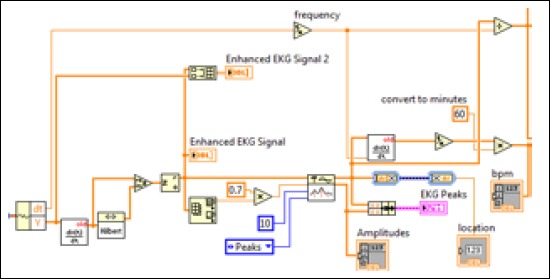
R-Peak detection algorithm
2.4. ST-segmentation
Many algorithms have been designed to extract the ST segment, including algorithms based on neural networks, wavelet, rule-based and time domain methods or use of a predetermined location of the ST segment by a cardiologist, are examples of conventional methods.
In (10) X. Li, et al. present ST-T complex automatic analysis using the wavelet transform. Thier work focused on locating the fiducial points S, J (the start of the ST segment), and T. The wavelet transform was used at different scales to detect the different fiducial points. Although the ST fiducial points were identified in this work, the ST segments were not classified as normal or elevated.
In (11) C. Papaloukas, et al. apply a rule-based method to ST segment classification. First, they locate the QRS complex and identify fiducial points based on empirical formulas. Next a rule-based method is applied to classify the ST segments. The rules are based on the value of the ST segment after a predefined time from the R peak and the slope of the segment. The European ST database was used for testing.
In (12) T. Stamkopoulos, et al. detect ischemia using nonlinear PCA neural networks. The ST segment is classified into two groups: normal and abnormal. Abnormal groups are actually comprised of artifacts, ST elevations, and ST depressions. The radial basis function neural network is used and the algorithm is tested using the European ST database. A classification accuracy of 80% for normal beats and 90% for ischemic beats is reported.
F. Badilini, et al. detect ischemia from Holter monitor recordings in (13). Empirical formulas are provided to create a window for locating the ST segment based on heart rate, i.e. the RR interval. Next, the resulting windowed ST segment is classified.
D. Fischell, et al. patented a system for the detection of cardiac events (14). Their system requires that a physician assess the location of the patient’s ST segment with respect to the QRS complex. Based on this fixed location, an algorithm then monitors the ST segment for changes in elevation and if a change in elevation occurs a warning system is triggered.
According to the studies, the wavelet transform and neural networks are powerful tools for data analysis, but only if we consider the system offline. Our algorithm should be real-time and without computational complexity by considering the limitations of the mobile phone such as its low volume. On the other hand, using a predetermined location of the ST segment by a cardiologist should be offline. Through real time data transmission to a cardiologist, he must exclusively devote his time to that patient, which does not seem to be practical.
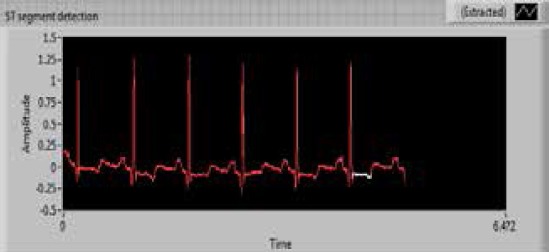
In this project ST segments are identified by location of the R-peak. According to the information obtained from references (15, 16) in 250 Hz sampling frequency, the ST segment appears after the end of the QRS complex in a 120 mS window with 30 sample lengths. This method makes it possible to achieve the ST segment in the application of real time processing.
2.5. Thresholding and determining the risk level of the signal
To detect ST-elevation once again we will review its concept. ST segment is a section between the QRS complex and the T-wave in the heart signal and matches the base line signal. ST segment changes, including no wave, but it is important in the diagnosis process. ST segment elevation is one of the earliest signs of heart attack. According to reliable reports (15, 16) when this piece is higher than 0.1 mV, it is called ST-elevation.
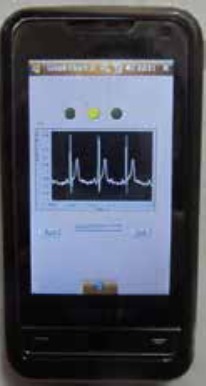
So with the ST segment obtained from the previous step, we examined the threshold method to detect ST elevation. The medical reports show that with the increase of ST elevation, early mortality within 30 days is decreased (17). So determining the amount of ST elevation can help to assess the risk level of the patient’s condition. For lower tolerance of the output response threshold, detection takes place in a 5 second moving window. The output of this stage is divided into three levels depending on the elevation. For values between 0.1 and 0.5 a green light is illuminated, for values between 0.5 and 1 a yellow light, and for higher values of 1 a red light is illuminated so the patient is aware of his condition.
3. RESULTS
In this section, simulation results have been reported concerning the processing units. Peak detection is the first step of the process, as seen in Figure 7, the time and location of each peak was achievable. The next step was to extract ST segments of the signal (Figure 8). The final output visible in the mobile phone is summarized to display the signal and patient’s condition. An example of the output for one of the patients is shown in Figure 9.
Figure 7.

R-peak detection
Figure 8.
ST segmentation
Figure 9.
Display in the smartphone
The sensitivity and specificity as standard criteria to evaluate the algorithm, are shown in Figures 7 and 8:

The sensitivity and specificity were 98% and 93.3% respectively, in real time.
4. DISCUSSION
Initial reaction time plays a major role in maintaining the health of a patient suffering from a heart attack. Hence, our study has been able to reduce the time for receiving standard treatment, the mortality rate in these patients was reduced and damage to infarction has been prevented.
In this paper, the diagnosis of heart attack with ST segment elevation (STEMI), which is the earliest sign, has been discussed. Finally, we achieved proper output by using time domain methods and linear classifiers. The sensitivity and specificity as criteria to evaluate the algorithm were 98% and 93.3% respectively, in real time. This algorithm due to the low computational load and high speed is suitable to use in smart phones. Using Bluetooth for sending data from the data acquisition system to the smart phone facilitates real time application. Using this program in the patient’s smart phone can enable timely detection of infarction so as to inform the patient and by using mobile services such as SMS and calling, quick contact with a doctor is possible. It should be noted that the diagnostic software designed in this project can also assist general practitioners who are working in deprived areas where access to specialized services is difficult and time consuming. General practitioners are able to recognize heart attack symptoms and its severity, and a timely response is necessary to avoid death and other complications related to a heart attack
Footnotes
CONFLICT OF INTERESTS: NONE DECLARED.
REFERENCES
- 1.Noureddine S, Arevian M, Adra M, et al. Response to signs and symptoms of acute coronary syndrome: differences between Lebanese men and women. Am J Crit Care. 2008;17(1):26–35. [PubMed] [Google Scholar]
- 2.Kasper Dennis L, Fauci A, Braunwald E. 16th ed. New York: Mac Grow–Hill; 2005. Harrison’s principles of internal medicine; pp. 1425–1430. [Google Scholar]
- 3.Crumlish CM, Bracken J, Hand MM, et al. When time is muscle. Am J Nurs. 2000;100(1):26–33. [PubMed] [Google Scholar]
- 4.Dracup K, McKinley SM, Moser DK. Australian patients delay in response to heart Attacke Symptoms. Med J Aust. 1997;166(5):233–236. doi: 10.5694/j.1326-5377.1997.tb140101.x. [DOI] [PubMed] [Google Scholar]
- 5.Dianati M, Adib-Hajbaghery M, Taghadosy M, et al. seeking treatment behaviors for acute myocardial infarction symptoms in patients referred to Kashan Shahid Beheshti Hospital 2006-7. Feyz, Kashan University of Medical Sciences & Health Services. 2010;14(2):133–139. [Google Scholar]
- 6.Khan M. 3rd ed. Totowa, NJ: Humana Press Inc; 2008. Rapid ECG Interpretation. [Google Scholar]
- 7.Dubin D. Rapid interpretation of Electrocardiogram. In: Majlesi M, Ravaghi M, translators; 6th ed. Tehran: Golban publication; pp. 266–267. Accessed on www.physionet.com . [Google Scholar]
- 8.Wang X. Saskatoon: Saskatchewan Unive; 2006. Numerical Implementation of the Hilbert transform. [Google Scholar]
- 9.Li X, Wang T, Zhou P, et al. New Jersay: 2003. ST-T complex automatic analysis of the electrocardiogram signal based on wavelet transform, Proceedings of the IEEE 29th Annual Northeast Bioengineering Conference. [Google Scholar]
- 10.Papaloukas C, Fotiadis D, Likas A, et al. A knowledge-based technique for automated detection of ischemic episodes in long duration electrocardiograms. Med Biol Eng Comput. 2001;38:105–112. doi: 10.1007/BF02345273. [DOI] [PubMed] [Google Scholar]
- 11.Stamkopoulos T, Diamantaras K, Maglaveras N, et al. ECG analysis using nonlinear PCA neural networks for ischemia detection, IEEE Trans. on Signal Processing. 1998;46(11):3058–3067. [Google Scholar]
- 12.Badilini F, Merri M, Benhorin J, et al. Beat-to-beat quantification and analysis of ST displacement from Holter ECGs: a new approach to ischemia detection. Proceedings of Computers in Cardiology. 1992;11-14:179–182. [Google Scholar]
- 13.Fischell D, Fischell T, Harwood J, et al. United States Patent, US. 669023B1; 2003. System for the detection of cardiac events. [Google Scholar]
- 14.Bulusu S, Faezipour M, Nourani M, et al. Transient ST-segment episode detection for ECG beat classification, IEEE/NIH Life Science Systems and Applications Workshop (LiSSA) 2011;7-8:121–124. [Google Scholar]
- 15.Oresko J. Johnstown: Pittsburgh Unive; 2007. Portable heart attack warning system by monitoring the ST segment via smartphone electrocardiogram processing. [Google Scholar]
- 16.Wong C, Gao W, Stewart R, et al. Prognostic value of lead V1 ST elevation during Acute Inferior Myocardial Infarction. Circulation. 2010;122:463–469. doi: 10.1161/CIRCULATIONAHA.109.924068. [DOI] [PubMed] [Google Scholar]


