Summary
Pluripotent stem cells provide a powerful system to dissect the underlying molecular dynamics that regulate cell fate changes during mammalian development. Here we report the integrative analysis of genome wide binding data for 38 transcription factors with extensive epigenome and transcriptional data across the differentiation of human embryonic stem cells to the three germ layers. We describe core regulatory dynamics and show the lineage specific behavior of selected factors. In addition to the orchestrated remodeling of the chromatin landscape, we find that the binding of several transcription factors is strongly associated with specific loss of DNA methylation in one germ layer and in many cases a reciprocal gain in the other layers. Taken together, our work shows context-dependent rewiring of transcription factor binding, downstream signaling effectors, and the epigenome during human embryonic stem cell differentiation.
Human embryonic stem cells (ESCs) hold great promise for tissue engineering and disease modeling, yet a key challenge to deriving mature, functional cell types is understanding the molecular mechanisms that underlie cellular differentiation. There has been much progress in understanding how core regulators such as OCT4 (POU5F1), SOX2, and NANOG as well as transcriptional effector proteins of signaling pathways, such as SMAD1, TCF3, and SMAD2/3, control the molecular circuitry that maintains human ESCs in a pluripotent state1,2. While the genomic binding sites of many of these factors have also been mapped in mouse ESCs, cross species comparison of OCT4 and NANOG targets showed that only 5% of regions are conserved and occupied across species3. Together with more general assessment of divergent transcription factor (TF) binding4, it highlights the importance of obtaining binding data in the respective species.
It is well understood that epigenetic modifications, such as DNA methylation (DNAme) and posttranslational modifications of the various histone tails, are essential for normal development5,6. TF binding sites are overlapping with regions of dynamic changes in DNAme and likely linked to its targeted regulation7,8. More generally, TFs orchestrate the overall remodeling of the epigenome including the priming of loci that will change expression only at later stages6,9,10. It has also been shown that lineage specific TFs and signaling pathways collaborate with the core regulators of pluripotency to exit the ESC state and activate the transcriptional networks governing cellular specification11,12. However how the handoff between the central regulators occurs and what role individual TFs and signaling cues play in rewiring the epigenome to control proper lineage specification and stabilize commitment is still underexplored.
TF binding maps across human ESC differentiation
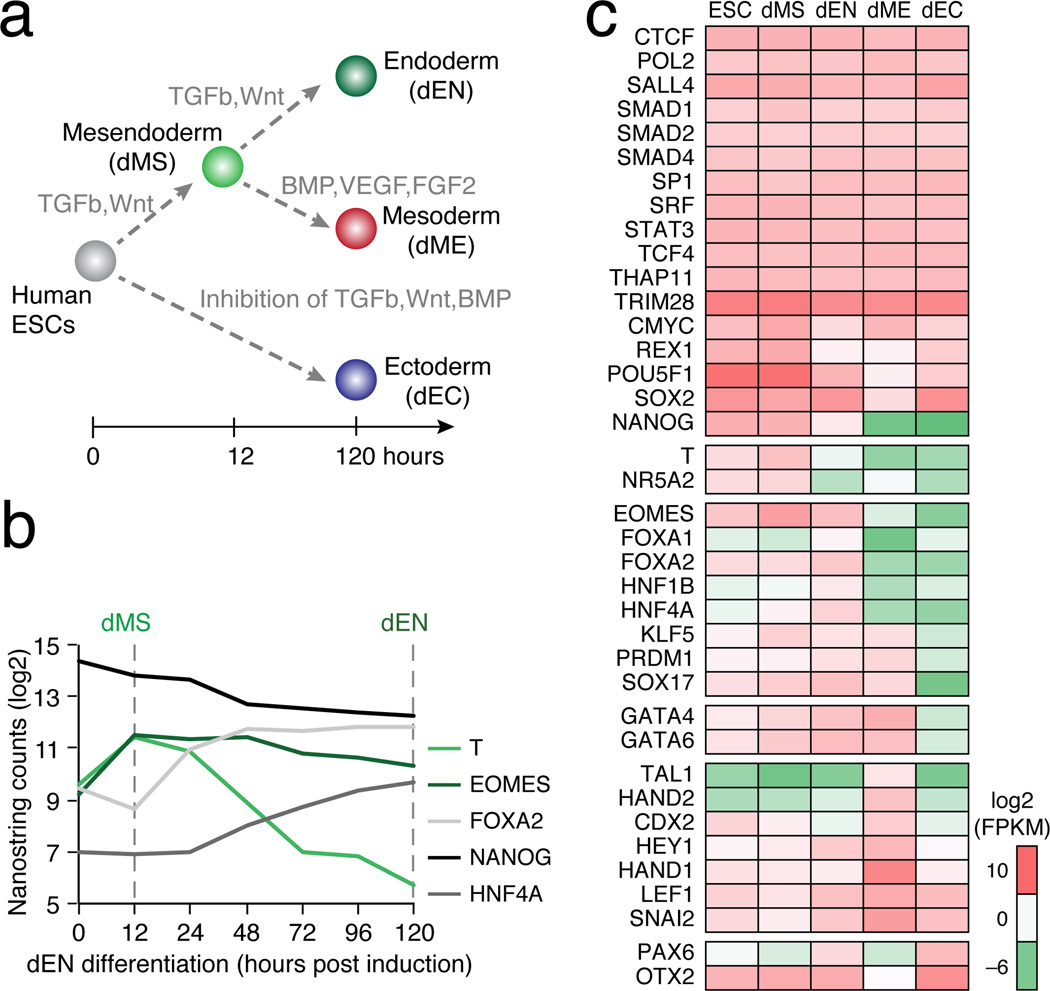
To dissect the dynamic rewiring of TF circuits, we used human ESC to derive early stages of endoderm (dEN), mesoderm (dME) and ectoderm (dEC)13–15 along with a mesendoderm (dMS) intermediate (Fig. 1a, Supplementary Information). We defined and collected the dMS population at 12 hours due to maximal expression of BRACHYURY (T) (Fig. 1b), and carried out chromatin immunoprecipitation sequencing (ChIP-seq) for four of the Roadmap Epigenomics Project16 core histone modifications (H3K4me1, H3K4me3, H3K27Ac and H3K27me) as well as RNA-sequencing (RNA-seq) of polyadenylated transcripts (Supplementary Table 1). As expected we observe up-regulation of key TFs including FOXA2 and HNF4A in dEN, HAND1 and SNAI2 in dME, and OTX2 and PAX6 in dEC (Fig. 1b,c)9,17. We identified high quality antibodies for 38 factors (Fig. 1c) and provide detailed information including their validation and use in other studies in Supplementary Table 2.
Figure 1. TF dynamics during human ESC differentiation.
a. Schematic of the human ESC differentiation system including timeline and key signaling pathways that are modulated.
b. Normalized RNA expression of selected TFs over the differentiation timeline towards endoderm.
c. RNA-seq data of the selected TFs. Factors are ordered by condition where they are most active: ESCs on top, followed by dMS, dEN, dME, and dEC.
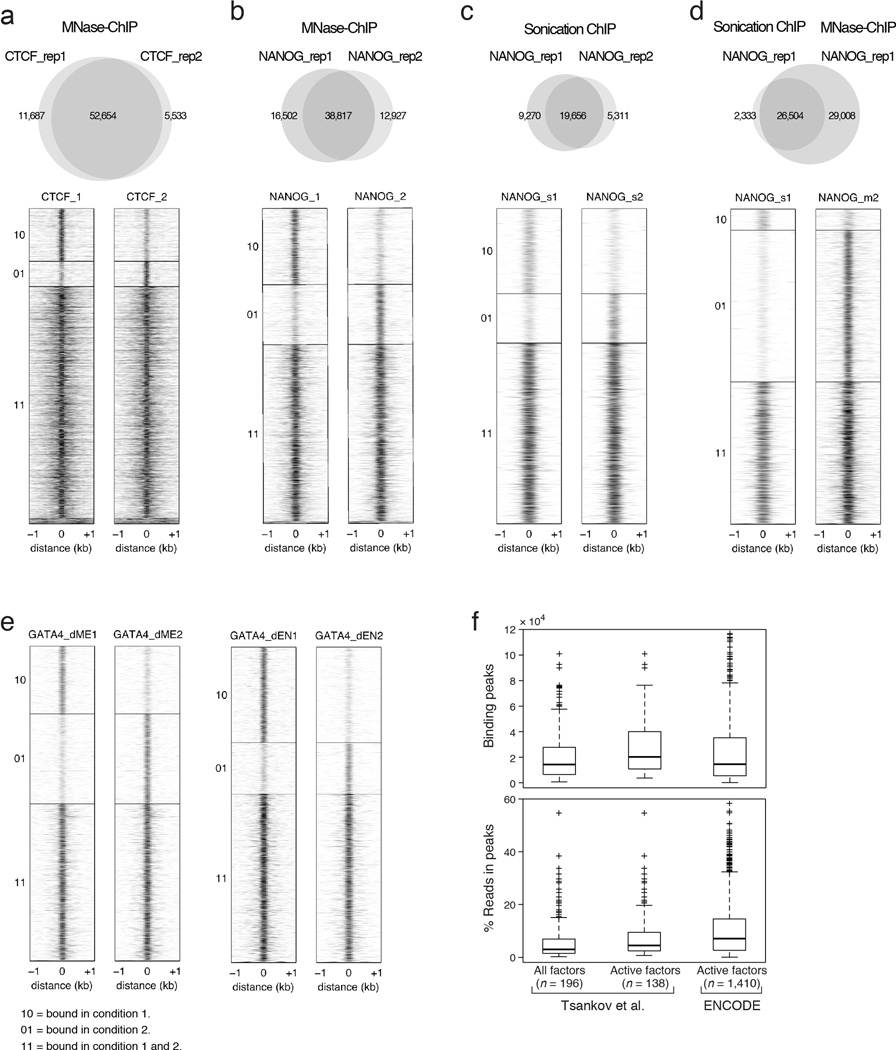
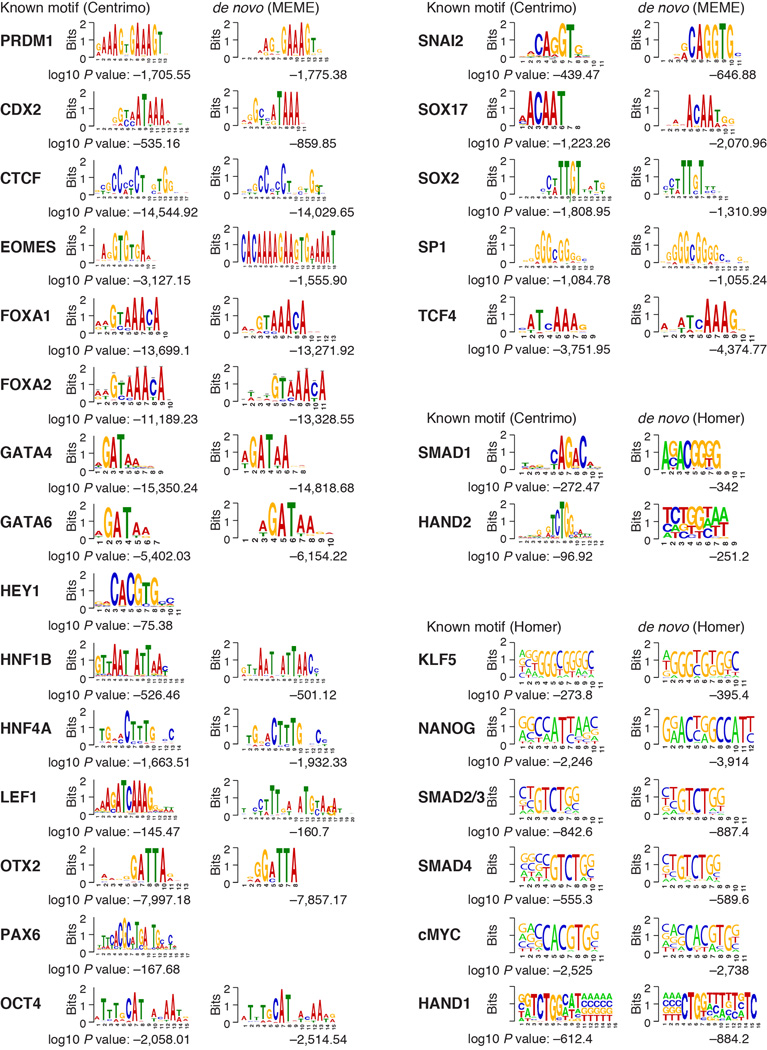
Using a micrococcal nuclease (MNase) based ChIP-seq (MNChIP-seq) protocol18 we obtained binding patterns as well as reproducibility comparable to sonication ChIP-seq with only 1–2 million cells (Extended Data Fig. 1a–e). We quantified the enrichment over background for each experiment (Supplementary Table 3) and show that the level of binding is comparable to TF ChIP-Seq data from ENCODE19 (Extended Data Fig. 1f). To computationally evaluate the specificity of the chosen antibodies we searched our binding maps for previously reported motifs of the respective factors20 (Extended Data Fig. 2). Our final dataset consists of 6.7 billion aligned sequencing reads that yield 4.2 million total binding events (Supplementary Table 3). The binding spectrum of all TFs averages 21,468 peaks and ranges from 578 to 100,778 binding events. Of these 23% are found in promoters, 44% in distal regions, 30% in introns, and 3% in exons.
Classes of TF dynamics
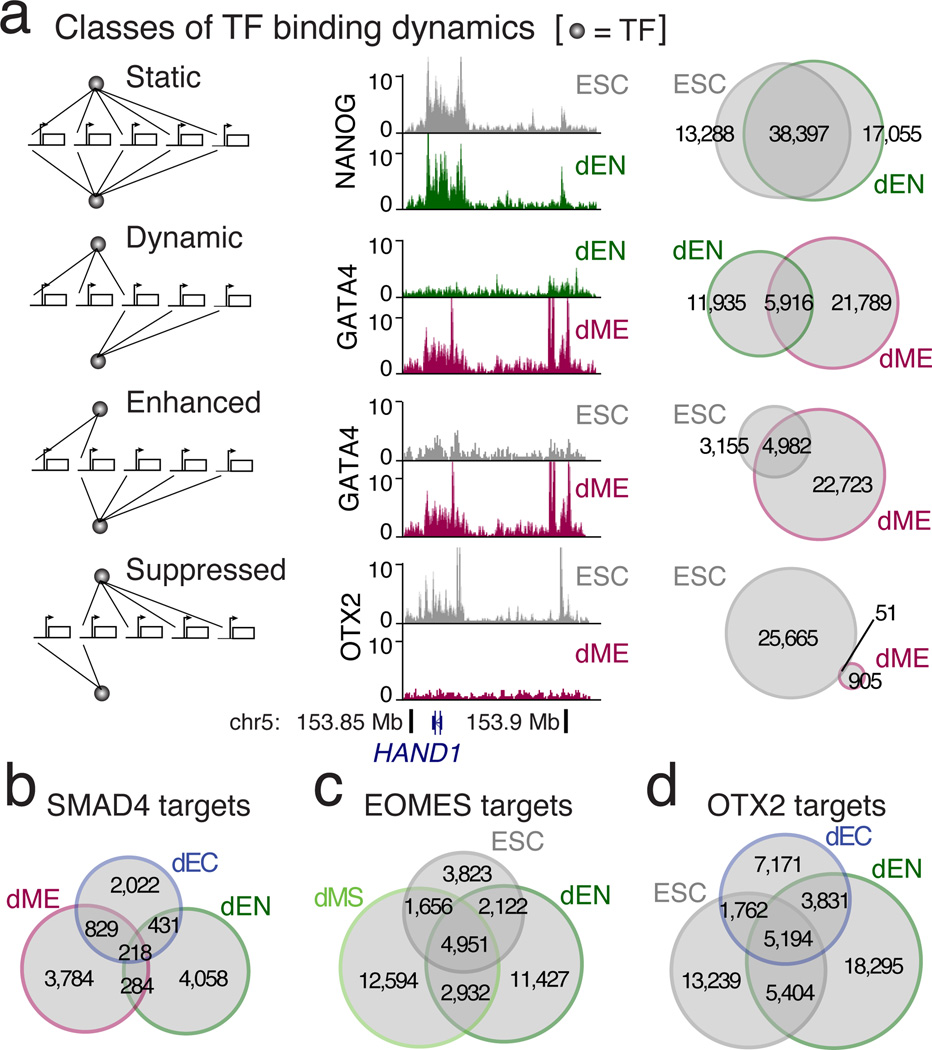
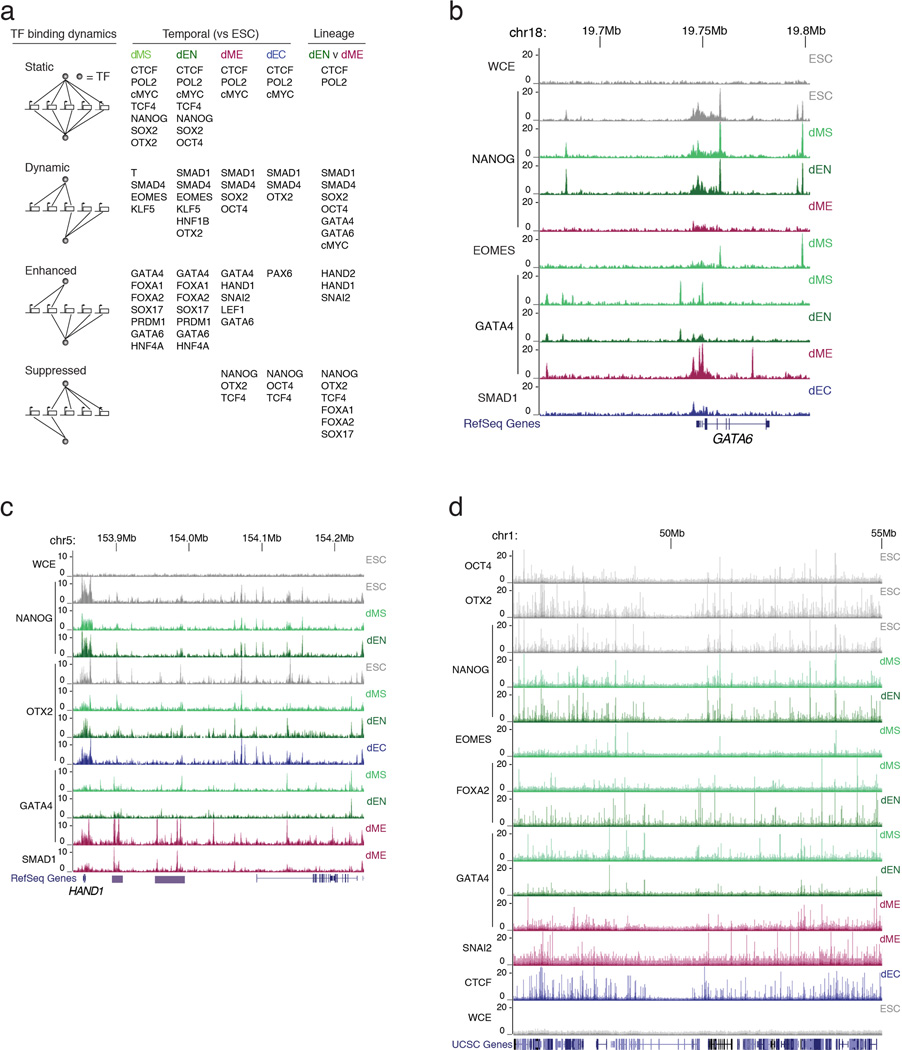
To globally dissect TF binding dynamics, we grouped them into four main classes (static, dynamic, enhanced, and suppressed) similar to prior studies in yeast21 and then further subdivided each of these as either temporal (between successive time-points) or cross-lineage (between germ layers) (Fig. 2a, Extended Data Figs. 3, 4).
Figure 2. Classes of TF binding dynamics in germ layers.
a. Classes of dynamics comparing TF binding between successive timepoints (temporal) or between different germ layers (cross-lineage). The schematics, browser images, and Venn diagrams illustrate examples of each class.
b. SMAD4 predominantly binds to unique regions in the three germ layers.
c. EOMES binding is enhanced from ESCs to dMS and dynamic in dEN.
d. OTX2 binding is dynamic in dEN and dEC when compared to ESCs.
A number of factors, including NANOG, show largely static binding in ESCs and endoderm (Fig. 2a). This could be the result of NANOG’s proposed functions in endoderm including protection against neuroectoderm specification and buffering TGF-β signaling to avoid premature induction of definitive endoderm11. CTCF is both temporally and cross-lineage static in its binding pattern, showing a similar overlap between cell types as between replicates (Extended Data Fig. 1a, 4a). The high similarity in binding is consistent with a previous study that investigated CTCF binding in 19 diverse human cell types22. Although each of the germ layer derivatives exhibits unique expression signatures they show overall only limited transcriptional dynamics9, which is consistent with the largely static enrichment for POLII and cMYC (Extended Data Fig. 3a).
In contrast, a number of the selected factors show dynamic binding between two (e.g. GATA4) or more (e.g. SMAD4) cell types (Fig. 2a,b). EOMES changes its binding profile notably during the dMS to dEN transition, suggesting its function may evolve at different stages of differentiation (Fig. 2c). Also, OTX2 occupies a largely different binding spectrum in the undifferentiated cells compared to dEN and dEC (Fig. 2d). Many factors also exhibit different temporal and cross-lineage dynamics. For example, while NANOG binding is temporally static in dMS and dEN, it is suppressed temporally and cross-lineage in dME (Extended Data Fig. 3a, 4b). Meanwhile, OCT4 and SOX2 binding is temporally static in dEN, but cross-lineage dynamic between dEN and dME (Extended Data Fig. 3a, 4c). Likewise, TCF4 (a transcriptional effector of WNT signaling) is temporally static in dEN but suppressed in dME and dEC, consistent with the lack of WNT signaling in those germ layers13–15 (Extended Data Fig. 3a, 4d). Finally, OTX2 is temporally suppressed in dME (Fig. 2a), but temporally dynamic in the other germ layers (Fig. 2d).
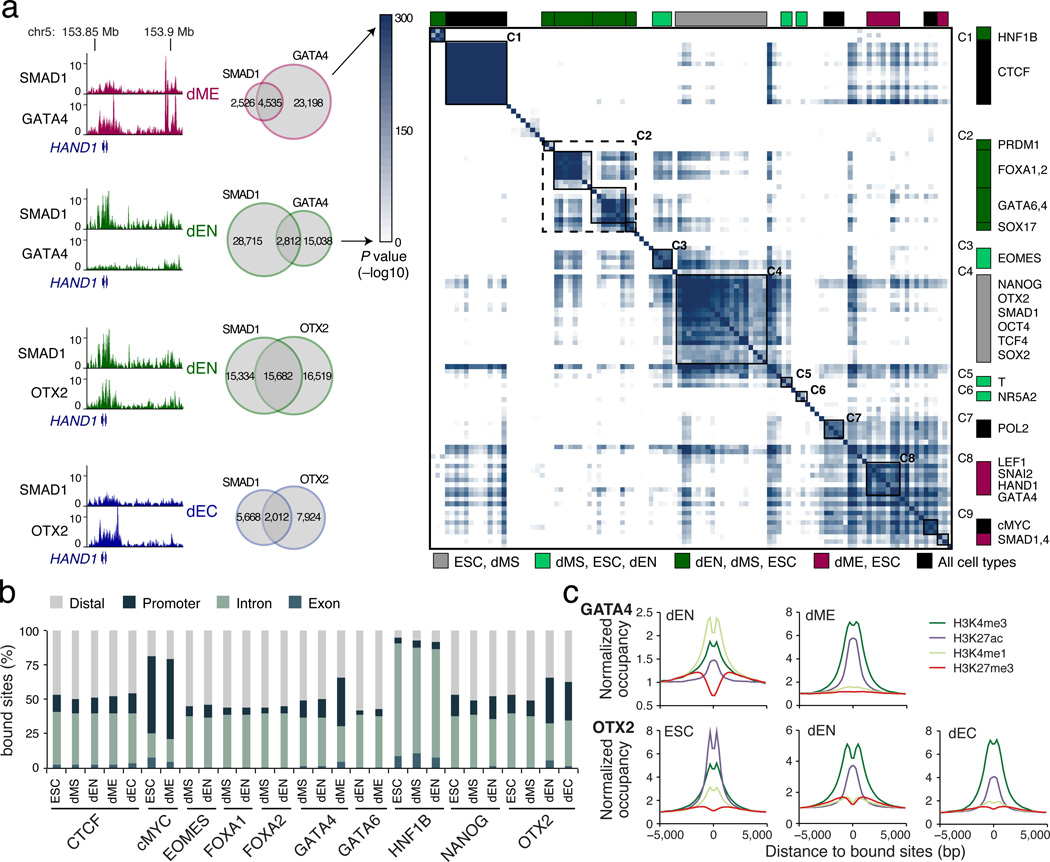
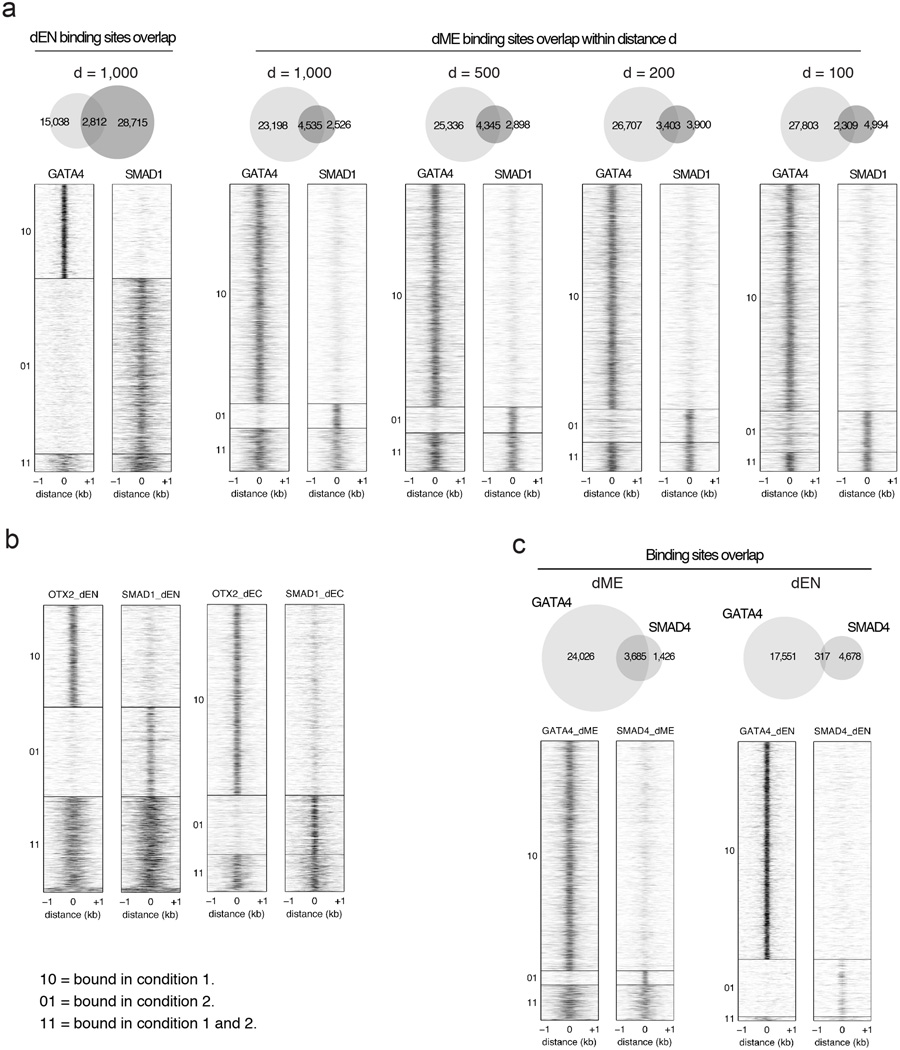
In order to investigate the interplay between TFs across the cell types and how they might collaborate to mediate cellular transitions, we analyzed all pairwise TF co-binding relationships. We identify several germ layer specific co-binding interactions; for example, GATA4 targets associate significantly (hypergeometric P < 10−300) with SMAD1 binding in dME but less so in dEN (Fig. 3a, left; Extended Data Fig. 5). To extend this, we clustered all co-binding relationships and identified groups of interactions between factors and developmental timepoints (Fig. 3a, right). We found both clusters of many regulators in one cell type as well as clusters for individual TFs across cell types. For instance, cluster C1 shows that CTCF binding spectrum is highly similar in all three germ layers. In cluster C2, we find high overlap in binding between key endoderm regulators while C4 captures primarily pluripotent and dMS binding profiles. Many known mesoderm factors aggregate in clusters C8 and flanking the pluripotent cluster C4 are EOMES, T, and NR5A2 clusters (C3, C5, C6), all known regulators in mesendoderm that are likely involved in the transition towards mesoderm and endoderm11.
Figure 3. TF co-binding relationships and genomic targets.
a. Left: Overlap in binding between GATA4 and SMAD1 is greater in dME than in dEN. Similarly, overlap in binding between OTX2 and SMAD1 is greater in dEN than in dEC. Right: Highly significant TF co-binding relationships are assigned a dark blue color, representing −log10 of interaction P value. All TF dynamics and co-binding interactions are clustered and displayed in a matrix, where each row/column represent a single ChIP-seq experiment. The color code indicates the cell type identity for the majority of ChIP-seq profiles making up each cluster.
b. Genomic annotations for factors that bind more than 15,000 regions in multiple conditions.
c. GATA4 (top) and OTX2 (bottom) binding is associated with different chromatin marks between lineages.
Interestingly, we noticed that GATA4 and OTX2 binding in the different cell types is not only divergent, but enriches at distinct genomic features (Fig. 3b). In dME 36% of all GATA4 binding sites occur in promoters, compared to only 13.6% in dEN. OTX2’s fraction of binding sites at promoters is larger in dEN (34%) and dEC (28%) than in ESCs (13%). Accompanying GATA4’s shift in binding preference, we also observe higher levels of H3K4me1 at dEN targets and higher H3K27Ac and H3K4me3 enrichment in dME (Fig. 3c). Similarly, OTX2 associates with higher H3K27Ac and H3K4me1 in ESCs, and higher H3K4me3 occupancy in dEN and dEC, in line with increased promoter binding in these two germ layers (Fig. 3c). It is worth noting that similar to the distinct GATA4/SMAD1 co-binding, OTX2 co-occupies a higher fraction of loci with SMAD1 in dEN than in dEC (Fig. 3a, left; Extended Data Fig. 5). Although TGF-β signaling is primarily associated with effector proteins SMAD2/3, it also acts through the SMAD1/5/8 complex and may encourage interaction with OTX2 in dEN but not in dEC, where TGF-β signaling is specifically inhibited23.
H3K27Ac domains identify lineage regulators
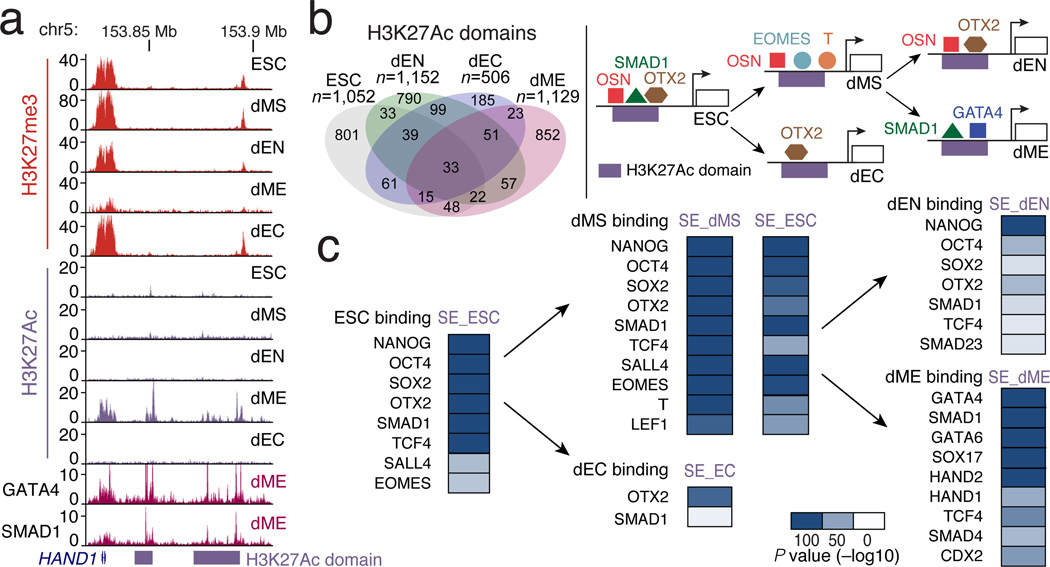
Extended H3K27Ac domains have recently been termed super-enhancers and were used to describe regulatory regions that enrich for binding sites of master TFs in the respective cell types24,25. Interestingly, binding of GATA4 in dME indeed coincides with long stretches of H3K27Ac near several mesodermal genes (Fig. 4a). We therefore used the previously described approach24,25 to rank extended H3K27Ac domains in our populations and identify such super-enhancers (Supplementary Table 4), which were indeed predominantly unique to each cell type (Fig. 4b, Extended Data Fig. 6). As expected, in human ESCs, core regulators OCT4, SOX2, NANOG (abbreviated OSN), and OTX2 binding is highly enriched at super-enhancers1,26 (Fig. 4c).
Figure 4. Extended H3K27Ac domains highlight unique TF transitions.
a. Browser tracks for H3K27me3 and H3K27Ac across all five cell types as well as GATA4/SMAD1 enrichment over the HAND1 locus in dME.
b. Limited overlap of extended H3K27Ac domains between cell types.
c. Top: Schematic of different hand-offs in TF regulation at super-enhancers. Bottom: P values (−log10) displaying the most significant overlaps in H3K27Ac super-enhancers (SE) and TF binding for each cell type.
We used enrichment of binding at super-enhancers for identifying possible master regulators in the germ layers (Fig. 4c); the results were highly robust to different cutoffs for defining the super-enhancers (Supplementary Table 5). Surprisingly, we found that many of the core regulators bound at ESC super-enhancers also occupy dEN super-enhancers, including OSN, OTX2, SMAD1, TCF4, SMAD2/3 (Fig. 4c, Extended Data Fig. 6e). In mesoderm, GATA4 and SMAD1 were the most highly enriched factors at dME super-enhancers (Extended Data Fig. 6f, 7), consistent with GATA4’s known role in directing cardiomyocyte development downstream of BMP signaling27. OTX2 is known to regulate neuronal subtype specification in the midbrain28 and we found strong enrichment for OTX2 binding at ectoderm super-enhancers (Fig. 4c, Extended Data Fig. 6g,h). Meanwhile, dMS super-enhancers were enriched for known regulators such as EOMES and T, along with OSN and OTX2 (Fig. 4c). At a lower significance level we also find enrichment for a number of endoderm factors, including FOXA1/2, GATA4/6 and SOX17 (Supplementary Table 5). Interestingly, binding of EOMES, T and FOXA1/2 in the undifferentiated ESCs was also enriched (hypergeometric P < 10−6) at dMS super-enhancers (Fig. 4c, Extended Data Fig. 6) suggesting that a number of loci might be already marked prior to differentiation.
Regulation of poised enhancers across germ layers
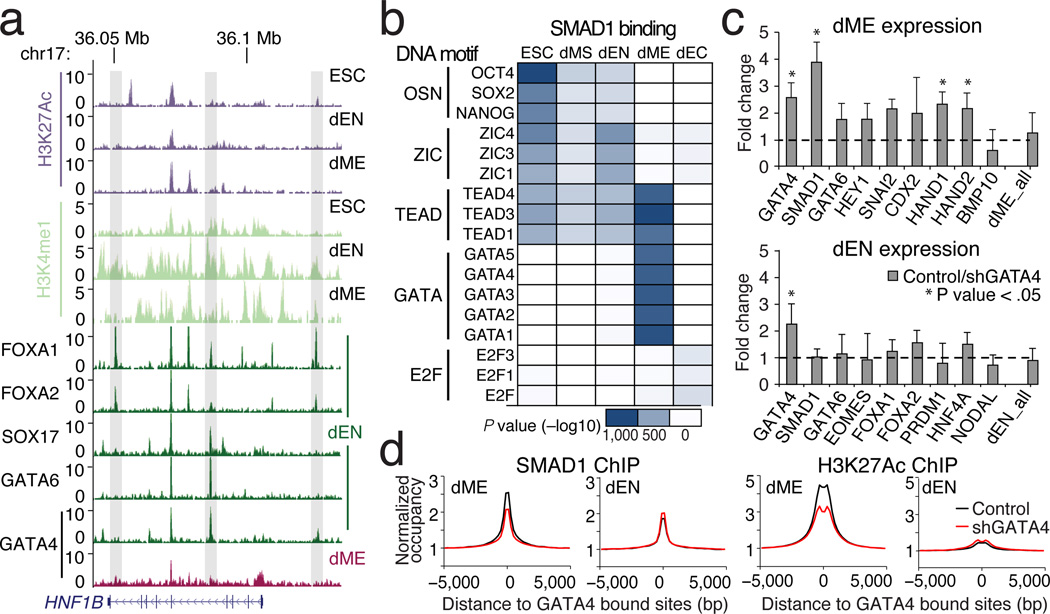
Since dEN H3K27Ac domains were mostly devoid of known endoderm TFs, we asked if such regulators are instead present at regions that enrich for H3K4me1, as seen at the HNF1B locus (Fig. 5a). H3K4me1 can be found at both active and poised enhancers29 and is known to also form extended enhancer domains that may not overlap with the H3K27Ac domains24,25. Using the same approach as above we identified extended H3K4me1 domains in dEN and then measured enrichment for TF binding in these regions. In contrast to H3K27Ac, the top H3K4me1 domains were enriched for binding of FOXA1/2, GATA4, GATA6, and SOX17 (Extended Data Fig. 8a–b), known regulators of the early endodermal fate30. We then measured the significance in overlap between TF binding and all poised enhancers for each cell type and found strong enrichment for these regulators and PRDM1 in dEN (Extended Data Fig. 8c–d).
Figure 5. Regulatory dynamics at putative poised enhancers.
a. Selected browser tracks for H3K27Ac and H3K4me1 and normalized binding of FOXA1/2, SOX17, and GATA4/6 over the HNF1b locus. Grey vertical bars highlight regions enriched for H3K4me1 in dEN.
b. P values (−log10) for three or more of the most enriched DNA binding motifs (rows) at SMAD1 binding per cell type (columns).
c. RT-qPCR-based gene expression of selected lineage markers in dME (top) and dEN (bottom), comparing three GATA4 KD and control lines. The mean expression for 22 dEN and 24 dME marker genes (excluding GATA4 and SMAD1) is shown as the last bar in each panel. Error bars display the standard deviation in fold expression change. Asterisk highlights genes with significant (P < .05) change in expression between control and KD replicates.
d. Normalized SMAD1 (left) and H3K27Ac (right) occupancy decreases in shRNA KD versus control lines in dME but not in dEN.
In concordance with this analysis and global chromatin remodeling trends (Extended Data Fig. 8e), GATA4 is associated with dynamics of H3K4me1 in dEN and H3K27Ac in dME. Given that the SMAD proteins are known to interact with histone acetyltransferases EP300 and CBP31, this makes it plausible that through BMP signaling in dME, GATA4 interacts with SMAD1 and recruits EP300 to induce acetylation of H3K27 at target sites. This recruitment relationship is further supported by the higher enrichment of GATA4 motif instances at SMAD1 binding sites in dME versus dEN (Fig. 5b; Extended Data Fig. 8f) and the stronger enrichment of H3K27Ac at GATA4 targets in dME versus dEN (Fig. 3c).
To further explore this, we used several shRNAs to knock down (KD) GATA4 and then measured gene expression following differentiation into dME and dEN (Extended Data Fig. 9a). The mean expression for more than 20 lineage markers is very similar between control and KD cell lines, arguing that the KD cells still differentiate into comparable populations (Fig. 5c, right bar). While the GATA4 KD in dEN does not greatly affect any of the measured endoderm TFs (total P = 0.49, paired t-test), in dME the KD leads to a 1.7–4 fold reduction in the expression of seven key factors (total P = 5.39−5, paired t-test). GATA4 binding in dME and dEN occupies similar loci in control and KD cell lines (Extended Data Fig. 9b–c), and H3K27Ac super-enhancers in dME are largely unaffected by our knockdown (Extended Data Fig. 9d–e). Nonetheless, we observe a significant decrease in SMAD1 and H3K27Ac enrichment in dME at GATA4 target sites in the KD lines (Fig. 5d, P < 10−300, paired t-test). To a lesser degree, we also observe a decrease in mean SMAD1 occupancy at binding sites away from GATA4 (Extended Data Fig. 9f). This could be the result of the general reduction of SMAD1 expression in the dME KDs or linked to other TFs that aid SMAD1 binding, such as factors from the TEAD and GATA family (Fig. 5b).
Loss of DNAme at targets of lineage TFs
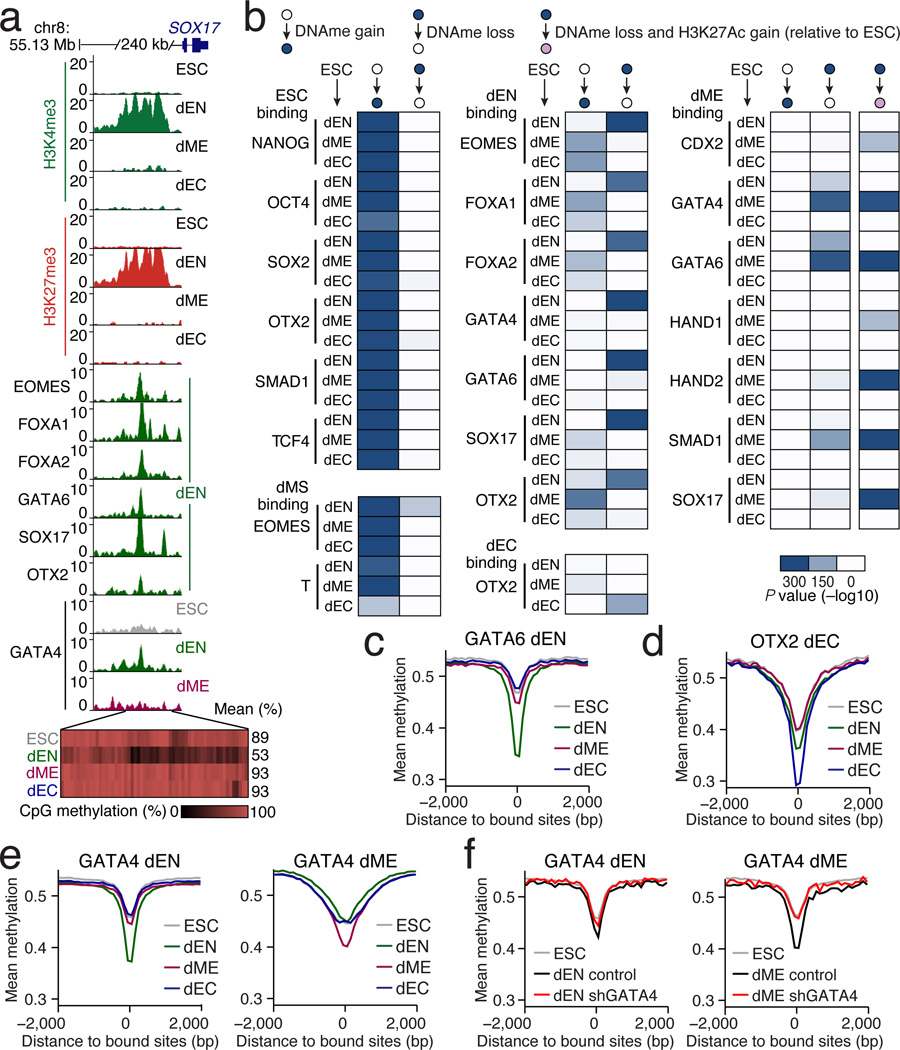
DNAme can silence genomic regions, directly or indirectly, and plays an important role during mammalian development5. Some TFs can modulate DNAme levels8, but it is not generally known what factors can alter it in a developmental context and which ones might be sensitive to its presence. In endoderm at a region upstream of SOX17, we observe specific loss of DNAme accompanied by epigenetic remodeling to a poised state. We also observe that the loss of DNAme associates with lineage-specific binding of several TFs (Fig. 6a, Extended Data Fig. 10a). Interestingly, OTX2 and NANOG show some enrichment already in ESCs that seems to be linked to a very focal depletion of DNAme that may serve as a means of initial marking or protecting the region for downstream binding (Extended Data Fig. 10b).
Figure 6. Specific loss of DNAme at targets of key lineage TFs.
a. Top: Browser tracks for H3K4me3 and H3K27me3 as well as enrichment of selected TFs upstream of SOX17. Bottom: Each rectangle represents a single CpG and its methylation state. Loss of DNAme occurs specifically in dEN, which coincides with changes in chromatin state and specific binding of several known endoderm factors.
b. Enrichment P values (−log10) for the overlap in TF binding and regions that gain or lose DNAme relative to ESCs. Possible transition states are defined at the top. Heatmaps display the enrichment of TF binding in ESCs, dMS (left), dEN, dEC (center), and dME (right) at differentially methylated regions in the three germ layers (rows).
c. WGBS based average CpG methylation level of 100bp tiles over GATA6 bound dEN targets.
d. WGBS mean methylation level at OTX2 dEC targets.
e. WGBS mean methylation level at GATA4 dEN and dME targets.
f. RRBS based average CpG methylation level of 100bp tiles over GATA4 targets in control and GATA4 KD cell lines in dEN (left) and dME (right). For comparison, WGBS ESC mean methylation level is also shown (grey).
We next performed global binding enrichment analysis for all TF binding at regions that either gained or lost DNAme. Many target sites of OSN as well as SMAD1 and TCF4 show gain of DNAme in all three lineages, consistent with silencing of their pluripotency related target genes (Fig. 6b, left). The dMS target sites of T and EOMES also become methylated in the three germ layer populations. Interestingly, we frequently find a reciprocal gain in DNAme in the alternative lineages of key dEN and dEC factors (Fig. 6b, middle).
As shown above near SOX17, we also find that lineage regulators associate with targeted loss of DNAme. For instance, in dEN binding sites of EOMES, FOXA1/2 (Extended Data Fig. 10c,d), GATA4/6, SOX17, and OTX2 display focal and germ layer specific loss of DNAme (Fig. 6b,c). We also find strong enrichment for loss of DNAme at OTX2 binding sites in dEC (Fig. 6b,d). In dME we find seven partially overlapping TFs that show loss of DNAme at their binding sites, especially in regions that also gain H3K27Ac (Fig. 6b,e; Extended Data Fig. 7c). Using reduced representation bisulfite sequencing (RRBS)32 we measured the DNAme level for a representative subset of targets in GATA4 KD and control lines. Both dME and dEN GATA4 KD cells displayed significantly higher methylation level (P < 10−10, paired t-test) (Fig. 6f, Extended Data Fig. 10e), suggesting a possible role for GATA4 in the focal depletion of DNAme.
Discussion
Directed differentiation of human ESCs into the three embryonic germ layers coupled with comprehensive TF binding analysis and integration with epigenomic data has allowed us to characterize differentiation associated regulatory dynamics. We find that targets of many lineage specific factors associate with loss of DNAme in those germ layers while factors that are expressed in more than one lineage (GATA4, GATA6, OTX2, SOX17), show a corresponding loss of DNAme at their targets in multiple cell types. This is in line with the model that some TFs have an intrinsic ability to alter DNAme, although more work is needed to determine if all of these can indeed be considered “pioneer factors”33. We also find a specific gain of DNAme for the targets of many TFs at later timepoints or in parallel time-points but along alternate lineages. This might present a possible mechanism for occluding binding sites of certain methylation sensitive factors at past or alternate differentiation paths.
To investigate the interplay between TF binding and the chromatin landscape, we focused on TF dynamics at H3K27Ac super-enhancers, where OTX2 and OSN seem to guide the transition to dEN while GATA4 and OTX2 act as key regulators for dME and dEC, respectively. GATA4 exemplifies a factor with distinct germ layer functions, where in dEN it resides at poised enhancers and in dME it appears to associate with SMAD1/EP300 to establish and maintain H3K27Ac domains. The dual use of GATA4 and OTX2 highlights the modularity in transcriptional networks in development and the complex interaction of downstream signaling effectors, TFs and chromatin in the three germ layers.
Methods
Human ES cell culture
Cell culture was done as reported previously9. Briefly, we chose the NIH approved, male human embryonic stem (ES) cell line HUES64 because it has maintained a stable karyotype over many passages and is able to differentiate well into the three germ layers. HUES64 was routinely tested for Mycoplasma and was negative in all instances. ES cells were maintained on ~15,000 cells/cm2 irradiated Murine Embryonic Fibroblasts (MEFs, Global Stem) and cultured in 20% Knockout Serum Replacement (KSR, Life Technologies), 200mM Glutamax (Life Technologies), 1X Minimal Essential Media (MEM) Non-Essental Amino Acids Solution (Life Technologies), 10ug/ml bFGF (Millipore), 55µM b-mercaptoethanol in Knockout Dulbecco’s Modified Eagle Medium (KO DMEM, Life Technologies). ES cells were passaged every 4–5 days using 1mg/ml Collagenase IV (Life Technologies).
Directed differentiation of human ES cells
When human ES cells reached 60–70% confluency on MEFs, the cells were plated as clumps on 6-well plates coated with Matrigel (Life Technologies) in mTeSR1 basal medium (Stem Cell Technologies). We maintained the cells for three days in feeder-free culture and then induced directed differentiation towards mesendoderm, endoderm, mesoderm, and ectoderm using different media conditions. For mesendoderm and endoderm differentiation cells were cultured for 12 and 120 hours, respectively, in Roswell Park Memorial Institute (RPMI) medium (Life Technologies) supplemented with 100ng/ml Activin A (R&D Systems), 50nM/ml WNT3A (R&D Systems), 0.5% FBS (Hyclone), 200mM GlutaMax (Life Technologies), 0.2X MEM Non-Essental Amino Acids Solution (Life Technologies), and 55µM b-mercaptoethanol. For the first 24 hours of mesoderm differentiation, cells were cultured in DMEM/F12 medium supplemented with 100ng/ml Activin A (R&D Systems), 10 ng/ml bFGF (Millipore), 100ng/ml BMP4 (R&D Systems), 100ng/ml VEGF (R&D Systems), 0.5% FBS (Hyclone), 200mM GlutaMax (Life Technologies), 0.2X MEM Non-Essental Amino Acids Solution (Life Technologies), and 55µM b-mercaptoethanol. From 24 to 120 hours of mesoderm differentiation, Activin A was removed from the culture. For ectoderm differentiation cells were cultured in DMEM/F12 medium supplemented with 2µM TGFb inhibitor (Tocris, A83-01), 2µM WNT3A inhibitor (Tocris, PNU-74654), 2uM Dorsomorphin BMP inhibitor (Tocris), 15% KOSR (Life Technologies), 0.2X MEM Non-Essental Amino Acids Solution (Life Technologies), and 55µM b-mercaptoethanol. Media was changed daily. Before inducing differentiation, we manually removed the differentiated cell clumps. We routinely obtain greater than 80% differentiated cells based on the presence of the surface marker CD56 (81.7% of mesoderm and 94.4% of ectoderm cells) and greater than 70% differentiated cells based on the surface marker CD184 for endoderm.
RNA extraction and RNA-seq
For measuring expression levels, RNA was isolated from the human ES cells and differentiated cells using TRIzol (Invitrogen, 15596-026), further purified with RNeasy columns (QIAGEN, 74104) and DNase treated. RNA-seq library construction and data analysis was carried out as described previously9.
Antibodies
Supplementary Table 2 lists detailed information for all antibodies used in this study, along with references that validate the specificity and use of this antibody.
MNChIP-seq and library construction
ChIP-seq for all chromatin marks was done as in9. MNChIP-seq for TFs was carried out as in9 with several modifications including the micrococcal nuclease (MNase) digestion. Briefly, cell were grown to a final count of 10 million, resuspended in PBS, and crosslinked in 10% formaldehyde solution for 10 minutes at room temperature. Following quenching with 0.125M glycine and two PBS washes, we isolated nuclei using cell lysis buffer (20 mM Tris-HCl ph8, 85mM KCl, 0.5% NP40). Nuclei were then digested using MNase (Worthington, LS004797) as done in18. Digestion was stopped with 0.05M EGTA and chromatin was aliquoted into 1–2 million cells per ChIP. Antibodies were added and immunoprecipitation was carried out overnight at 4°C as done in9. The next day, protein G beads (Life Technology, 10009D) were added for 2 hours at 4°C to isolate the protein bound DNA and washed twice using Low Salt Wash Buffer (0.1% SDS, 1% Triton X-100, 2mM EDTA, 20mM Tris-HCl pH 8.1, 150mM NaCl), High Salt Wash Buffer (0.1% SDS, 1% Triton X-100, 2mM EDTA, 20mM Tris-HCl pH 8.1, 500mM NaCl), LiCl Wash Buffer (0.25M LiCl, 0.5% NP40, 0.5% sodium deoxycholate, 1mM EDTA, 10mM Tris-HCl pH 8.1,), and TE Buffer pH 8 (10mM Tris-HCl, pH 8, 1mM EDTA pH 8). DNA was eluted twice using 100µL of ChIP Elution Buffer (1% SDS, 0.1M NaHCO3) at 65°C for 15 minutes. Crosslinking was reversed by addition of 32µl reverse crosslinking salt mixture (250 mM Tris-HCl pH 6.5, 62.5 mM EDTA pH 8, 1.25 M NaCl, 5mg/ml Proteinase K) for 5–18 hours at 65°C. DNA was isolated using phenol/chloroform extraction and treated with DNase-free RNase for 30 minutes at 37°C. The whole cell extract (WCE) control was generated using MNase treated material that was then reverse crosslinked and phenol chloroform extracted, skipping the immunoprecipitation and washing steps. DNA libraries were constructed using standard Illumina protocols for blunt-ending, polyA extension, and ligation, except each clean-up step was replaced with phenol-chloroform extractions to preserve small fragments as done in18. Ligated DNA was then PCR amplified and gel size selected for fragments between 30 and 600bp. Samples were sequenced using Illumina HiSeq at a target sequencing depth of 20 million uniquely aligned reads.
shRNA infection and knockdown experiments
ES cells were maintain MEFs in KSR culture media as described above and passaged onto geltrex coated dishes in mTeSR1 culture media prior to infection. When cells were ~75% confluent, cells were collected with accutase as single cells or small clumps. 100,000 ES cells were plated per well of 12 well plate coated with geltrex and in mTeSR1 culture media. After 24 hours, ES cells were infected twice on separate days for 3 hours with approximately 30 viral particles per cell. 48 hours after the last infection, cells were selected with 1ug/ml puromycin until the non-infected ES cells die off (usually within 3 days). Knockdown (KD) and control shRNA-infected ES cell lines were then maintained as described above. We then performed directed differentiation of three control and KD cell lines into 5-day dEN and dME. We collected cells and carried out RNA and DNA extraction as in9. cDNA reaction was set-up from 1ug of total RNA per sample using High-Capacity cDNA RT Kit (Life Technologies). qPCR was performed on 384-well TaqMan hPSC Scorecard plates using Viia7 RUO software and Applied Biosystems ViiA7 instrument. CT values were normalized using two probes of the ACTN housekeeping gene and averaged for the three GATA4 KD and three control cell lines to obtain fold change in expression. DNA was used for reduced representation bisulfite sequencing (RRBS) as in32. We also collected crosslinked cells from the same samples and carried out MNChIP-seq for GATA4, SMAD1, and H3K27Ac as described above. Composite plots display the average normalized occupancy for three GATA4 KD and two control cell lines. We used pLKO.1 cloning vector with the following target sequences for GATA4 KD: CCAGAGATTCTGCAACACGAA, CGAGGAGATGCGTCCCATCAA, CCCGGCTTACATGGCCGACGT. The shRNA control cell lines targeted gene products not present in the human genome using the same cloning vector with the following target sequences: TGACCCTGAAGTTCATCTGCA (GFP) and CACTCGGATATTTGATATGTG (LUCIFERASE).
Selection of transcription factors
Approximately half of the transcription factors (TFs) were chosen because they are known to play an important role in regulation of pluripotent cells or in the transition to mesendoderm (e.g. BRACHYURY), endoderm (e.g. SOX17), mesoderm (eg. GATA4), and ectoderm (e.g. OTX2). Others were chosen computationally based on Nanostring expression analysis and RNA-seq data. Previous work12 identified that OCT4 and SOX2 play distinct roles in the transition from ES cells to mesendoderm and ectoderm based on differential expression of these TFs in the two lineages. We used a similar approach to computationally identify factors that are differentially expressed in mesoderm and endoderm. Another study showed that temporal upregulation of TFs can be indicative of their importance at specific stages of blood differentiation34. We used this approach to identify factors that were upregulated upon transition to mesendoderm, mesoderm and endoderm and included those as well in the study (see Supplementary Table 2 for additional details on the factors).
ChIP-seq and MNChIP-seq data processing
Reads were aligned to the hg19 reference assembly using bwa version 0.5.7 (Ref. 35) with default parameter settings. Subsequently, reads were filtered for duplicates and extended by 200bp. For visualization, extended reads were summed at each base and normalized for sequencing depth by scaling the y-axis to represent cumulative reads per 1 million reads sequenced. This normalization was used for browser and heatmap visualizations of the data in all figures. We used MACS36 peak calling algorithm with default settings to identify significant binding events for each TF, excluding duplicate reads. Peaks were additionally discarded if they overlapped with regions that MACS detected as peaks in four different WCE samples. Such regions have been shown to cause false positive peaks in ChIP-seq data due to unannotated high copy number regions37. Peaks were then annotated according to their proximity to transcription start sites (TSSs) using Homer38. Peaks within exons and introns were annotated first. Then, peaks overlapping a region from −2,000bp to +500bp of their nearest TSS were annotated to promoters. Peaks outside of promoters but not in exons or introns were annotated as distal.
Data quality assessment and motif analysis
To quantify enrichment over background, we measured the percentage of reads in peaks by counting all unique tags within 1,000bp regions centered on all binding events, using bedtools multicov function with default parameters. To compare to ENCODE, we downloaded all (n=1,410) TF ChIP-seq profiles with matching peak and raw data (.bam) files from hgdownload.cse.ucsc.edu/goldenPath/hg19/encodeDCC/, and computed the percentage reads in peaks in the same manner. Since ENCODE data was collected in cell types where the factors are known to be active, for Extended Data Figure 1f we excluded all our TF binding profiles for timepoints where the factors are not highly expressed and expected to be inactive (middle box plot).
To quantify the specificity of our antibodies computationally, we carried out motif analysis that measured the enrichment of 1,887 known DNA binding sequences at 500bp regions centered on the peaks of each TF using Centrimo39 and Homer38 (Extended Data Fig. 2). For six factors, (POL2, SALL4, T, NR5A2, THAP11, TRIM28) we did not find a reliable DNA-binding motif in the database of 1887 motifs combining TRANSFAC and Jolma et al. data sets20. For the remaining 32 TFs, we found that 88% (28/32) of factors significantly (P < 10−75) associate with the known DNA binding motif. Moreover, we carried out de novo motif discovery for these factors (using MEME40 and Homer38) and show that these motifs are highly similar to the known motifs, further supporting the specificity of these antibodies (Extended Data Fig. 2). For the other 4 factors (SRF, REX1, STAT3, TAL1) of the 32, we believe that either the known motifs in the database do not match the in vivo binding affinities for these factors in our cell types or that cross-reactivity of the antibody with other proteins is occurring. To be conservative, we have excluded all these factors from further analyses, figures, and the main manuscript. The GATA4 and SMAD1 motif enrichment in Extended Data Figure 8f was also carried out using Centrimo39 with weighted moving average of window 50bp. Finally, motif enrichment for Figure 5b was carried out by scanning 1887 motifs (see above) within 500bp of binding using Centrimo39 and displaying three or more of the most enriched DNA motifs per cell type.
TF dynamics and co-binding relationships
For quantifying TF dynamics between cell types and co-binding relationships between TFs, peak regions were merged if two peak centers were a distance of 1000bp or less, and significance P values were calculated using the hypergeometric distribution and were subsequently corrected for multiple hypothesis testing. For each TF MNChIP in each condition, we calculated a vector of the −log10 P values for interactions with all other experiments. We then clustered all vectors along both rows and columns based on correlation distance using hierarchical clustering algorithm and average linkage (Fig. 3a). We filtered all experiments with no interactions at significance level P value < 10−5 for ease of visualization. To define classes of TF binding dynamics, binding was termed enhanced/suppressed if we observed at least a 2-fold increase/decrease in binding sites between two different conditions. If the binding sites had not decreased/increased 2 fold between two conditions, we defined the co-binding relationship as static if P value < 10−300, and dynamic if P value > 10−300.
Defining chromatin state
For differential signal enrichment analysis, we first computed the number of uniquely aligned sequencing tag midpoints for all 1kb tiles of the genomic black list filtered human genome. Genomic region black lists were obtained from http://hgdownload.cse.ucsc.edu/goldenPath/hg19/encodeDCC/wgEncodeMapability/wgEncodeDacMapabilityConsensusExcludable.bed.gz.
For each histone mark and each condition, we then determined all 1kb tiles significantly enriched over the whole cell extract (WCE). To that end, we fitted local Poisson models to the read count normalized WCE tag distribution for each 1kb tile of the human genome41. Only regions enriched 3 fold or higher compared to the whole cell extract and significant after correcting multiple testing using the Benjamini-Hochberg method at a q-value ≤ 0.05 were retained. In order to identify differentially enriched regions between ES cells and each of the ES cell derived populations, we took advantage of a recently published analysis strategy based on mixture models that allows to incorporate replicate information and to correct for differences in IP efficiency and signal to noise ratio42. We used the R implementation in the software package enrich to first fit a latent Poisson mixture model with two components to each ChIP-Seq experiment in order to obtain an estimate of the fraction of reads in the signal component. Next, we used the initial parameter estimates from the latter model to fit a joint Poisson mixture model for each group of biological replicates. Finally, we used the obtained models for each sample group to conduct pairwise comparisons accounting for sequencing depth and differences in IP efficiency. To that end, we made the assumption that the true number of enriched regions between two compared conditions for a given mark or factor is similar and set the p parameter in the enrich mix function to 1. Finally, we obtained a list of candidates of differentially enriched regions at an FDR=0.05 and retained only those regions that exhibited an absolute log2 difference ≥ 1.5 in the estimated tile enrichment levels and that were significantly enriched above background according to the first analysis step. Next, we specifically decided to exclude more gradual changes in histone modifications and restricted the set of differentially enriched regions to those that were above background in one but not the other condition in each of the pairwise comparisons: ES cell vs. dMS, ES cell vs. dEN, ES cell vs dME and ES cell vs. dEC. Based on these differential analysis results, we then binarized our ChIP-Seq histone modification enrichment matrix. Next, we used this binarized matrix to assign each tile one of 10 states, now also incorporating DNA methylation data. The states were defined as follows (see below for details) with their order recapitulating their precedence: H3K4me3&H3K27me3, H3K4me3, H3K27me3&H3K4me1, H3K27ac, H3K4me1, H3K27me3, unmethylated region (UMR, where 0%≤UMR≤10% methylation), intermediate methylated region (IMR, where 10%<IMR≤60% methylation), highly methylated region (HMR, where 60%<HMR≤100% methylation), none (no detectable histone modification enrichment or DNA methylation data for a given 1kb tile).
Super-enhancer analysis
Using chromatin data, we defined super-enhancers as in24,25. Briefly, we used MACS36 peak calling algorithm (default settings, except –p parameter was set to 1e−9) to detect enrichments in H3K27Ac ChIP-seq data for each cell type. Peaks were then merged if they were within a distance of 12.5kb. We then ranked the stitched H3K27Ac enriched regions based on the normalized, background-subtracted average read density (in units of reads-per-million-mapped per bp of stitched region). The cutoff for classifying super-enhancers was defined as in24,25, or the point where a line with a slope 1 is tangent to the curve of normalized region signal versus region ranking. The same procedure was used to define H3K4me1 super-enhancers per cell type.
We also used this procedure to find super-enhancers at a less stringent set of parameters (MACS parameter –p set to 1e−5 instead of 1e−9 and stitching distance set to 5kb instead of 12.5kb), but found no differences in our conclusions (Supplementary Table 5). We also found no difference when using other cutoffs for defining super-enhancers (top 250, top 500, top 1000, and top 2000 enhancer regions, Supplementary Table 5), and found that using a fixed threshold had the advantage of uniformity between cell types in the enrichment analysis. Finally, excluding all enriched regions within 2500kb of TSSs also led to highly similar results and did not change our conclusions.
Chromatin states versus super-enhancers
H3K27Ac chromatin states are 1kb genomic tiles that are significantly enriched for H3K27Ac over whole cell extract (WCE) and not enriched for other chromatin marks of higher priority. These regions are the ones displayed in the chromatin states maps that happen to fall into stitched H3K27Ac super-enhancers. For an extended H3K27Ac region to be classified as a super-enhancer, it must be enriched in H3K27Ac read density relative to all other H3K27Ac enhancer regions (not relative to WCE) for a given cell type.
TF enrichment analysis
We assessed the significance of overlap in TF binding and regions merged within super-enhancers by using the hypergeometric distribution. For each cell type, we only used TF peak regions in that cell type and super-enhancers as defined by chromatin data for that cell type. We used the same approach for measuring the TF binding enrichment at poised enhancers, or regions enriched for H3K4me1 and H3K27me3 histone modifications29. For chromatin state transition analysis, we defined the initial state as ES cells and the next cellular state as dMS or one of the three germ layers (dEN, dME, and dEC).
We then carried out TF enrichment analysis using MNChIP binding data per cell type and different epigenetic state transitions into that cell type. P values were again calculated using the hypergeometric distribution, and were subsequently corrected for multiple hypothesis testing. This analysis was used for both chromatin state transitions and DNA methylation state transitions. For Figure 6b, we identified all differentially methylated 1kb tiles in the genome (mean methylation difference ≥ .15) between ES cells and the three germ layers. In addition, we also identified regions that transitioned from an HMR state to an H3K27Ac state, termed regions that lose methylation and gain H3K27Ac. We then carried out the enrichment analysis for TF binding in these regions as described above.
Heat maps and composite plots
Heatmaps were generated for regions −1kb to 1kb from the center of each merged TF peak, using bins of size 50bp. ChIP occupancy was normalized to sequencing depth as described above. Peaks for two or three ChIP-seq experiments were merged prior to heatmap generation using Homer, as described above. ChIP-seq composite plots were generated for regions −5kb to 5kb from the center of each TF peak, using bins of size 200bp. Signal was normalized to sequencing depth, where 1 represents the mean ChIP occupancy at regions furthest from the peaks. DNA methylation composite plots were generated for regions −2kb to 2kb from the center of each TF peak, using bins of size 100bp. Mean methylation was calculated by averaging of the methylation ratio at all unique CpGs within a given bin, excluding bins with no CpGs. P values for composite plots were calculated between two samples (e.g. KD and control) by finding the normalized histone mark enrichment or normalized methylation level for each sample at 300bp regions centered around each TF peak, and then using the paired t-test. Using region size of 150bp or 600bp led to the same biological conclusions. RRBS captured only 1,897 of the 42,477 GATA4 bound regions in dEN and 2,331 of 35,842 GATA4 bound regions in dME with sufficient CpG methylation coverage; hence only these regions were used for the composite plots in Figure 6f, Extended Data Figure 10e, and P value calculation.
Extended Data
Extended Data Fig. 1. MNase ChIP-seq (MNChIP-seq) performance compared to sonication based ChIP-Seq.
a. Venn diagram (top) and corresponding heatmaps (bottom) show high reproducibility of CTCF binding between biological replicates in ESCs using MNChIP-seq. Heatmaps display normalized binding occupancy averaged using 50bp bins. Regions are centered on the merged binding peaks for the two replicates, where 10=regions bound in replicate 1, 01=bound in replicate 2, and 11=bound in both.
b. Venn diagram (top) and corresponding heatmaps (bottom) show high reproducibility of NANOG binding between biological replicates in ESCs using MNChIP-seq. Heatmaps display normalized binding occupancy averaged using 50bp bins. Regions are centered on the merged binding peaks for the two replicates, where 10=regions bound in replicate 1, 01=bound in replicate 2, 11=bound in both.
c. Venn diagram (top) and corresponding heatmaps (bottom) show high reproducibility of NANOG binding between biological replicates in ESCs using sonication ChIP-seq. Reproducibility of NANOG binding using sonication based ChIP-seq is similar to reproducibility using MNChIP-seq.10=regions bound in replicate 1, 01=bound in replicate 2, 11=bound in both.
d. Venn diagram (top) and corresponding heatmaps (bottom) show a higher sensitivity for capturing NANOG binding sites in ESCs using MNChIP-seq. Heatmaps display normalized binding occupancy averaged using 50bp bins. Regions are centered on the merged binding peaks for the two replicates, where 10=regions bound in replicate 1, 01=bound in replicate 2, 11=bound in both.
e. Heatmaps show high reproducibility of GATA4 binding in both dEN and dME using MNChIP-seq. Heatmaps display normalized binding occupancy averaged using 50bp bins. Regions are centered on the merged binding peaks for the two replicates, where 10=regions bound in factor 1, 01=regions bound in factor 2, 11=regions bound in both.
f. Top: Number of significant binding peaks in our data set is comparable to that of 1,410 ENCODE TF ChIP-seq profiles (all currently available with matching peak and .bam files at UCSC). Bottom: The level of enrichment over background, as quantified by percentage of reads in peaks, is approximately 1.5 times less than that of the ENCODE TF binding data. ENCODE data was collected in cell types where the factors are known to be active; therefore, for this comparison we excluded all TF binding profiles for timepoints where the factors are not expressed and expected to be active (middle column).
Extended Data Fig. 2. Motif analysis.
88% (28/32) of factors significantly associate with their known DNA binding motif (P < 10−75). De novo motif discovery for these factors confirms their known motifs, which provides further validation for the antibody specificity. For SRF, REX1, STAT3, and TAL1 the motifs did not match the database motifs. To be conservative, we excluded these factors from further analyses. For the remaining six factors, (POL2, SALL4, T, NR5A2, THAP11, TRIM28) we did not find a reliable DNA-binding motif in the database of 1,887 motifs combining TRANSFAC and Jolma et al. data sets20.
Extended Data Fig. 3. Examples of TF binding dynamics across several loci.
a. Binding dynamics for a number of selected TFs in the four differentiated cell types versus ESCs (temporal) and in dEN versus dME (cross-lineage).
b. Normalized TF binding of NANOG, EOMES, GATA4, and SMAD1 shows distinct and germ layer specific regulation of the GATA6 locus. WCE = whole cell extract.
c. Normalized TF binding at the HAND1 locus shows very static binding for NANOG between cell types, somewhat dynamic binding of OTX2 in dEN and dEC, and more dynamic binding of GATA4 in dEN and dME. Purple boxes upstream of HAND1 mark long domains of H3K27Ac, which are highly enriched for GATA4 and SMAD1 binding in dME (bottom tracks).
d. Normalized MNChIP-seq binding of multiple factors across different cell types show strong enrichments over whole cell extract (WCE) control (bottom track). The high similarity in CTCF binding between cell types might suggest that chromatin loops, nuclear lamina interactions, and chromatin boundaries regulated by CTCF are largely preserved during early human ESC differentiation.
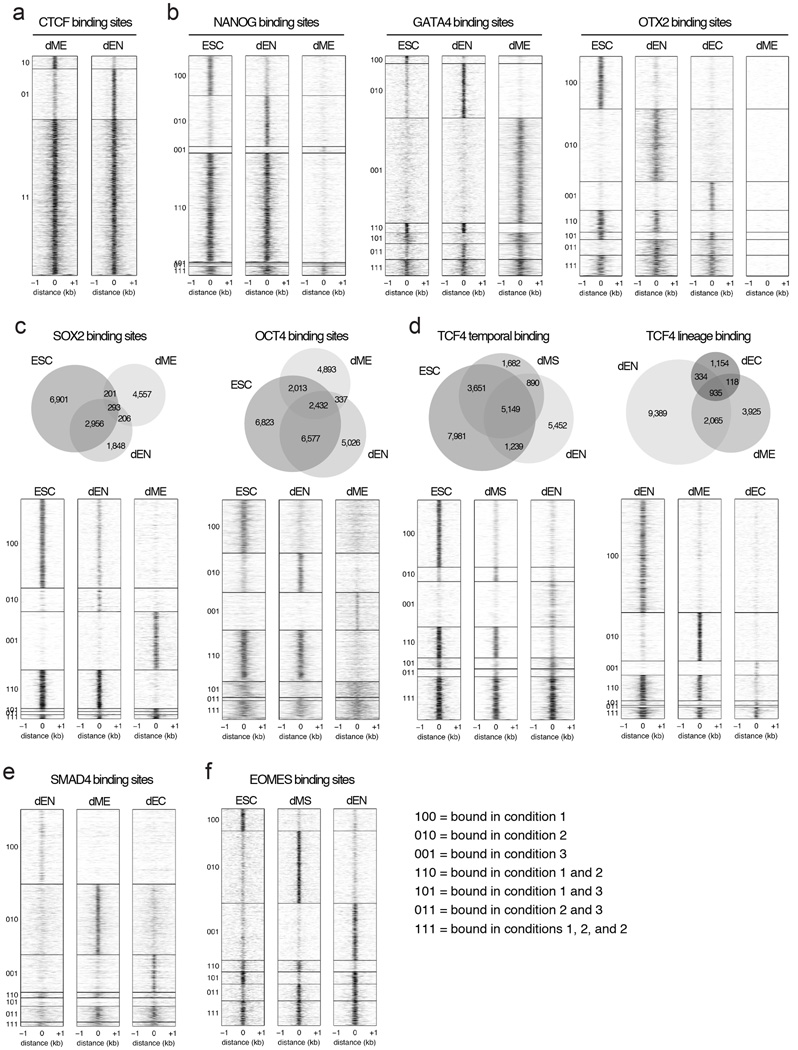
Extended Data Fig. 4. Venn diagrams and heatmaps highlighting different TF binding dynamics in human ESCs and their derivatives.
a. Heatmaps show that CTCF binding overlaps highly in dEN and dME. Heatmaps display normalized binding occupancy averaged using 50bp bins. Regions are centered on the merged binding peaks for the two cell types, where 10=regions bound in dME, 01=bound in dEN, 11=bound in both.
b. Heatmaps show that NANOG binding is static in ESCs and dEN and suppressed in dME (left). In contrast, GATA4 binding is highly dynamic between dEN and dME and enhanced in the germ layers relative to ESCs (middle). Finally, OTX2 binding is dynamic in dEN and dEC relative to ESCs, but suppressed in dME (right). Heatmaps display normalized binding occupancy averaged using 50bp bins. Regions are centered on the merged binding peaks for the three conditions, where regions 100, 010, 001, 110, 101, 111 are defined in legend on bottom right (panel 4f).
c. Venn diagrams (top) and heatmaps (bottom) show the binding dynamics of SOX2 (left) and OCT4 (right). Heatmaps display normalized binding occupancy averaged using 50bp bins. Regions are centered on the merged binding peaks for the three conditions, where regions 100, 010, 001, 110, 101, 111 are defined in legend in panel 4f.
d. Venn diagram (top) and heatmaps (bottom) show that TCF4 binding is temporally static in dMS and dEN (left) and suppressed in dME and dEC relative to dEN (right).
e. Heatmaps show that SMAD4 predominantly binds to unique regions in the three germ layers.
f. Heatmaps show that EOMES binding is enhanced from ESCs to dMS and dynamic in dEN. Heatmaps display normalized binding occupancy averaged using 50bp bins. Regions are centered on the merged binding peaks for the three conditions, where regions 100, 010, 001, 110, 101, 111 are defined in legend on the right.
Extended Data Fig. 5. Heatmaps of GATA4 and OTX2 co-binding relationship with SMAD1 in germ layers.
a. Heatmaps show that overlap in binding between GATA4 and SMAD1 is smaller in dEN (left) than in dME (right). Heatmaps display normalized binding occupancy averaged using 50bp bins. Regions are centered on the merged binding peaks for the three conditions, where 10=regions bound by factor 1, 01=regions bound by factor 2, 11=regions bound by both factors. Regions were considered co-bound if peaks for both factors occurred within distance d, set to 1000bp for most analyses. Decreasing the distance d for dME to 500bp has little effect. Setting d to 200bp and 100bp decreases co-bound peaks in dME by about 25% and 50%, respectively.
b. Heatmaps show that overlap in binding between OTX2 and SMAD1 is higher in dEN (left) than in dEC (right). Heatmaps display normalized binding occupancy averaged using 50bp bins. Regions are centered on the merged binding peaks for the three conditions, where 10=regions bound by factor 1, 01=regions bound by factor 2, 11=regions bound by both factors.
c. Venn diagrams (top) and heatmaps (bottom) show that the overlap in binding between GATA4 and SMAD4 is greater in dME than in dEN. Heatmaps display normalized binding occupancy averaged using 50bp bins. Regions are centered on the merged binding peaks for the three conditions, where 10=regions bound by factor 1, 01=regions bound by factor 2, 11=regions bound by both factors.
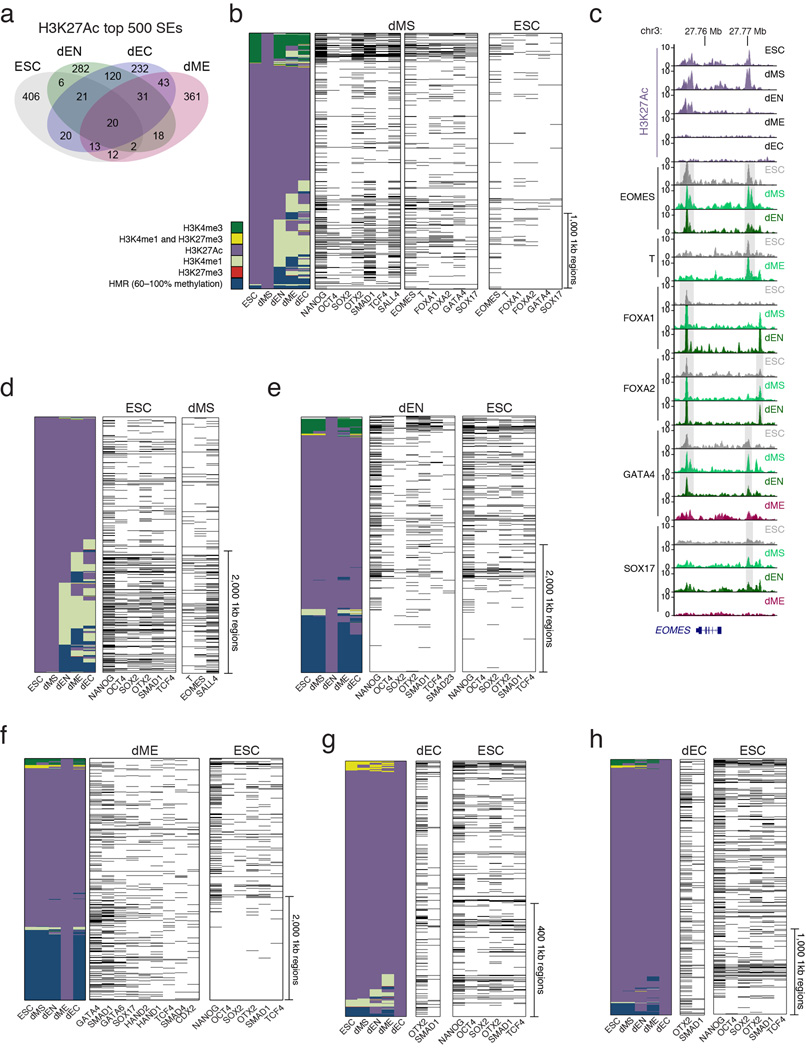
Extended Data Fig. 6. related to Fig. 4: Extended H3K27Ac domains in the germ layers.
a. Overlap of top 500 extended H3K27Ac domains shows little overlap of these regions between cell types.
b. Left: Alternative lineage chromatin states of stitched dMS H3K27Ac super-enhancers (n=698, merging 3,441 1kb regions shown as columns in the heatmap). Chromatin states (see Supplementary Information for detailed definitions of “extended H3K27Ac domains” and “H3K27Ac chromatin states”) that are displayed in the panel are explained in the legend (bottom left, HMR=Highly Methylated Region). Center: Corresponding binding of the most enriched TFs in dMS. Black bars indicate TF binding. Right: Corresponding binding of selected factors in ESCs.
c. Genome browser tracks for H3K27Ac across all cell types and normalized TF binding in selected cell types for EOMES, T, FOXA1/2, GATA4, and SOX17 over the EOMES locus. Grey bars highlight regions where TF binding is present in ESCs and at later stages in differentiation, suggesting that these loci are primed for binding by these factors in ESCs. Although we cannot distinguish whether this happens in all cells or just a subpopulation, it is tempting to speculate that this binding occurs in the subset of cells in G1, which is the population that is most responsive to differentiation cues43. This would also be in line with DNAseI footprint studies that reported usage of EOMES DNA-binding sites in human ESCs44.
d. Left: Alternative lineage chromatin states of stitched H3K27Ac super-enhancers in ESCs (n=1,052, merging 4,191 1kb regions shown as columns in the heatmap). Chromatin states that are displayed in the panel are explained in the legend in panel b (bottom left, HMR=Highly Methylated Region). Center: Corresponding binding of the most enriched TFs in ESCs. Black bars indicate TF binding. OSN and OTX2 are the most enriched factors. Interestingly, OTX2 was recently shown to play an important role in the mouse naïve to primed pluripotent state transition, a cellular state considered to be similar to human ES cells26. Right: Corresponding binding data for T, EOMES, and SALL4 in dMS, showing that these key dMS regulators are present at many of these super-enhancers in the next stage of differentiation.
e. Left: Alternative lineage chromatin states of stitched H3K27Ac super-enhancers in dEN (n=1,152, merging 4,051 1kb regions shown as columns in the heatmap). States are defined as in panel b. Center: Corresponding binding of the most enriched TFs in dEN. Black bars indicate TF binding. Right: Corresponding binding of selected TFs in ESCs shows that these factors occupy many of these regions in the undifferentiated state. Despite the fact that H3K27Ac domains are highly unique in the different cell types, we note that OSN, OTX2 and SMAD1 binding in undifferentiated ESCs is observed prior to the other factors that will mediate the transition to super-enhancer status in the three germ layers (Extended Data Fig. 6e–h, right panels). Similarly, as noted above, regulators of super-enhancers in the germ layers also associate with these regions already in the pluripotent state. This might suggests that TF binding at germ layer specific H3K27Ac domains in the ESCs could be involved or necessary for the future handoff. Possible roles could include active regulatory binding or a way to simply mark super-enhancers; alternatively, it could also provide an active protection from silencing by the highly expressed DNA methylation machinery. In this context it is worth noting that OSN binding in the undifferentiated cells is depleted in a subset of super-enhancers that are highly methylated (Extended Data Fig. 6e–h, bottom right) suggesting a possible binding sensitivity to DNA methylation, which has been reported for OCT4 (Ref 45).
f. Left: Alternative lineage chromatin states of dME H3K27Ac super-enhancers (n=1,129, merging 4,717 1kb regions shown as columns in the heatmap). States are defined as in panel c. Center: Corresponding binding of the most enriched TFs in dME. Black bars indicate TF binding. Right: Corresponding binding of selected factors in ESCs. GATA4 and SMAD1 are the most highly enriched factors at dME super-enhancers (Extended Data Fig. 6e, 7). Globally, GATA4 also interacts significantly with SMAD1 and SMAD4 in dME (hypergeometric P < 10−300) but less so in dEN (Fig. 3a, Extended Data Fig. 5c). This suggests that GATA4 interacts with SMAD1/4 at genomic targets and specifically at super-enhancers to act as a possible key regulator of the transition from pluripotent to a mesodermal state in response to BMP signaling. Recent studies have reported that master regulators in various cell types interact with TFs downstream of key signaling pathways in a similar manner46.
g. Left: Alternative lineage chromatin states of stitched H3K27Ac super-enhancers in dEC (n=506, merging 908 1kb regions shown as columns in the heatmap). States are defined as in panel b. Center: Corresponding binding of the most enriched TFs in dEC. Black bars indicate TF binding. Right: Corresponding binding of selected TFs in ESCs shows that these factors occupy many of these regions in the undifferentiated state. OTX2 is known to play important roles in brain, craniofacial, and sensory organ development28,47,48. In mice, Otx2 is required from E10.5 onward to regulate neuronal subtype identity and neurogenesis in the midbrain28, and inhibition of FGF signaling upregulates OTX2 and subsequently induces the neuroectodermal regulator PAX6 (Ref 48). Complementing these previous studies, our results suggest that it may play a central role in mediating the transition from pluripotency to early ectoderm. Interestingly, in dEC OTX2 does not globally associate with SMAD1 outside of super-enhancers to the same degree as in dEN (Fig. 3a). Taken together, we observe differential co-binding between SMAD1 and GATA4 or OTX2 in the respective germ layers that is linked to differential signaling, which may guide the remodeling of the associated chromatin.
h. Left: Alternative lineage chromatin states of the top 3,000, 1kb-long H3K27Ac enhancers in dEC, showing a comparable number of genomic regions as in the other cell types. States are defined as in panel b. Center: Corresponding binding of OTX2 and SMAD1 in dEC shows a higher enrichment for these factors at H3K27Ac enhancers than when only surveying the top 908 1kb regions (panel d). Black bars indicate TF binding. Right: Corresponding binding of selected TFs in ESCs shows that these factors occupy many of these regions in the undifferentiated state.
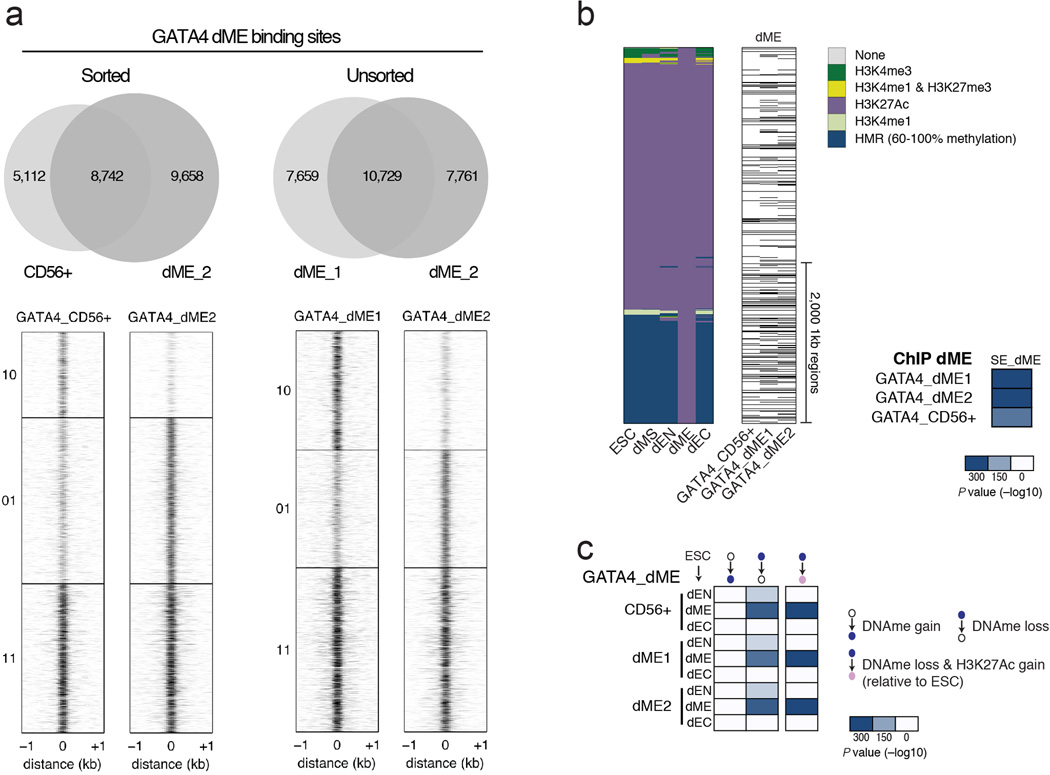
Extended Data Fig. 7. Quantification of cell sorting in dME on GATA4 binding.
a. Left: Venn diagrams (top) and heatmaps (bottom) show that the overlap in binding between GATA4 ChIP-seq in sorted CD56+ cells and unsorted dME cells is very similar. In particular, the unique binding sites in unsorted cells (y-axis label 01) also show visible but less significant binding in sorted cells, arguing that unsorted cells do not add many false positive peaks. Conversely, unique binding sites in sorted cells (y-axis label 10) show that less than half of these sites are truly unique, or with no detectable binding in unsorted cells. Right: Venn diagrams (top) and heatmaps (bottom) shows the overlap in binding between two GATA ChIP-seq replicates in unsorted dME populations. The overlap in binding between replicates using unsorted cells is similar to the overlap in binding between sorted and unsorted cells shown on the left.
b. Left: Alternative lineage chromatin states of dME H3K27Ac super-enhancers (n=1,129, merging 4,717 1kb regions shown as columns in the heatmap). States are defined in legend (top right, HMR=Highly Methylated Region). Center: Corresponding binding of GATA4 in sorted CD56+ cells, and two unsorted dME replicates (dME1 and dME2). Black bars indicate TF binding. Right: Enrichment P values (−log10) for GATA4 binding at H3K27Ac super-enhancers are slightly more significant (hypergeometric P < 10−300) for unsorted cells than for sorted cells (hypergeometric P < 10−225). This shows that the conclusions for GATA4 in dME are largely unaffected by cell sorting. Moreover, since our enrichment analysis compares overlaps of binding at thousands of sites, this comparison argues that the analysis is in general robust to using unsorted cell populations.
c. Enrichment P values (−log10) for the overlap in TF binding and regions that gain or lose DNA methylation relative to ESCs (see Supplementary Information). Possible transition states are defined at the top. Heatmaps display the enrichment of GATA4 binding in sorted CD56+ cells, and two unsorted dME replicates (dME1 and dME2). Unsorted cells have similar enrichment P values (hypergeometric P < 10−300) than sorted cells(hypergeometric P < 10−300). This shows that the methylation conclusions for GATA4 in dME are largely unaffected by cell sorting and again argues that our enrichment analysis is robust to using unsorted cell populations.
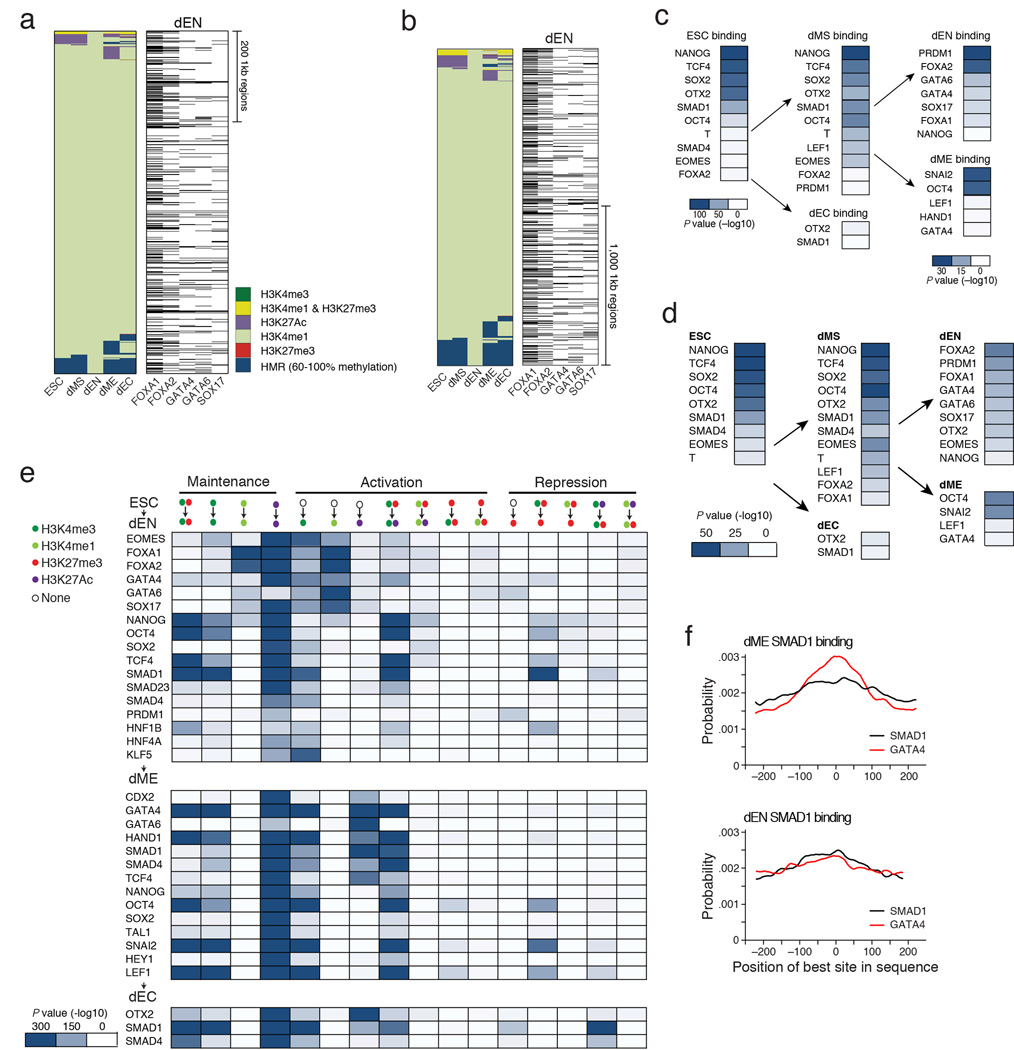
Extended Data Fig. 8. related to Fig. 5: Regulation of poised enhancers and other epigenetic state transitions.
a. Left: Alternative lineage chromatin states of dEN H3K4me1 super-enhancers (n=309, merging 760 1kb regions shown as columns in the heatmap). Chromatin states that are displayed in the panel are explained in the legend (bottom right, HMR=Highly Methylated Region). Right: Corresponding binding of the most enriched TFs in dEN, where the black bars indicate TF binding.
b. Left: Alternative lineage chromatin states of the top 2,000 1kb-long dEN H3K4me1 enhancers in dEN (shown as columns in the heatmap). Chromatin states that are displayed in the panel are defined in the legend (bottom right, HMR=Highly Methylated Region). Right: Corresponding binding of the most enriched TFs in dEN, where the black bars indicate TF binding. Increasing the number of regions displayed shows a higher enrichment for dEN factors at H3K4me1 enhancers than when only surveying the top 760 1kb regions (Extended Data Fig. 8a).
c. Enrichment P values (−log10) for the most significant overlaps between all poised putative enhancers (H3K27me3 & H3K4me1) and each TF’s binding profile in the respective cell type. Enrichment P values for dEN and dME (right column) are lower than in ESCs, which is likely the result of the overall smaller number of poised enhancers in those two germ layers. The scale is therefore adjusted for dEN and dME as shown in the respective legends. In ESCs, we find that poised enhancers are highly enriched for binding by OSN, OTX2, TCF4 and SMAD1 in the pluripotent state (Extended Data Fig. 8c–d). In dMS, we see the same regulators along with T, EOMES, and LEF1 are present at poised enhancers (Extended Data Fig. 8c–d, center). In contrast, poised enhancers in dEN show strong enrichment for PRDM1 and many of the regulators mentioned above (Extended Data Fig. 8c–d, right). Lastly, in dME, we find enrichment for SNAI2, which is known for its activity in mesoderm including blood development49.
d. Summary table of enrichment P values (−log10) displaying the most significant overlaps between the top 500 poised enhancers (H2K27me3 & H3K4me1) and each TF’s binding profile within a given cell type (ESCs, left; dMS, center; dEC, bottom center; dEN and dME, right). Enrichment values are more comparable between ESCs and the germ layers, since we compare TF binding with the same number of poised enhancers (500) in each cell type. The results are consistent with Extended Data Fig. 8c, showing that the same factors are most enriched as when comparing to all poised enhancers.
e. Table of enrichment P values (−log10) in overlap between TF binding and regions with different chromatin state transitions (relative to ESCs) within each germ layer (dEN, top; dME, middle; dEC, bottom; see Supplementary Information). Possible epigenetic state transitions are shown on top and states are defined in legend on the top left. Globally, we find a much stronger enrichment for gain of H3K4me1 in dEN than in dME, particularly for the endoderm factors present at the most methylated H3K4me1 domains. Conversely, in dME we find a strong association between remodeling of H3K27Ac and the dME factors that reside at H3K27Ac genomic regions. In concordance with this global trend, GATA4 is associated with dynamics of H3K4me1 in dEN and H3K27Ac in dME.
f. Probability (y-axis) of the best match to a given motif (SMAD1 and GATA4) occurring at a given position at regions centered on SMAD1 binding in dME (top) and dEN (bottom). This probability is based only on regions that contain at least one match with score greater than the minimum score defined for this motif by Centrimo39. The position of the best GATA4 DNA binding sites (red) are more centrally enriched (P < 10−241, Centrimo39) at SMAD1 ChIP-seq peaks in dME (top) than in dEN (bottom).
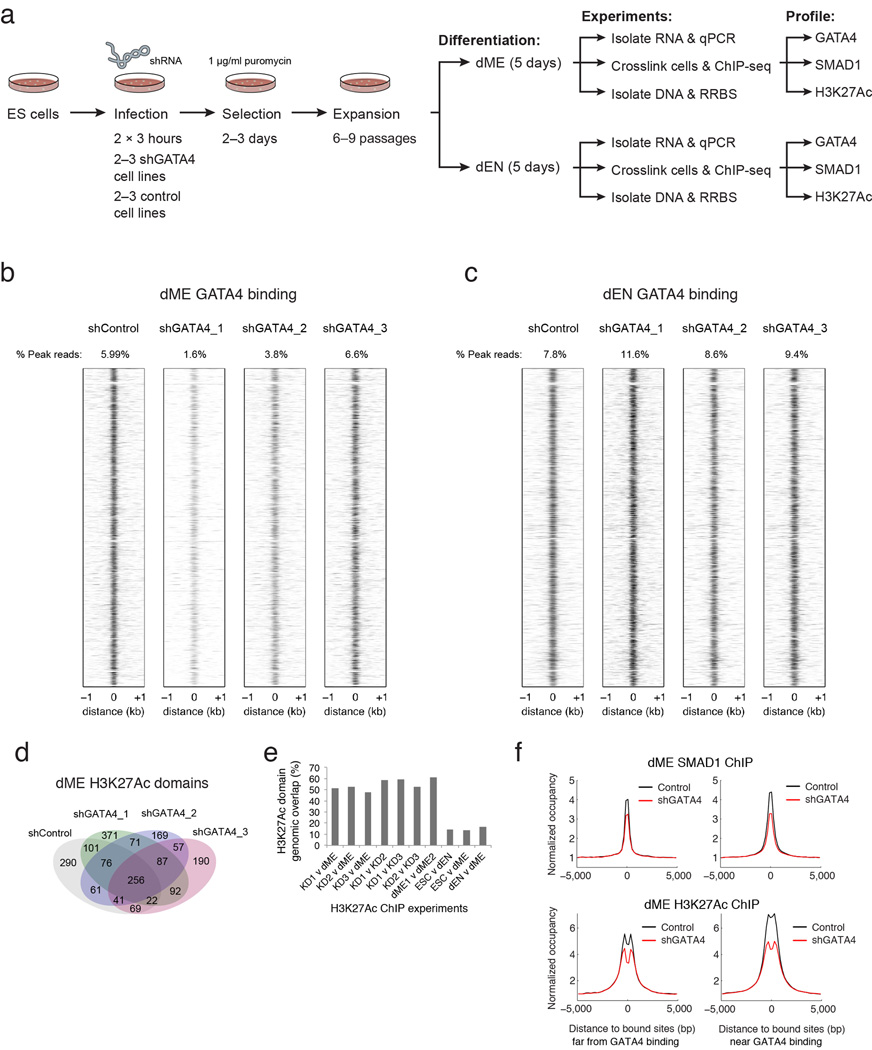
Extended Data Fig. 9. GATA4 knock down experiments in dEN and dME.
a. Experimental design and data collected for the GATA4 knock down (KD) and control experiments in dEN and dME (see Supplementary Information for details).
b. Heatmaps of GATA4 normalized occupancy at GATA4 targets (columns) in control and KD cell lines at corresponding genomic regions. GATA4 occupies very similar loci in control and KD cell lines in dME.
c. Heatmaps of GATA4 normalized occupancy at GATA4 targets (columns) in control and KD cell lines at corresponding genomic regions. GATA4 occupies very similar loci in control and KD cell lines in dEN.
d. Venn diagram of dME H3K27Ac super-enhancers detected using H3K27Ac data in shControl and 3 shGATA4 KD cell lines. Super-enhancers in the shGATA4 KD lines 1, 2, and 3 overlap with super-enhancers in the shControl cell line at a much higher rate than different cell types in Figure 4b.
e. Pairwise rate of overlap between super-enhancers detected using different H3K27Ac ChIP experiments. Super-enhancers in the shGATA4 KD lines 1, 2, and 3 overlap with super-enhancers in the shControl cell line at a rate of 51.6%, 52.7%, and 47.4% (left-most bars). In comparison, the KD replicates overlap with one another at a rate of 58.8%, 59.3%, and 52.3%, and wildtype dME replicates overlap at a rate of 61.2% (middle bars). The number of super-enhancers in common between different cell types ESC, dEN, and dME is 14.3%, 13.7%, and 16.7% (right-most bars). Percentages are calculated relative to the experiment with fewer super-enhancers detected.
f. Normalized SMAD1 (top) and H3K27Ac (bottom) mean occupancy is lower in dME for the shRNA KD lines versus control lines at SMAD1 sites both far from (distance > 1kb, left panel) and near (distance ≤ 1kb, right panel) from GATA4 binding (see Supplementary Information for details). The smaller decrease in occupancy away from GATA4 binding may be due to indirect effects, such as lower SMAD1 expression or co-binding with other unknown TFs.
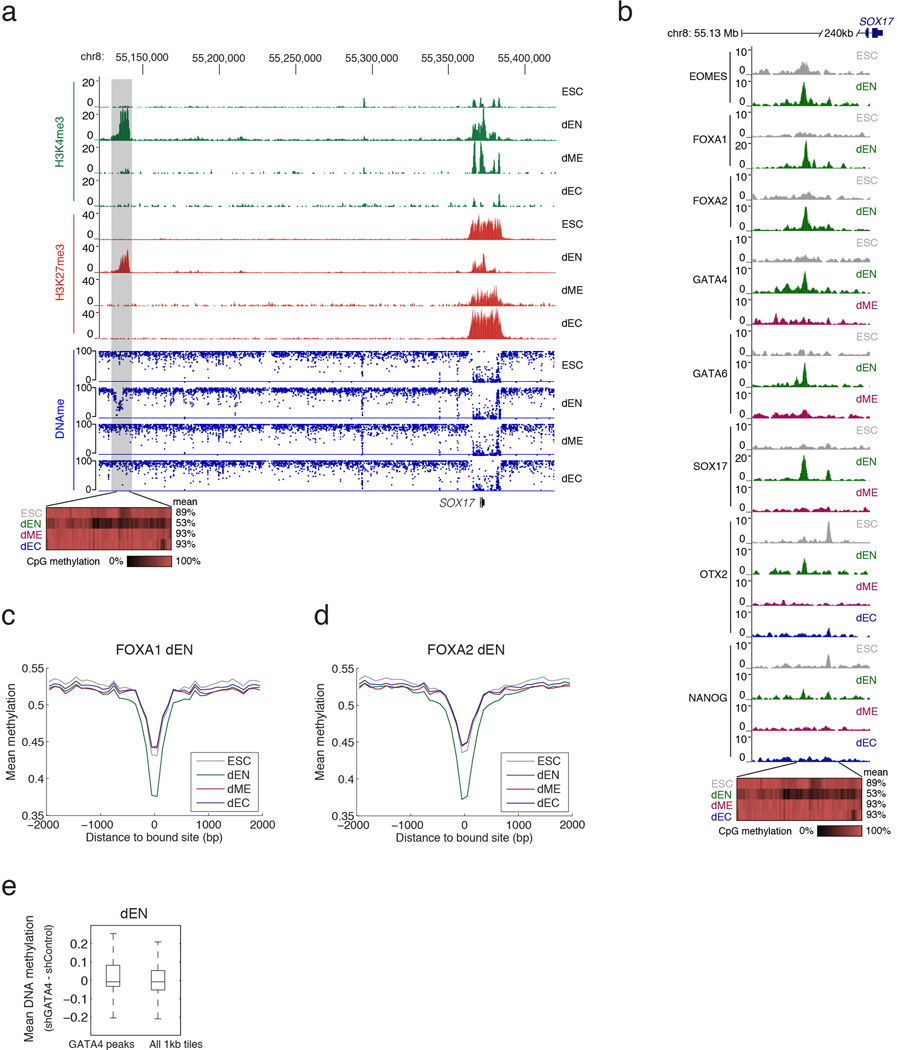
Extended Data Fig. 10. related to Fig. 6: TF binding associates with specific loss of DNA methylation in dEN.
a. Top: Genome browser tracks for H3K4me3 and H3K27me3 across four of the cell types over the SOX17 locus, zooming out on the region shown in Figure 6a. Bottom: Whole genome bisulfite sequencing (WGBS) based CpG methylation measurements. Specific loss of DNA methylation in dEN and associated chromatin remodeling to a poised state (H3K4me3 and H3K27me3) occurs 240kb upstream of SOX17, which coincides with loss of H3K27me3 and gain of H3K4me3 mark near the SOX17 gene.
b. Top: Genome browser tracks for selected TFs in different cell types upstream of SOX17. Bottom: Whole genome bisulfite sequencing (WGBS) based CpG methylation measurements, where each rectangle represents a single CpG. Specific loss of DNA methylation in dEN coincides with specific binding of several endoderm factors. OTX2 and NANOG also bind nearby this region in ESCs.
c. WGBS-based average CpG methylation level of 100bp tiles over FOXA1 bound dEN targets in ESCs and the three germ layers shows a specific depletion of DNA methylation in dEN.
d. WGBS-based average CpG methylation level of 100bp tiles over FOXA2 bound dEN targets in ESCs and the three germ layers shows a specific depletion of DNA methylation in dEN.
e. Distributions of mean DNA methylation difference in dEN between GATA4 KD and control cell lines at 1kb regions centered on dEN GATA4 targets (left, P < 10−10, paired t-test) and at all 1kb regions in the genome (right, P = 1, paired t-test).
Supplementary Material
Acknowledgements
We would like to thank all members of the Meissner laboratory for their support and feedback. We also thank Fontina Kelley and other members of the Broad Technology Labs and Sequencing Platform as well as John Doench and members of the Genome Perturbation Platform at the Broad Institute. We would like to thank Leslie Gaffney for graphical support. This work was supported by the NIH Common Fund (U01ES017155), NIGMS (P01GM099117) and the New York Stem Cell Foundation. A.T. was supported by the NRSA postdoctoral fellowship F32-DK095537. A.M. is a New York Stem Cell Foundation Robertson Investigator.
Footnotes
Accession number
All data have been deposited in GEO under GSE61475.
Author contributions
A.T. and A.M. designed and conceived the study. A.T. performed the experiments and all analysis, H.G. generated libraries with supervision from A.G., V.A. performed cell culture, M.J.Z. helped with data processing and analysis, J.D. performed experiments, I.A. provided experimental advice, A.T. and A.M. interpreted the data and wrote the manuscript.
Financial Disclosures
The authors declare no financial interests related to this study.
References
- 1.Boyer LA, et al. Core transcriptional regulatory circuitry in human embryonic stem cells. Cell. 2005;122:947–956. doi: 10.1016/j.cell.2005.08.020. [DOI] [PMC free article] [PubMed] [Google Scholar]
- 2.Young RA. Control of the embryonic stem cell state. Cell. 2011;144:940–954. doi: 10.1016/j.cell.2011.01.032. [DOI] [PMC free article] [PubMed] [Google Scholar]
- 3.Kunarso G, et al. Transposable elements have rewired the core regulatory network of human embryonic stem cells. Nature genetics. 2010;42:631–634. doi: 10.1038/ng.600. [DOI] [PubMed] [Google Scholar]
- 4.Villar D, Flicek P, Odom DT. Evolution of transcription factor binding in metazoans - mechanisms and functional implications. Nature reviews. Genetics. 2014;15:221–233. doi: 10.1038/nrg3481. [DOI] [PMC free article] [PubMed] [Google Scholar]
- 5.Smith ZD, Meissner A. DNA methylation: roles in mammalian development. Nature reviews. Genetics. 2013;14:204–220. doi: 10.1038/nrg3354. [DOI] [PubMed] [Google Scholar]
- 6.Cantone I, Fisher AG. Epigenetic programming and reprogramming during development. Nature structural & molecular biology. 2013;20:282–289. doi: 10.1038/nsmb.2489. [DOI] [PubMed] [Google Scholar]
- 7.Ziller MJ, et al. Charting a dynamic DNA methylation landscape of the human genome. Nature. 2013;500:477–481. doi: 10.1038/nature12433. [DOI] [PMC free article] [PubMed] [Google Scholar]
- 8.Stadler MB, et al. DNA-binding factors shape the mouse methylome at distal regulatory regions. Nature. 2011;480:490–495. doi: 10.1038/nature10716. [DOI] [PubMed] [Google Scholar]
- 9.Gifford CA, et al. Transcriptional and epigenetic dynamics during specification of human embryonic stem cells. Cell. 2013;153:1149–1163. doi: 10.1016/j.cell.2013.04.037. [DOI] [PMC free article] [PubMed] [Google Scholar]
- 10.Lara-Astiaso D, et al. Immunogenetics. Chromatin state dynamics during blood formation. Science. 2014;345:943–949. doi: 10.1126/science.1256271. [DOI] [PMC free article] [PubMed] [Google Scholar]
- 11.Teo AK, et al. Pluripotency factors regulate definitive endoderm specification through eomesodermin. Genes & development. 2011;25:238–250. doi: 10.1101/gad.607311. [DOI] [PMC free article] [PubMed] [Google Scholar]
- 12.Thomson M, et al. Pluripotency factors in embryonic stem cells regulate differentiation into germ layers. Cell. 2011;145:875–889. doi: 10.1016/j.cell.2011.05.017. [DOI] [PMC free article] [PubMed] [Google Scholar]
- 13.Lee G, Chambers SM, Tomishima MJ, Studer L. Derivation of neural crest cells from human pluripotent stem cells. Nat Protoc. 2010;5:688–701. doi: 10.1038/nprot.2010.35. [DOI] [PubMed] [Google Scholar]
- 14.Hay DC, et al. Highly efficient differentiation of hESCs to functional hepatic endoderm requires ActivinA and Wnt3a signaling. Proceedings of the National Academy of Sciences of the United States of America. 2008;105:12301–12306. doi: 10.1073/pnas.0806522105. [DOI] [PMC free article] [PubMed] [Google Scholar]
- 15.Evseenko D, et al. Mapping the first stages of mesoderm commitment during differentiation of human embryonic stem cells. Proceedings of the National Academy of Sciences of the United States of America. 2010;107:13742–13747. doi: 10.1073/pnas.1002077107. [DOI] [PMC free article] [PubMed] [Google Scholar]
- 16.Roadmap Epigenomics Consortium et al. Integrative analysis of 111 reference human epigenomes. Nature. 2015 doi: 10.1038/nature14248. in press. [DOI] [PMC free article] [PubMed] [Google Scholar]
- 17.Xie W, et al. Epigenomic analysis of multilineage differentiation of human embryonic stem cells. Cell. 2013;153:1134–1148. doi: 10.1016/j.cell.2013.04.022. [DOI] [PMC free article] [PubMed] [Google Scholar]
- 18.Henikoff JG, Belsky JA, Krassovsky K, MacAlpine DM, Henikoff S. Epigenome characterization at single base-pair resolution. Proceedings of the National Academy of Sciences of the United States of America. 2011;108:18318–18323. doi: 10.1073/pnas.1110731108. [DOI] [PMC free article] [PubMed] [Google Scholar]
- 19.Gerstein MB, et al. Architecture of the human regulatory network derived from ENCODE data. Nature. 2012;489:91–100. doi: 10.1038/nature11245. [DOI] [PMC free article] [PubMed] [Google Scholar]
- 20.Jolma A, et al. DNA-binding specificities of human transcription factors. Cell. 2013;152:327–339. doi: 10.1016/j.cell.2012.12.009. [DOI] [PubMed] [Google Scholar]
- 21.Harbison CT, et al. Transcriptional regulatory code of a eukaryotic genome. Nature. 2004;431:99–104. doi: 10.1038/nature02800. [DOI] [PMC free article] [PubMed] [Google Scholar]
- 22.Wang H, et al. Widespread plasticity in CTCF occupancy linked to DNA methylation. Genome research. 2012;22:1680–1688. doi: 10.1101/gr.136101.111. [DOI] [PMC free article] [PubMed] [Google Scholar]
- 23.Chambers SM, et al. Highly efficient neural conversion of human ES and iPS cells by dual inhibition of SMAD signaling. Nature biotechnology. 2009;27:275–280. doi: 10.1038/nbt.1529. [DOI] [PMC free article] [PubMed] [Google Scholar]
- 24.Hnisz D, et al. Super-enhancers in the control of cell identity and disease. Cell. 2013;155:934–947. doi: 10.1016/j.cell.2013.09.053. [DOI] [PMC free article] [PubMed] [Google Scholar]
- 25.Whyte WA, et al. Master transcription factors and mediator establish super-enhancers at key cell identity genes. Cell. 2013;153:307–319. doi: 10.1016/j.cell.2013.03.035. [DOI] [PMC free article] [PubMed] [Google Scholar]
- 26.Buecker C, et al. Reorganization of enhancer patterns in transition from naive to primed pluripotency. Cell stem cell. 2014;14:838–853. doi: 10.1016/j.stem.2014.04.003. [DOI] [PMC free article] [PubMed] [Google Scholar]
- 27.Pikkarainen S, Tokola H, Kerkela R, Ruskoaho H. GATA transcription factors in the developing and adult heart. Cardiovasc Res. 2004;63:196–207. doi: 10.1016/j.cardiores.2004.03.025. [DOI] [PubMed] [Google Scholar]
- 28.Vernay B, et al. Otx2 regulates subtype specification and neurogenesis in the midbrain. J Neurosci. 2005;25:4856–4867. doi: 10.1523/JNEUROSCI.5158-04.2005. [DOI] [PMC free article] [PubMed] [Google Scholar]
- 29.Rada-Iglesias A, et al. A unique chromatin signature uncovers early developmental enhancers in humans. Nature. 2011;470:279–283. doi: 10.1038/nature09692. [DOI] [PMC free article] [PubMed] [Google Scholar]
- 30.Zaret KS. Genetic programming of liver and pancreas progenitors: lessons for stem-cell differentiation. Nature reviews. Genetics. 2008;9:329–340. doi: 10.1038/nrg2318. [DOI] [PubMed] [Google Scholar]
- 31.Pouponnot C, Jayaraman L, Massague J. Physical and functional interaction of SMADs and p300/CBP. J Biol Chem. 1998;273:22865–22868. doi: 10.1074/jbc.273.36.22865. [DOI] [PubMed] [Google Scholar]
- 32.Meissner A, et al. Genome-scale DNA methylation maps of pluripotent and differentiated cells. Nature. 2008;454:766–770. doi: 10.1038/nature07107. doi: nature07107 [pii] 10.1038/nature07107. [DOI] [PMC free article] [PubMed] [Google Scholar]
- 33.Zaret KS, Carroll JS. Pioneer transcription factors: establishing competence for gene expression. Genes & development. 2011;25:2227–2241. doi: 10.1101/gad.176826.111. [DOI] [PMC free article] [PubMed] [Google Scholar]
- 34.Novershtern N, et al. Densely interconnected transcriptional circuits control cell states in human hematopoiesis. Cell. 144:296–309. doi: 10.1016/j.cell.2011.01.004. doi:S0092-8674(11)00005-5 [pii] 10.1016/j.cell.2011.01.004. [DOI] [PMC free article] [PubMed] [Google Scholar]
- 35.Li H, Durbin R. Fast and accurate short read alignment with Burrows-Wheeler transform. Bioinformatics. 2009;25:1754–1760. doi: 10.1093/bioinformatics/btp324. [DOI] [PMC free article] [PubMed] [Google Scholar]
- 36.Zhang Y, et al. Model-based analysis of ChIP-Seq (MACS) Genome Biol. 2008;9:R137. doi: 10.1186/gb-2008-9-9-r137. [DOI] [PMC free article] [PubMed] [Google Scholar]
- 37.Pickrell JK, Gaffney DJ, Gilad Y, Pritchard JK. False positive peaks in ChIP-seq and other sequencing-based functional assays caused by unannotated high copy number regions. Bioinformatics. 2011;27:2144–2146. doi: 10.1093/bioinformatics/btr354. [DOI] [PMC free article] [PubMed] [Google Scholar]
- 38.Heinz S, et al. Simple combinations of lineage-determining transcription factors prime cis-regulatory elements required for macrophage and B cell identities. Mol Cell. 2010;38:576–589. doi: 10.1016/j.molcel.2010.05.004. [DOI] [PMC free article] [PubMed] [Google Scholar]
- 39.Bailey TL, Machanick P. Inferring direct DNA binding from ChIP-seq. Nucleic acids research. 2012;40:e128. doi: 10.1093/nar/gks433. [DOI] [PMC free article] [PubMed] [Google Scholar]
- 40.Bailey TL, Elkan C. Fitting a mixture model by expectation maximization to discover motifs in biopolymers. Proceedings / … International Conference on Intelligent Systems for Molecular Biology; ISMB. International Conference on Intelligent Systems for Molecular Biology. 1994;2:28–36. [PubMed] [Google Scholar]
- 41.Mikkelsen TS, et al. Comparative epigenomic analysis of murine and human adipogenesis. Cell. 2010;143:156–169. doi: 10.1016/j.cell.2010.09.006. [DOI] [PMC free article] [PubMed] [Google Scholar]
- 42.Bao Y, Vinciotti V, Wit E, t Hoen PA. Accounting for immunoprecipitation efficiencies in the statistical analysis of ChIP-seq data. BMC Bioinformatics. 2013;14:169. doi: 10.1186/1471-2105-14-169. [DOI] [PMC free article] [PubMed] [Google Scholar]
- 43.Pauklin S, Vallier L. The cell-cycle state of stem cells determines cell fate propensity. Cell. 2013;155:135–147. doi: 10.1016/j.cell.2013.08.031. [DOI] [PMC free article] [PubMed] [Google Scholar]
- 44.Neph S, et al. An expansive human regulatory lexicon encoded in transcription factor footprints. Nature. 2012;489:83–90. doi: 10.1038/nature11212. [DOI] [PMC free article] [PubMed] [Google Scholar]
- 45.You JS, et al. OCT4 establishes and maintains nucleosome-depleted regions that provide additional layers of epigenetic regulation of its target genes. Proceedings of the National Academy of Sciences of the United States of America. 2011;108:14497–14502. doi: 10.1073/pnas.1111309108. [DOI] [PMC free article] [PubMed] [Google Scholar]
- 46.Mullen AC, et al. Master transcription factors determine cell-type-specific responses to TGF-beta signaling. Cell. 2011;147:565–576. doi: 10.1016/j.cell.2011.08.050. [DOI] [PMC free article] [PubMed] [Google Scholar]
- 47.Morsli H, et al. Otx1 and Otx2 activities are required for the normal development of the mouse inner ear. Development. 1999;126:2335–2343. doi: 10.1242/dev.126.11.2335. [DOI] [PubMed] [Google Scholar]
- 48.Greber B, et al. FGF signalling inhibits neural induction in human embryonic stem cells. EMBO J. 2011;30:4874–4884. doi: 10.1038/emboj.2011.407. [DOI] [PMC free article] [PubMed] [Google Scholar]
- 49.Perez-Losada J, et al. Zinc-finger transcription factor Slug contributes to the function of the stem cell factor c-kit signaling pathway. Blood. 2002;100:1274–1286. [PubMed] [Google Scholar]
Associated Data
This section collects any data citations, data availability statements, or supplementary materials included in this article.


