Abstract
AIM: To investigate the therapeutic effects of lutein against non-alcoholic fatty liver disease (NAFLD) and the related underlying mechanism.
METHODS: After 9 d of acclimation to a constant temperature-controlled room (20 °C-22 °C) under 12 h light/dark cycles, male Sprague-Darley rats were randomly divided into two groups and fed a standard commercial diet (n = 8) or a high-fat diet (HFD) (n = 32) for 10 d. Animals receiving HFD were then randomly divided into 4 groups and administered with 0, 12.5, 25, or 50 mg/kg (body weight) per day of lutein for the next 45 d. At the end of the experiment, the perinephric and abdominal adipose tissues of the rats were isolated and weighed. Additionally, serum and liver lipid metabolic condition parameters were measured, and liver function and insulin resistance state indexes were assessed. Liver samples were collected and stained with hematoxylin eosin and Oil Red O, and the expression of the key factors related to insulin signaling and lipid metabolism in the liver were detected using Western blot and real-time polymerase chain reaction analyses.
RESULTS: Our data showed that after being fed a high-fat diet for 10 d, the rats showed a significant gain in body weight, energy efficiency, and serum total cholesterol (TC) and triglyceride (TG) levels. Lutein supplementation induced fat loss in rats fed a high-fat diet, without influencing body weight or energy efficiency, and decreased serum TC and hepatic TC and TG levels. Moreover, lutein supplementation decreased hepatic levels of lipid accumulation and glutamic pyruvic transaminase content, and also improved insulin sensitivity. Lutein administration also increased the expression of key factors in hepatic insulin signaling, such as insulin receptor substrate-2, phosphatidylinositol 3-kinase, and glucose transporter-2 at the gene and protein levels. Furthermore, high-dose lutein increased the expression of peroxisome proliferators activated receptor-α and sirtuin 1, which are associated with lipid metabolism and insulin signaling.
CONCLUSION: These results demonstrate that lutein has positive effects on NAFLD via the modulation of hepatic lipid accumulation and insulin resistance.
Keywords: Lutein, Non-alcoholic fatty liver disease, Insulin resistance, Sirtuin 1, Peroxisome proliferators activated receptor-α
Core tip: Lutein has potential positive effects on chronic diseases. To date, no previous studies have reported the regulatory effects of lutein on non-alcoholic fatty liver disease (NAFLD). We observed that lutein has positive effects on hepatic lipid accumulation, liver function, and insulin resistance induced by a high-fat diet, possibly via activation of the expression of sirtuin 1 and, subsequently, peroxisome proliferators activated receptor-α, and other key factors in insulin signaling. These findings provide a new prospect for preventing NAFLD.
INTRODUCTION
Non-alcoholic fatty liver disease (NAFLD) is a progressive pathological change in chronic liver diseases caused by a disturbance in lipid metabolism[1]. It is the most common type of chronic liver disease in the majority of developed countries[2], possibly due to changes in dietary habits and the increase in sedentary lifestyles[3]. With the spread of the Western lifestyle in developing countries, NAFLD is beginning to affect more people[3]. In Shanghai, Guangdong, and Hong Kong (China), the prevalence of NAFLD has been reported to be 17%, 15%, and 16%, respectively[4]. Therefore, it is important to find effective measures for the control of NAFLD.
The protective effects of phytochemicals on chronic diseases have received much attention from the scientific community in recent decades. Lutein is one of hundreds of known naturally oxygenated carotenoids, and is abundantly present in vegetables, fruits, and egg yolks. Lutein consists of a carbon chain with nine conjugated dienes and a hydroxylated cyclic hexenyl structure at each side; owing to its special chemical structure, it has potential antioxidant properties. Over a long period of time, lutein, as one of the major pigments in the macula lutea on the retina, was found to play a key role in preserving visual performance because of its strong blue light filtering ability[5]. Recently, lutein has drawn increasing attention to its function in chronic diseases other than oculopathy.
The disturbance of lipid metabolism and insulin resistance has an important role in the pathophysiology of NAFLD[1]. While exploring the relationship between serum lutein levels and lipid metabolism, some epidemiological studies found that serum high-density lipoprotein-cholesterol (HDL-C) was positively-associated with serum lutein levels[6]. Changes in oxidized low density lipoprotein (oxLDL) levels were inversely correlated with plasma lutein[7], and an increase in BMI among the population was significantly associated with low levels of serum lutein[8]. Insulin resistance was also found to be inversely related to serum lutein levels[9-11]. To date, there have been very few reports regarding the mechanism and effects of lutein on NAFLD, or on the risk factors of NAFLD. A limited number of researchers have suggested that lutein supplementation may resolve oxidative stress by reducing oxLDL, and that aortic malondialdehyde (MDA) levels were induced by a high-fat diet (HFD) in guinea pigs[12], as well as decreased TG values in wild-type mice[13]. Therefore, it is critical to explore the mechanism of lutein in NAFLD.
Sirtuin 1 (SIRT1) is reported to have therapeutic potential in NAFLD and play a key role in insulin sensitivity[14]. SIRT1 regulates the expression of peroxisome proliferators activated receptor (PPAR)-α, a key factor in the regulation of lipid metabolism[15,16]. However, to our knowledge, there are few studies regarding the effect of lutein supplements on SIRT1 and PPAR-α.
Based on these findings, we established an NAFLD model in rats fed a HFD[17] and supplied them with different doses of lutein, with the aim to explore the effect of lutein supplementation on NAFLD and to investigate the involved mechanisms.
MATERIALS AND METHODS
Animal treatment protocol
Forty male Sprague-Dawley rats (100 ± 20 g), obtained from Sino-British SIPPK/BK lab, Animal Co., Ltd (Shanghai, China), were maintained in a constant temperature-controlled room (20 °C-22 °C) with controlled lighting (12 h light/dark cycles). The animals were cared for according to the guiding principles in the Care and Use of Animals. All experiments were approved by the Tongji Medical College Council’s Animal Care Committee. Animals were randomly divided into two groups after acclimation for 9 d. Then, one group was fed a normal diet (ND) (n = 8), while the other group was fed a HFD (n = 32) for 10 d to induce lipid metabolism disturbance. The ND was prepared based on the American Institute of Nutrition-93G (AIN-93G) diet[18], while the HFD consisted of 52.5% standard diet, 20% sucrose, 15% lard, 9.5% casein, 1.7% calcium hydrogen phosphate, 1.1% cholesterol, and 0.2% sodium cholate. The composition of each diet is presented in Table 1. On the 10th day, serum lipid levels were tested after an 8-h fast using blood samples collected via the tail tip. The rats fed the HFD were then divided into 4 groups based on total cholesterol and administered 0, 12.5, 25, or 50 mg/kg (body weight) per day lutein [gifted from InnoBio CO (Dalian, China)]. Lutein was suspended in double distilled water. All animals were administered lutein suspension or water daily via gavage for the next 45 d. Food intake was recorded every day and body weight was monitored every three days. Energy efficiency was calculated as weight gain (g) divided by energy intake (kcal) during the feeding period[19].
Table 1.
Composition of the experimental diets used in this study (g/kg)
|
Experimental diet |
||
| Normal diet | High-fat diet | |
| Carbohydrate (% of energy) | 69.86 | 48.45 |
| Protein (% of energy) | 21.76 | 17.91 |
| Fat (% of energy) | 8.38 | 33.64 |
| Energy (kcal/100 g) | 377.19 | 450.52 |
| Ingredient (g/kg) | ||
| Cornstarch | 397.5 | 208.7 |
| Casein | 200.0 | 200.0 |
| Dextrose | 132.0 | 69.3 |
| Sucrose | 100.0 | 252.5 |
| Soybean oil | 70.0 | 36.8 |
| Fiber | 50.0 | 26.2 |
| Mineral mix1 | 35.0 | 18.4 |
| Vitamin mix1 | 10.0 | 5.3 |
| L-Cystine | 3.0 | 1.6 |
| Choline bitartrate | 2.5 | 1.3 |
| Lard | 0.0 | 150.0 |
| Cholesterol | 0.0 | 11.0 |
| Calcium hydrogen phosphate | 0.0 | 17.0 |
| Sodium cholate | 0.0 | 2.0 |
| Total | 1000 | 1000 |
Based on the AIN-93G vitamin and mineral mixes.
At the end of experiment, rats were sacrificed by decapitation. Perinephric and abdominal adipose tissues were isolated and weighed. Serum and liver samples were collected and stored at -80 °C for further use.
Assessment of lipid metabolic condition in liver and serum
Liver samples were homogenized with 9 volumes of isopropanol. After incubation at 4 °C for 48 h and centrifugation at 3000 rpm for 15 min at 4 °C, the supernatant was carefully collected for analysis. TC, TG, HDL-C, and LDL-C were measured using the appropriate kit (Biosino Bio-technology and Science Inc., Beijing, China) in an ELX800 microplate reader (Bio-Tek). All procedures were performed according to the manufacturer’s instructions.
Measurement of serum biomarkers for liver function
Serum glutamic pyruvic transaminase (GPT) was measured using a kit (Mindray, Shenzhen, China) and read in a Mindray BS-200 automatic biochemistry analyzer (Shenzhen, China). The results are expressed as units per liter (U/L).
Lipids deposition in liver
Fresh samples from the same location of the liver were divided into two parts. One part was frozen and stained with Oil Red O. The other part was fixed in 4% paraformaldehyde, embedded in paraffin, and stained with hematoxylin and eosin (H&E) and examined by microscopy. Quantification of lipid droplets (area fraction) measured by Oil Red O staining in every group was calculated using Image-Pro Plus 6.0 software.
Determination of fasting glucose and insulin
Fasting glucose was determined directly by glucometer (Abbott Diabetes Care Ltd) when the animals were sacrificed. Fasting insulin was measured using an insulin ELIZA kit (R&D system, United States), following the manufacturer’s instructions. HOMA-IR = FIN × FPG/22.5, HOMA-β = 20 × FIN/(FPG-3.5).
Real-time polymerase chain reaction analysis
Total RNA was extracted from the liver using TRIzol® reagent (Invitrogen, Carlsbad, CA, United States). To quantify the expression of messenger RNA (mRNA), a SYBR green-based qRT-PCR kit (TaKaRa BIO Inc., Dalian) was used according to the manufacturer’s instructions in a 7900HT instrument (Applied Biosystems, Forster, CA, United States). The specificity of the product was assessed from melting curve analysis. Gene expression was determined using the 2-ΔΔCt method. Gene expression of insulin receptor substrate-2 (IRS2) (NM_001168633.1), phosphatidylinositol 3-kinase (PI3K, NM_013005.1), and glucose transporter-2 (GLUT2) (NM_012879.2) was presented as fold change relative to the normal control and normalized to β-actin (NM_031144.3). The following forward and reverse primers were used: IRS2, 5’-GGA GCT CTG TTA GCA CCG TT-3’ and 5’-TCC AGT TCC GAG CTT GAG TG-3’, PI3K, 5’-AGG AGC GGT ACA GCA AAG AC-3’ and 5’-CTG CTG TCG ATG ATC TCG CT-3’, GLUT2, 5’-ACC AGC ACA TAC GAC ACC AG-3’ and 5’-ACC ATT CCG CCT ACT GCA AA-3’, and β-actin, 5’-CCC GCG AGT ACA ACC TTC TT-3’ and 5’-CGC AGC GAT ATC GTC ATC CA-3’.
Western blotting
The liver tissue was homogenized and lysed in RIPA Lysis Buffer (1% Triton X-100, 1% deoxycholate, 0.1% SDS). Lysates containing equal protein amounts were separated by 10% SDS-PAGE and transferred onto polyvinylidene difluoride membranes. After blocking, the membranes were incubated with one of the following primary antibodies overnight at 4 °C: IRS2 (Cell Signaling Technology; Cat. No. 3089), PI3K-P85 (Cell Signaling Technology; Cat. No. 4257), GLUT2 (Santa Cruz Biotechnology, Inc.; Cat. No. sc-9117), PPAR-α (abcam; Cat. No. ab8934), SIRT1 (Santa Cruz Biotechnology, Inc.; Cat. No. sc-15404), or β-actin (Sigma; Cat. No. A1978). The membranes were then incubated with secondary antibodies conjugated to horse-radish peroxidase. Immunoreactive bands were detected by means of an ECL plus Western Blotting Detection System (Amersham Biosciences, Little Chalford, United States), and the band densities were measured using Gel Pro 3.0 software (Biometra, Goettingen, Germany). β-actin served as an internal control protein.
Statistical analysis
All data are expressed as the mean ± SD. Statistical analyses of the data were performed using the SPSS 12.0 software package (SN: 59245 46841 40655 89389 09859 21671 21957 29589 12). The statistical significance of differences among groups was determined by one-way analysis of variance, followed by Student-Newman-Keuls multiple range test to determine the statistical significance between the two groups. The results were considered statistically significant at P < 0.05.
RESULTS
HFD increased body weight, energy efficiency, and serum TC and TG levels
After acclimation for 9 d, the weights of the ND and HFD rats increased to 201 g and 199 g (Table 2). The rats in the two groups were then fed a ND or HFD for 10 d, and the weights increased to 254 g and 262 g, respectively (Table 2). The administration of the HFD for 10 d caused significant elevations in weight (P < 0.01), energy efficiency (P < 0.05), and serum TC (P < 0.01) and TG (P < 0.01) levels compared to the control group (Figure 1). After dividing into 4 groups, there was no significant difference in TG (Figure 2).
Table 2.
Body weight of rats at different time points
| Group |
Weight (g) |
|
| 9 d | 19 d | |
| ND | 201 ± 7.05 | 254 ± 8.90 |
| HFD | 199 ± 7.59 | 262 ± 15.09 |
Values represent the mean ± SD. After 9 d of acclimation, the rats were randomly divided into the normal diet (ND) (n = 8) and high-fat diet (HFD) (n = 32) groups. The rats in the HFD group were then fed a high-fat diet for 10 d.
Figure 1.
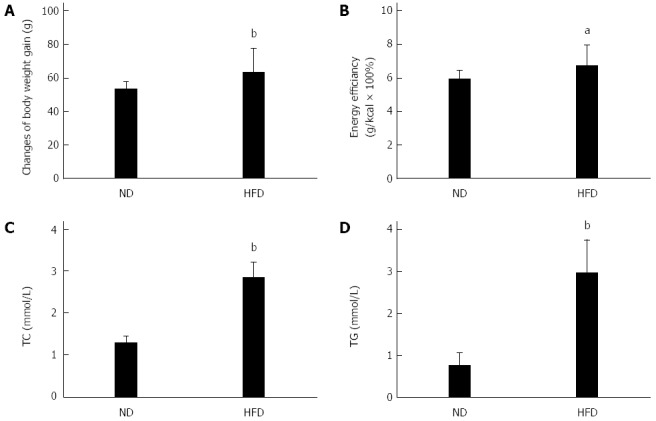
Changes in the basic physiological and biochemical responses of rats fed a high-fat diet. The normal diet (ND) group (n = 8) was fed a standard diet and the high fat diet (HFD) group (n = 32) was fed a HFD for 10 d. The basic indicators included changes in body weight gain (A), energy efficiency (B), serum total cholesterol (TC) (C), and triglyceride (TG) (D). aP < 0.05, bP < 0.01 vs ND group.
Figure 2.
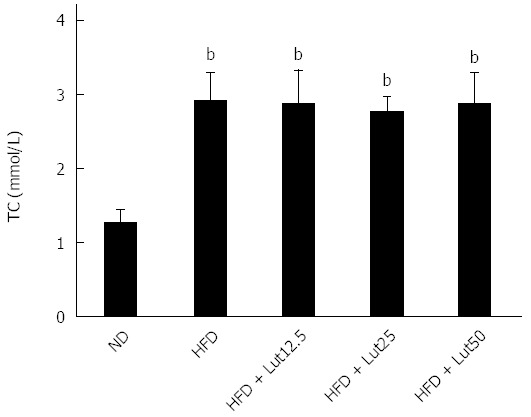
Levels of total cholesterol in rats divided into 4 groups. Rats were fed with normal diet or a high fat diet for 10 d, and then the high fat diet (HFD)-fed rats were divided randomly into four groups based on total cholesterol. Data are expressed as the mean ± SD (n = 8). bP < 0.01 vs the normal diet (ND) group.
Effect of lutein supplementation on body weight, energy efficiency, and adiposity in rats fed a HFD
After treating with lutein for 45 d, no significant difference was observed in body weight gain or energy efficiency compared with rats feed a HFD (Figure 3A and B), but perinephric fat did decrease notably in the HFD + Lut12.5 group (P < 0.05; Figure 3C) and abdominal fat was reduced significantly after treatment with any dose of lutein (P < 0.01 for 12.5 and 50 mg/kg, P < 0.05 for 25 mg/kg; Figure 3D).
Figure 3.
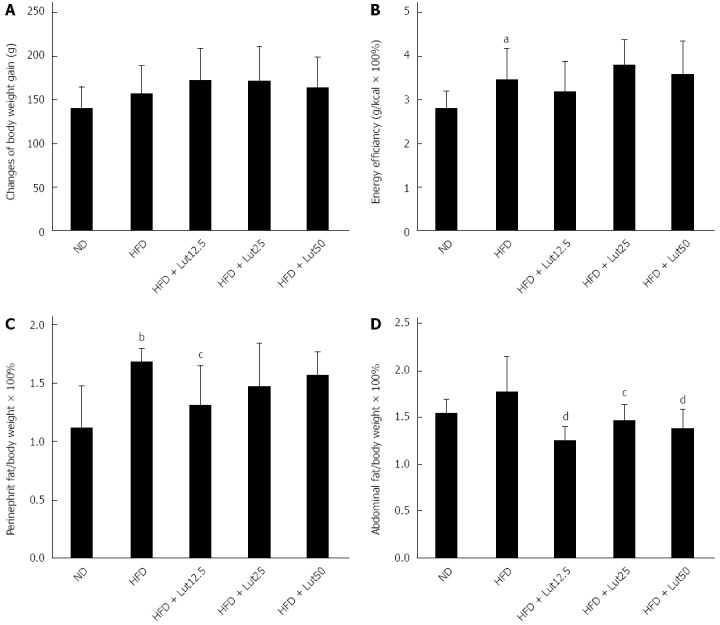
Effects of lutein on rats fed a high-fat diet. After being stratified into 4 groups based on total cholesterol, the rats were fed a high fat diet (HFD) plus 0, 12.5, 25, or 50 mg/kg body weight/d lutein for 45 d. Factors including body weight (A), energy efficiency (B), perinephric fat index (C), and abdominal fat index (D) were examined. Data are expressed as the mean ± SD (n = 8). aP < 0.05, bP < 0.01 vs normal diet (ND) group, cP < 0.05, dP < 0.01 vs HFD group.
Effect of lutein supplementation on lipid metabolism and liver function
To evaluate the beneficial effect of lutein on lipid metabolism and liver function, the related indices were assessed. The level of TC in the ND group was 1.01 mmol/L and 1.88 mmol/L in the HFD group, which was significantly higher (P < 0.01; Table 3). However, in the HFD + Lut25 group, the level of TC only reached 1.53 mmol/L, which was a significant decrease from 1.88 mmol/L (P < 0.01; Table 3). Lutein supplementation had a similar effect on hepatic TG (Table 3). HFD feeding induced significant elevations in hepatic TC levels, but down-regulated serum HDL-C levels (P < 0.01; Table 3). These alterations were significantly ameliorated by lutein administration (serum HDL-C, P < 0.01 for 12.5 and 25 mg/kg; hepatic TC, P < 0.05 for 50 mg/kg; Table 3). Similarly, lutein supplementation effectively reversed the increased serum GPT levels caused by the HFD (P < 0.01; Figure 4).
Table 3.
Effects of lutein on lipid metabolism in rats fed a high fat diet
| Group |
Serum (mmol/L) |
Liver (μmol/g) |
||||
| TC | TG | LDL-C | HDL-C | TC | TG | |
| ND | 1.01 ± 0.15 | 0.55 ± 0.16 | 0.184 ± 0.134 | 0.80 ± 0.09 | 0.93 ± 0.06 | 2.14 ± 0.44 |
| HFD | 1.88 ± 0.25b | 0.57 ± 0.17 | 0.566 ± 0.350a | 0.59 ± 0.15b | 1.65 ± 0.13b | 8.28 ± 1.40b |
| HFD + Lut12.5 | 1.95 ± 0.25 | 0.45 ± 0.11 | 0.515 ± 0.487 | 0.88 ± 0.11d | 1.74 ± 0.10 | 7.09 ± 1.00c |
| HFD + Lut25 | 1.53 ± 0.23d | 0.51 ± 0.12 | 0.305 ± 0.224 | 0.80 ± 0.17d | 1.66 ± 0.15 | 6.41 ± 0.97d |
| HFD + Lut50 | 1.98 ± 0.24 | 0.45 ± 0.11 | 0.712 ± 0.342 | 0.70 ± 0.11 | 1.53 ± 0.08c | 7.27 ± 1.14 |
Values represent the mean ± SD of n = 8 rats/group. Rats in the normal diet (ND) group were supplied with a standard diet for 55 d. Rats in the high fat diet (HFD) group were fed a high fat diet for 10 d first, and then fed a high fat diet plus 0, 12.5, 25, or 50 mg/kg (body weight)/d lutein for 45 d.
P < 0.01 vs ND group,
P < 0.05,
P < 0.01 vs HFD group. TC: Total cholesterol; TG: Triglyceride; LDL-C: Low density lipoprotein-cholesterol; HDL-C: High density lipoprotein-cholesterol.
Figure 4.
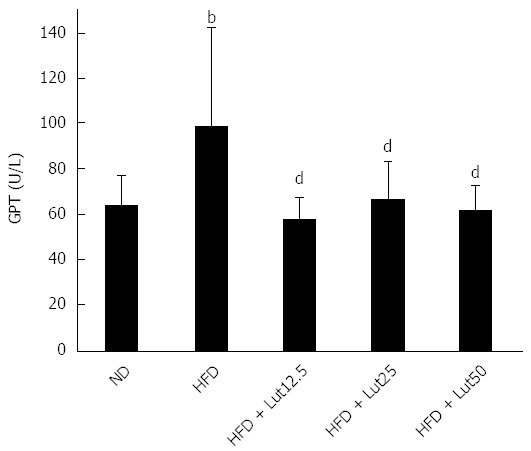
Lutein influences glutamic pyruvic transaminase in rats fed a high-fat diet. Rats were fed a high fat diet (HFD), except for the normal diet (ND) group, and lutein was administrated at doses of 12.5, 25, or 50 mg/kg body weight/d on the 10th day. Data are expressed as the mean ± SD (n = 8). aP < 0.05 vs the ND group, cP < 0.05, compared to the HFD group. bP < 0.01 vs ND group, dP < 0.01 vs HFD group.
Finally, we used H&E and Oil Red O staining of the hepatic tissues to evaluate the extent of fat accumulation. As expected, HFD feeding resulted in severe hepatic lipid accumulation, characterized by an increase in the number and size of accumulated fat droplets in the hepatocytes, while lutein supplementation mitigated hepatic steatosis, especially at medium and high doses (P < 0.01; Figure 5).
Figure 5.
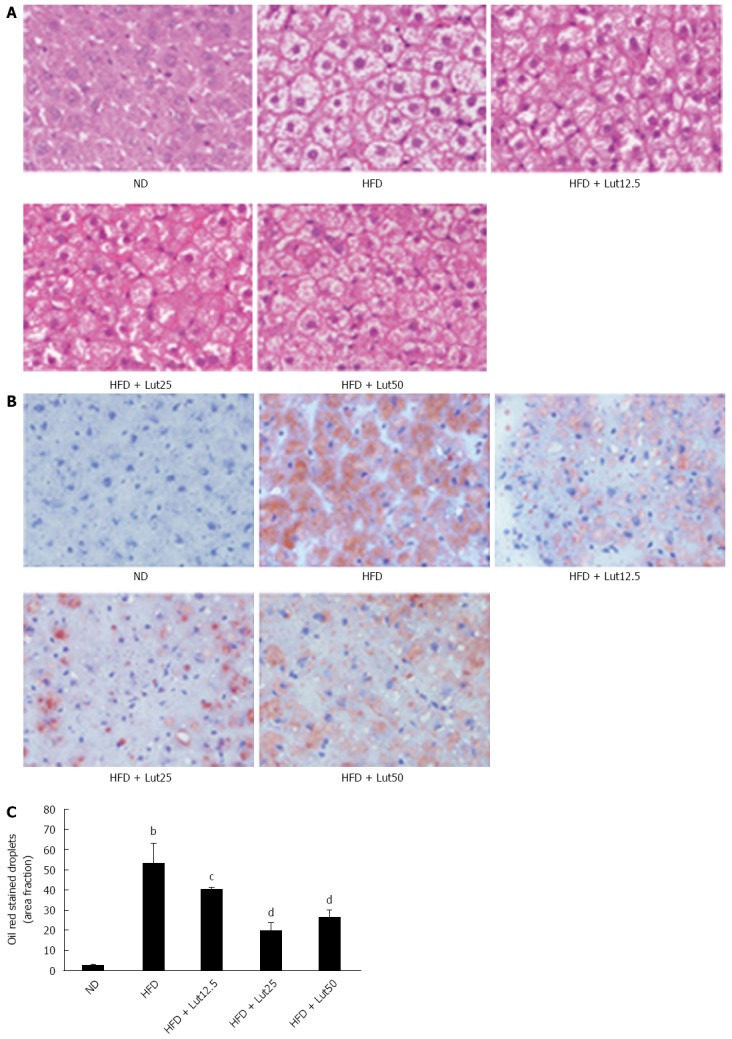
Lutein prevented hepatic lipid accumulation in rats fed with high-fat diet. Hematoxylin and eosin (H&E) stain (A) and Oil Red O stain (B) of liver sections are shown. Original magnification × 400. Quantitative analysis of hepatic fat accumulation is shown (C). Data are normalized to % of field area and represent the mean ± SD. bP < 0.01 vs the normal diet (ND) group, cP < 0.05, dP < 0.01 vs the high fat diet (HFD) group (n = 3).
Lutein improved insulin sensitivity in rats fed a HFD
To elucidate the regulatory effect of lutein on insulin sensitivity, we detected the levels of fasting blood glucose and fasting insulin. We found remarkable increases in fasting blood glucose (P < 0.01) and insulin (P < 0.05) in the HFD group compared to the ND group. These elevations were significantly ameliorated by lutein treatment (glucose, P < 0.05 for 12.5 and 50 mg/kg, P < 0.01 for 25 mg/kg; insulin, P < 0.05 for 25 and 50 mg/kg, respectively). The HOMA indexes showed that the HFD caused remarkable up-regulation of HOMA-IR (P < 0.01) and partly down-regulated HOMA-β compared to the ND group, while lutein supplementation efficiently attenuated these changes (P < 0.01 for 12.5, 25, and 50 mg/kg in HOMA-IR; P < 0.05 for 25 mg/kg in HOMA-β; Figure 6).
Figure 6.
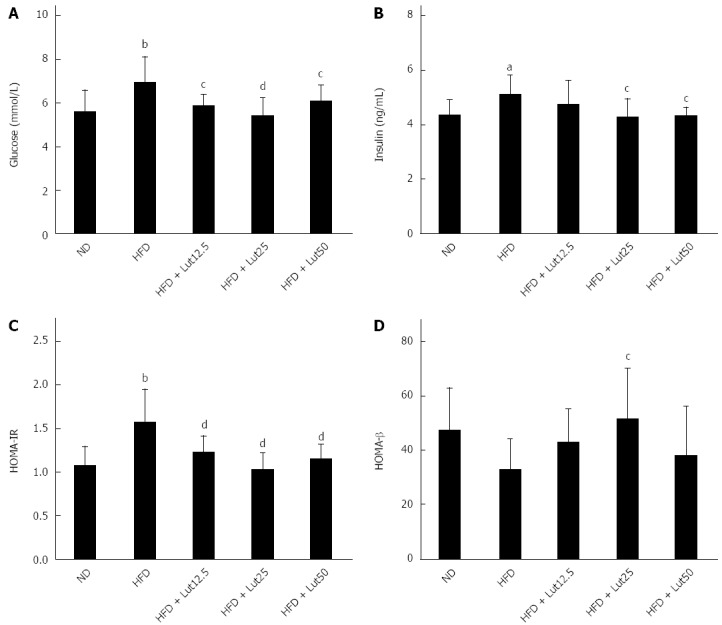
Lutein’s effect on fasting glucose (A), fasting insulin (B), HOMA-IR (C), and HOMA-β (D) in rats fed a high-fat diet. After the 45-d lutein intervention, fasting glucose was tested as described and fasting insulin was measured using an insulin ELIZA kit following the manufacturer’s instructions. HOMA-IR = FIN × FPG/22.5, HOMA-β = 20 × FIN/(FPG-3.5). aP < 0.05, bP < 0.01 vs the normal diet (ND) group, cP < 0.05, dP < 0.01 vs high-fat diet (HFD) group. Data are expressed as the mean ± SD (n = 8).
Effects of lutein on mRNA abundance and protein content of hepatic IRS2, PI3K, and GLUT2 in rats fed a HFD
Insulin regulates glucose homeostasis in the liver through binding with its receptor, resulting in tyrosine phosphorylation of IRS2 and activation of PI3K and GLUT2[20]. To explore the effect of lutein on insulin signaling, we detected the expressions of IRS2, PI3K, and GLUT2 in the rat liver. As shown in Figure 7, the mRNA and protein expression of the key factors in insulin signaling were down-regulated markedly by HFD feeding (P < 0.05; Figure 7). After being supplied with lutein for 45 d, mRNA and protein expression were up-regulated, significantly so for PI3K and GLUT2 (P < 0.05; Figure 7B and C), indicating increased insulin sensitivity.
Figure 7.
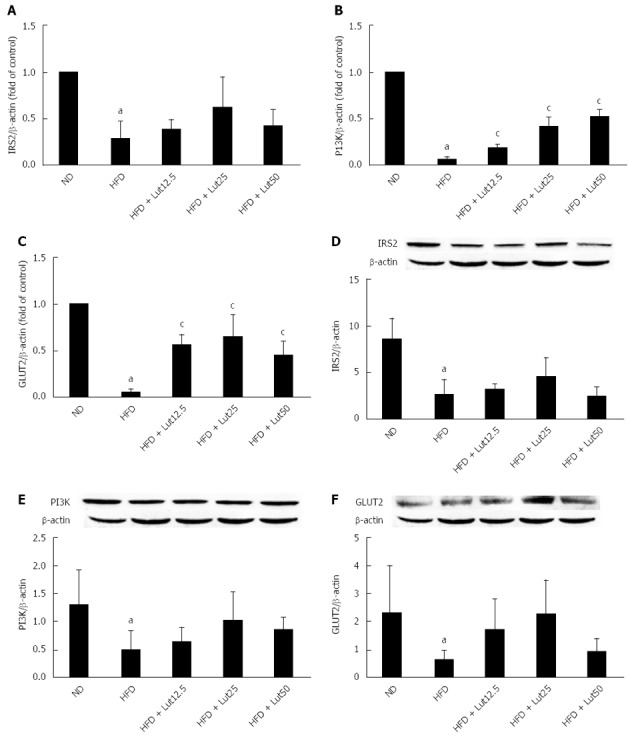
Lutein supplementation improved insulin signaling in rat liver. Effects of lutein on the mRNA expression of IRS2 (A), PI3K (B), and GLUT2 (C) in rat liver (n = 4). Total RNA was extracted from rat livers using TRIzol. IRS2, PI3K, and GLUT2 expression was analyzed by Real-Time RT-PCR. β-actin mRNA was quantified as an endogenous control. IRS2, PI3K, and GLUT2 are presented as fold changes relative to the control. Effect of lutein on the protein expression of hepatic IRS2 (D), PI3K (E), and GLUT2 (F) in rats (n = 3). After the rats were treated with lutein for 45 d, hepatic lysates were prepared and immunoblotted with corresponding antibodies. Blotting with anti β-actin was used as a protein loading control. Data are expressed as the mean ± SD. aP < 0.05 vs normal diet (ND) group; cP < 0.05 vs the high-fat diet (HFD) group.
Effects of lutein on protein content of hepatic PPAR-α and SIRT1 in rats fed a HFD
To further explore the underlying mechanisms of lutein in lipid metabolism, we detected the protein content of hepatic PPAR-α, a key factor in the regulation of lipid metabolism[15]. As shown in Figure 8A, HFD feeding inhibited PPAR-α protein accumulation, however lutein supplementation reversed this phenotype, especially in the high-dose group (P < 0.05). Meanwhile, the protein levels of SIRT1, the upstream regulator of PPAR-α[16], decreased notably in the HFD group compared with the ND group, and lutein supplementation ameliorated the expression significantly in a dose-dependent pattern in the high-dose group (P < 0.05; Figure 8B).
Figure 8.
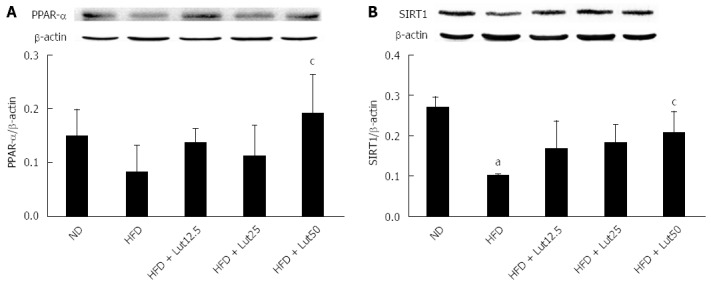
Lutein supplementation improved the expression of peroxisome proliferators activated receptor-α and sirtuin 1 in rat liver. After the rats were treated with lutein for 45 d, the hepatic lysates were prepared and immunoblotted with corresponding antibodies. Blotting with anti β-actin was used as a protein loading control. Data are expressed as the mean ± SD (n = 3). aP < 0.05 vs normal diet (ND) group; cP < 0.05 vs the high-fat diet (HFD) group.
DISCUSSION
In this study, we provided evidence that lutein supplementation could ameliorate insulin resistance and hepatic lipid accumulation. We also found that lutein supplementation augmented the mRNA and protein levels of key molecules related to insulin signaling which were suppressed by a HFD and the expression of PPAR-α, which is a key factor in the regulation of hepatic lipid metabolism. Furthermore, we found that lutein supplementation restored the expression of SIRT1, which regulates hepatic lipid metabolism and insulin signaling. All of these results suggest the beneficial effects of lutein on NAFLD.
According to the results of HOMA indexes, we found that lutein supplementation could improve insulin sensitivity. However, the process of insulin-regulated glucose homeostasis depends on glucose binding, as well as activating transmembrane insulin receptors and downstream targets[20]. The liver is one of the major target organs for insulin signaling[21,22], and some studies suggest that IRS2 can compensate IRS1 deficiency more effectively in liver and β-cells than in muscle or adipose tissues[23]. The liver is the main storage organ for carotenoids and controls the distribution of carotenoids to other tissues[24]. Therefore, we measured the mRNA and protein levels of IRS2, PI3K-P85, and GLUT2 in hepatic insulin signaling. As expected, the expression of these genes was inhibited in rats fed a HFD, as described in other studies[25-27]. However, lutein supplementation restored the insulin signaling pathway.
A large body of evidence supports a complex interaction between NAFLD and insulin resistance[28,29]. Some studies have suggested that abdominal adipose tissue has an important role in the development of insulin resistance[30]. Furthermore, visceral adipose tissue (VAT), a harmful fat deposition, has been considered to induce liver insulin resistance and further induce systemic insulin resistance[21,31]. According to our study, lutein supplementation for 45 d decreased serum TC, HDL-C, and perinephric and abdominal fat, as well as improve visceral fat deposition, without significant effects on body weight or energy efficiency. Moreover, lutein supplementation recovered liver function by decreasing hepatic TG, TC, and serum GPT levels effectively and improving lipid accumulation. These results suggest that lutein supplementation plays a potential role in preventing hepatic dyslipidemia and insulin resistance. However, the underlying mechanism is still unknown.
Some studies have demonstrated that PPAR-α plays an important role in the regulation of hepatic lipid metabolism[15,32] and that the inhibition of PPAR-α might induce hepatic steatosis[33]. Thus, we tested the protein level of PPAR-α and found that HFD feeding significantly inhibited the expression of PPAR-α, and that lutein supplementation reversed such inhibition effectively. Consistent with our results, some studies have also found that lutein may be an inducer of PPAR expression[34].
Meanwhile, SIRT1, a NAD+-dependent deacetylase, has been reported to be the upstream regulator of PPAR-α[15], regulating lipid metabolism by activating PPAR-α[35]. However, some studies have suggested that SIRT1 is involved in regulating hepatic insulin signaling[36] and preventing insulin resistance[37]. When we tested the protein content of hepatic SIRT1, as expected, HFD feeding decreased the expression of SIRT1, and lutein supplementation increased SIRT1 expression in a dose-dependent manner.
In our study, the number of rats chosen for real-time polymerase chain reaction and Western blot analysis was somewhat limited, and so, in future studies, we would increase the sample size. In addition, the doses of lutein need more consideration in future studies.
In summary, our findings suggest that lutein supplementation could ameliorate hepatic lipid accumulation and insulin resistance induced by a HFD, possibly via the activation of the expression of SIRT1 and, subsequently, PPAR-α and other key factors in insulin signaling. These findings provide a new prospect for preventing NAFLD.
ACKNOWLEDGMENTS
We are grateful to Wen-Zhong Wu and Yuan Huang of InnoBio CO., Ltd. Dalian, China for offering the lutein sample.
COMMENTS
Background
Non-alcoholic fatty liver disease (NAFLD) is the most common type of chronic liver diseases in the majority of developed countries. With the spread of the Western lifestyle in developing countries, NAFLD is beginning to affect more people. Therefore, it is important to find effective measures for the control of NAFLD. Lutein has been reported to have positive effects on lipid metabolism and insulin resistance, which are two important roles in the pathophysiology of NAFLD. However, there is only limited mechanistic research available regarding the effects of lutein on NAFLD or its risk factors.
Research frontiers
Lutein is one of the hundreds of known naturally oxygenated carotenoids and is abundantly present in vegetables, fruits, and egg yolks. Although, lutein has been found to play a key role in improving visual performance because of its strong blue light filtering ability, it has recently drawn increasing attention to its function in chronic diseases other than oculopathy. In NAFLD, the research hotspot is on ways to modulate lipid metabolism disturbance and insulin resistance.
Innovations and breakthroughs
This study revealed that lutein has positive effects on NAFLD via the modulation of hepatic lipid accumulation and insulin resistance, possibly via the activation of the expression of sirtuin 1 (SIRT1) and, subsequently, peroxisome proliferator activated receptor-α (PPAR-α). This study provides a new prospect for preventing NAFLD.
Applications
NAFLD is beginning to affect more and more people around the world, possibly due to changes in dietary habits and the increasing prevalence of sedentary lifestyles. Therefore, it is important to develop good dietary habits to treat NAFLD. The results from the present study suggest that lutein, which is abundant in vegetables, fruits, and egg yolks, has potential positive effects on NAFLD.
Terminology
NAFLD is a progressive pathological change in chronic liver disease caused by the disturbance of lipid metabolism together with insulin resistance. The major indexes of lipid metabolism are: total cholesterol, triglyceride, high density lipoprotein-cholesterol, and low density lipoprotein-cholesterol. Glutamic pyruvic transaminase plays an important role in liver function. The key factors in the hepatic insulin signaling pathway are insulin receptor substrate-2, phosphatidylinositol 3-kinase, and glucose transporter-2. PPAR-α is a key factor in the regulation of lipid metabolism. SIRT1 is the upstream regulator of PPAR-α.
Peer-review
The authors evaluated the role of lutein supplementation on hepatic fat content and insulin sensitivity in rats on a high fat diet. It is a well-designed and thorough study showing promising results.
Footnotes
Supported by Grants from the National High Technology Research and Development Program of China, No. 2010AA023003 and the National Natural Science Foundation of China, No. NSFC-81172657.
Institutional review board statement: All experiments were approved by the Tongji Medical College Council’s Animal Care Committee.
Institutional animal care and use committee statement: All procedures involving animals were reviewed and approved by the Institutional Animal Care and Use Committee at Tongji Medical College, Huazhong University of Science and Technology (IACUC protocol number: 373).
Conflict-of-interest statement: The authors declare that they have no competing interests.
Data sharing statement: No additional data are available.
Open-Access: This article is an open-access article which was selected by an in-house editor and fully peer-reviewed by external reviewers. It is distributed in accordance with the Creative Commons Attribution Non Commercial (CC BY-NC 4.0) license, which permits others to distribute, remix, adapt, build upon this work non-commercially, and license their derivative works on different terms, provided the original work is properly cited and the use is non-commercial. See: http://creativecommons.org/licenses/by-nc/4.0/
Peer-review started: January 15, 2015
First decision: February 10, 2014
Article in press: April 28, 2015
P- Reviewer: Shih SC, Zeb I S- Editor: Yu J L- Editor: Rutherford A E- Editor: Ma S
References
- 1.Wang XC, Zhan XR, Li XY, Yu JJ, Liu XM. MicroRNA-185 regulates expression of lipid metabolism genes and improves insulin sensitivity in mice with non-alcoholic fatty liver disease. World J Gastroenterol. 2014;20:17914–17923. doi: 10.3748/wjg.v20.i47.17914. [DOI] [PMC free article] [PubMed] [Google Scholar]
- 2.Ikura Y. Transitions of histopathologic criteria for diagnosis of nonalcoholic fatty liver disease during the last three decades. World J Hepatol. 2014;6:894–900. doi: 10.4254/wjh.v6.i12.894. [DOI] [PMC free article] [PubMed] [Google Scholar]
- 3.Masarone M, Federico A, Abenavoli L, Loguercio C, Persico M. Non alcoholic fatty liver: epidemiology and natural history. Rev Recent Clin Trials. 2014;9:126–133. doi: 10.2174/1574887109666141216111143. [DOI] [PubMed] [Google Scholar]
- 4.Yao J, Zhao Y, Zhang J, Hong Y, Lu H, Wu J. Serum amylase levels are decreased in Chinese non-alcoholic fatty liver disease patients. Lipids Health Dis. 2014;13:185. doi: 10.1186/1476-511X-13-185. [DOI] [PMC free article] [PubMed] [Google Scholar]
- 5.Kijlstra A, Tian Y, Kelly ER, Berendschot TT. Lutein: more than just a filter for blue light. Prog Retin Eye Res. 2012;31:303–315. doi: 10.1016/j.preteyeres.2012.03.002. [DOI] [PubMed] [Google Scholar]
- 6.Suzuki K, Ito Y, Inoue T, Hamajima N. Inverse association of serum carotenoids with prevalence of metabolic syndrome among Japanese. Clin Nutr. 2011;30:369–375. doi: 10.1016/j.clnu.2010.12.006. [DOI] [PubMed] [Google Scholar]
- 7.Barona J, Jones JJ, Kopec RE, Comperatore M, Andersen C, Schwartz SJ, Lerman RH, Fernandez ML. A Mediterranean-style low-glycemic-load diet increases plasma carotenoids and decreases LDL oxidation in women with metabolic syndrome. J Nutr Biochem. 2012;23:609–615. doi: 10.1016/j.jnutbio.2011.02.016. [DOI] [PMC free article] [PubMed] [Google Scholar]
- 8.Kimmons JE, Blanck HM, Tohill BC, Zhang J, Khan LK. Associations between body mass index and the prevalence of low micronutrient levels among US adults. MedGenMed. 2006;8:59. [PMC free article] [PubMed] [Google Scholar]
- 9.Ford ES, Will JC, Bowman BA, Narayan KM. Diabetes mellitus and serum carotenoids: findings from the Third National Health and Nutrition Examination Survey. Am J Epidemiol. 1999;149:168–176. doi: 10.1093/oxfordjournals.aje.a009783. [DOI] [PubMed] [Google Scholar]
- 10.Facchini FS, Humphreys MH, DoNascimento CA, Abbasi F, Reaven GM. Relation between insulin resistance and plasma concentrations of lipid hydroperoxides, carotenoids, and tocopherols. Am J Clin Nutr. 2000;72:776–779. doi: 10.1093/ajcn/72.3.776. [DOI] [PubMed] [Google Scholar]
- 11.Beydoun MA, Canas JA, Beydoun HA, Chen X, Shroff MR, Zonderman AB. Serum antioxidant concentrations and metabolic syndrome are associated among U.S. adolescents in recent national surveys. J Nutr. 2012;142:1693–1704. doi: 10.3945/jn.112.160416. [DOI] [PMC free article] [PubMed] [Google Scholar]
- 12.Kim JE, Leite JO, DeOgburn R, Smyth JA, Clark RM, Fernandez ML. A lutein-enriched diet prevents cholesterol accumulation and decreases oxidized LDL and inflammatory cytokines in the aorta of guinea pigs. J Nutr. 2011;141:1458–1463. doi: 10.3945/jn.111.141630. [DOI] [PubMed] [Google Scholar]
- 13.Fernández-Robredo P, Rodríguez JA, Sádaba LM, Recalde S, García-Layana A. Egg yolk improves lipid profile, lipid peroxidation and retinal abnormalities in a murine model of genetic hypercholesterolemia. J Nutr Biochem. 2008;19:40–48. doi: 10.1016/j.jnutbio.2006.12.020. [DOI] [PubMed] [Google Scholar]
- 14.Colak Y, Yesil A, Mutlu HH, Caklili OT, Ulasoglu C, Senates E, Takir M, Kostek O, Yilmaz Y, Yilmaz Enc F, et al. A potential treatment of non-alcoholic fatty liver disease with SIRT1 activators. J Gastrointestin Liver Dis. 2014;23:311–319. doi: 10.15403/jgld.2014.1121.233.yck. [DOI] [PubMed] [Google Scholar]
- 15.Ding X, Guo L, Zhang Y, Fan S, Gu M, Lu Y, Jiang D, Li Y, Huang C, Zhou Z. Extracts of pomelo peels prevent high-fat diet-induced metabolic disorders in c57bl/6 mice through activating the PPARα and GLUT4 pathway. PLoS One. 2013;8:e77915. doi: 10.1371/journal.pone.0077915. [DOI] [PMC free article] [PubMed] [Google Scholar]
- 16.Purushotham A, Schug TT, Xu Q, Surapureddi S, Guo X, Li X. Hepatocyte-specific deletion of SIRT1 alters fatty acid metabolism and results in hepatic steatosis and inflammation. Cell Metab. 2009;9:327–338. doi: 10.1016/j.cmet.2009.02.006. [DOI] [PMC free article] [PubMed] [Google Scholar]
- 17.Tan S, Li M, Ding X, Fan S, Guo L, Gu M, Zhang Y, Feng L, Jiang D, Li Y, et al. Effects of Fortunella margarita fruit extract on metabolic disorders in high-fat diet-induced obese C57BL/6 mice. PLoS One. 2014;9:e93510. doi: 10.1371/journal.pone.0093510. [DOI] [PMC free article] [PubMed] [Google Scholar]
- 18.Maditz KH, Oldaker C, Nanda N, Benedito V, Livengood R, Tou JC. Dietary n-3 polyunsaturated fatty acids or soy protein isolate did not attenuate disease progression in a female rat model of autosomal recessive polycystic kidney disease. Nutr Res. 2014;34:526–534. doi: 10.1016/j.nutres.2014.05.001. [DOI] [PubMed] [Google Scholar]
- 19.Maher MA, Banz WJ, Truett GE, Zemel MB. Dietary fat and sex modify heterozygote effects of the rat fatty (fa) allele. J Nutr. 1996;126:2487–2493. doi: 10.1093/jn/126.10.2487. [DOI] [PubMed] [Google Scholar]
- 20.Biddinger SB, Hernandez-Ono A, Rask-Madsen C, Haas JT, Alemán JO, Suzuki R, Scapa EF, Agarwal C, Carey MC, Stephanopoulos G, et al. Hepatic insulin resistance is sufficient to produce dyslipidemia and susceptibility to atherosclerosis. Cell Metab. 2008;7:125–134. doi: 10.1016/j.cmet.2007.11.013. [DOI] [PMC free article] [PubMed] [Google Scholar]
- 21.Wang Z, Lv J, Zhang R, Zhu Y, Zhu D, Sun Y, Zhu J, Han X. Co-culture with fat cells induces cellular insulin resistance in primary hepatocytes. Biochem Biophys Res Commun. 2006;345:976–983. doi: 10.1016/j.bbrc.2006.04.173. [DOI] [PubMed] [Google Scholar]
- 22.Vangipurapu J, Stančáková A, Kuulasmaa T, Soininen P, Kangas AJ, Ala-Korpela M, Kuusisto J, Laakso M. Association between liver insulin resistance and cardiovascular risk factors. J Intern Med. 2012;272:402–408. doi: 10.1111/j.1365-2796.2012.02540.x. [DOI] [PubMed] [Google Scholar]
- 23.Higaki Y, Wojtaszewski JF, Hirshman MF, Withers DJ, Towery H, White MF, Goodyear LJ. Insulin receptor substrate-2 is not necessary for insulin- and exercise-stimulated glucose transport in skeletal muscle. J Biol Chem. 1999;274:20791–20795. doi: 10.1074/jbc.274.30.20791. [DOI] [PubMed] [Google Scholar]
- 24.Sy C, Gleize B, Dangles O, Landrier JF, Veyrat CC, Borel P. Effects of physicochemical properties of carotenoids on their bioaccessibility, intestinal cell uptake, and blood and tissue concentrations. Mol Nutr Food Res. 2012;56:1385–1397. doi: 10.1002/mnfr.201200041. [DOI] [PubMed] [Google Scholar]
- 25.Gan KX, Wang C, Chen JH, Zhu CJ, Song GY. Mitofusin-2 ameliorates high-fat diet-induced insulin resistance in liver of rats. World J Gastroenterol. 2013;19:1572–1581. doi: 10.3748/wjg.v19.i10.1572. [DOI] [PMC free article] [PubMed] [Google Scholar]
- 26.Wang ZQ, Zhang XH, Yu Y, Tipton RC, Raskin I, Ribnicky D, Johnson W, Cefalu WT. Artemisia scoparia extract attenuates non-alcoholic fatty liver disease in diet-induced obesity mice by enhancing hepatic insulin and AMPK signaling independently of FGF21 pathway. Metabolism. 2013;62:1239–1249. doi: 10.1016/j.metabol.2013.03.004. [DOI] [PMC free article] [PubMed] [Google Scholar]
- 27.Jwa H, Choi Y, Park UH, Um SJ, Yoon SK, Park T. Piperine, an LXRα antagonist, protects against hepatic steatosis and improves insulin signaling in mice fed a high-fat diet. Biochem Pharmacol. 2012;84:1501–1510. doi: 10.1016/j.bcp.2012.09.009. [DOI] [PubMed] [Google Scholar]
- 28.Sasidharan SR, Joseph JA, Anandakumar S, Venkatesan V, Madhavan CN, Agarwal A. Ameliorative potential of Tamarindus indica on high fat diet induced nonalcoholic fatty liver disease in rats. ScientificWorldJournal. 2014;2014:507197. doi: 10.1155/2014/507197. [DOI] [PMC free article] [PubMed] [Google Scholar]
- 29.Nam HH, Jun DW, Jeon HJ, Lee JS, Saeed WK, Kim EK. Osthol attenuates hepatic steatosis via decreased triglyceride synthesis not by insulin resistance. World J Gastroenterol. 2014;20:11753–11761. doi: 10.3748/wjg.v20.i33.11753. [DOI] [PMC free article] [PubMed] [Google Scholar]
- 30.Mamtani M, Kulkarni H, Dyer TD, Almasy L, Mahaney MC, Duggirala R, Comuzzie AG, Blangero J, Curran JE. Waist circumference independently associates with the risk of insulin resistance and type 2 diabetes in mexican american families. PLoS One. 2013;8:e59153. doi: 10.1371/journal.pone.0059153. [DOI] [PMC free article] [PubMed] [Google Scholar]
- 31.Patel P, Abate N. Body fat distribution and insulin resistance. Nutrients. 2013;5:2019–2027. doi: 10.3390/nu5062019. [DOI] [PMC free article] [PubMed] [Google Scholar]
- 32.Tapia G, Valenzuela R, Espinosa A, Romanque P, Dossi C, Gonzalez-Mañán D, Videla LA, D’Espessailles A. N-3 long-chain PUFA supplementation prevents high fat diet induced mouse liver steatosis and inflammation in relation to PPAR-α upregulation and NF-κB DNA binding abrogation. Mol Nutr Food Res. 2014;58:1333–1341. doi: 10.1002/mnfr.201300458. [DOI] [PubMed] [Google Scholar]
- 33.Su Q, Baker C, Christian P, Naples M, Tong X, Zhang K, Santha M, Adeli K. Hepatic mitochondrial and ER stress induced by defective PPARα signaling in the pathogenesis of hepatic steatosis. Am J Physiol Endocrinol Metab. 2014;306:E1264–E1273. doi: 10.1152/ajpendo.00438.2013. [DOI] [PMC free article] [PubMed] [Google Scholar]
- 34.Selvaraj RK, Shanmugasundaram R, Klasing KC. Effects of dietary lutein and PUFA on PPAR and RXR isomer expression in chickens during an inflammatory response. Comp Biochem Physiol A Mol Integr Physiol. 2010;157:198–203. doi: 10.1016/j.cbpa.2010.06.172. [DOI] [PubMed] [Google Scholar]
- 35.Han C, Wan H, Ma S, Liu D, He F, Wang J, Pan Z, Liu H, Li L, He H, et al. Role of mammalian sirtuin 1 (SIRT1) in lipids metabolism and cell proliferation of goose primary hepatocytes. Mol Cell Endocrinol. 2014;382:282–291. doi: 10.1016/j.mce.2013.10.012. [DOI] [PubMed] [Google Scholar]
- 36.Kitada M, Koya D. SIRT1 in Type 2 Diabetes: Mechanisms and Therapeutic Potential. Diabetes Metab J. 2013;37:315–325. doi: 10.4093/dmj.2013.37.5.315. [DOI] [PMC free article] [PubMed] [Google Scholar]
- 37.Zhou B, Zhang Y, Zhang F, Xia Y, Liu J, Huang R, Wang Y, Hu Y, Wu J, Dai C, et al. CLOCK/BMAL1 regulates circadian change of mouse hepatic insulin sensitivity by SIRT1. Hepatology. 2014;59:2196–2206. doi: 10.1002/hep.26992. [DOI] [PubMed] [Google Scholar]


