Abstract
Recent advances have led to renewed interest in ballistocardiography (BCG), a non-invasive measure of the small reaction forces on the body from cardiovascular events. A broad range of platforms have been developed and verified for BCG measurement including beds, chairs, and weighing scales: while the body is coupled to such a platform, the cardiogenic movements of the center-of-mass (COM) are measured. Wearable BCG, measured with an accelerometer affixed to the body, may enable continuous, or more regular, monitoring during the day; however, the signals from such wearable BCGs represent local or distal accelerations of skin and tissue rather than the displacement of the body's COM. In this paper we propose a novel method to reconstruct the COM BCG from a wearable sensor via a training step to remove these local effects. Preliminary validation of this method was performed with fifteen subjects: the wearable sensor was placed at three locations on the surface of the body while COM BCG measurements were recorded simultaneously with a modified weighing scale. A regularized system identification approach was used to reconstruct the COM BCG from the wearable signal. Preliminary results suggest that the relationship between local and central forces is highly dependent on both the individual and the location where the wearable sensor is placed on the body and that these differences can be resolved via calibration to accurately measure changes in cardiac output and contractility from a wearable sensor. Such measurements could be highly effective, for example, for improved monitoring of heart failure patients at home.
Index Terms: ballistocardiography, wearable sensing, sensor informatics, home health monitoring
I. Introduction
Each year, one in every four deaths in the United States is due to cardiovascular disease (CVD), and 47 percent of sudden cardiac deaths occur outside of the hospital [1]. Continuous heart monitoring has the potential to not only reduce costs associated with invasive and minimally-invasive testing but also to improve the quality of life for many who are struggling with CVD and to provide the capability of early detection and preventative care. One method in development for noninvasively monitoring the mechanical aspects of cardiovascular function is ballistocardiography (BCG).
The BCG phenomenon was first discovered in the 1800s following J. W. Gordon's paper in 1877 explaining how the needle on a weighing scale fluctuates with the rhythm of the heart. Gordon speculated that the cause was ejection of blood into the aorta, comparing the recoil to “a ball propelled from a gun [2].” Studies with human subjects in the mid-20th century led to the discovery that the BCG can be used to detect heart malfunctions [3]. In an attempt to simplify the instrumentation required for measuring such vibrations of the body in response to the heartbeat, researchers developed another similar technique named seismocardiography (SCG), a measure of local accelerations of the chest wall resulting from the heartbeat [4]. In contrast to BCG, which required elaborate tables and beds, SCG could be measured by simply placing a small accelerometer on the chest of a supine subject. However, as the subsequent revolution in solid-state electronics led to significant progress in electrical heart monitoring techniques, and imaging technologies (ultrasound and magnetic resonance imaging, MRI) became widely prevalent in clinical practice, BCG research reached a nadir in the late 1980s [5].
Over the past two decades, developments in the semiconductor process have led to extremely low-cost and low-power micro-electromechanical systems (MEMS) sensors and microprocessors. These developments promise the ability to precisely measure and process BCG and SCG signals with extremely small and low-cost equipment in ways that have never before been possible. Simultaneously, the need for inexpensive medical equipment capable of measuring large quantities of physiological parameters outside of clinical settings – such as in the home – is imminent. Interest in the BCG is thus returning, and the volume of publications has been trending upward [5].
Scales, chairs, and beds were developed in the last few decades to measure the BCG and SCG signals at home [6-10]. These platforms are relatively well understood, however they do not offer the ability to monitor cardiac function continuously throughout the day. Wearable accelerometers placed at arbitrary locations on the upper body do offer this capability, but the signals they produce are fundamentally different from both the BCG and SCG: while the BCG represents displacements of the body's center-of-mass (COM), and the SCG represents accelerations of the chest wall, the wearable BCG represents accelerations of the surface of the skin at an arbitrary location on the upper body. As we showed in a previous paper, simply interpreting the wearable BCG signal as a COM BCG – as has been the norm in the existing literature – yields incorrect cardiac assessments [11]. This paper moves far beyond our previous work to build a framework for reconstructing the COM BCG from the wearable sensor via a calibration, or training, step. Furthermore, we demonstrate for the first time that COM BCG parameters can even be measured from the vertical accelerations of the wrist.
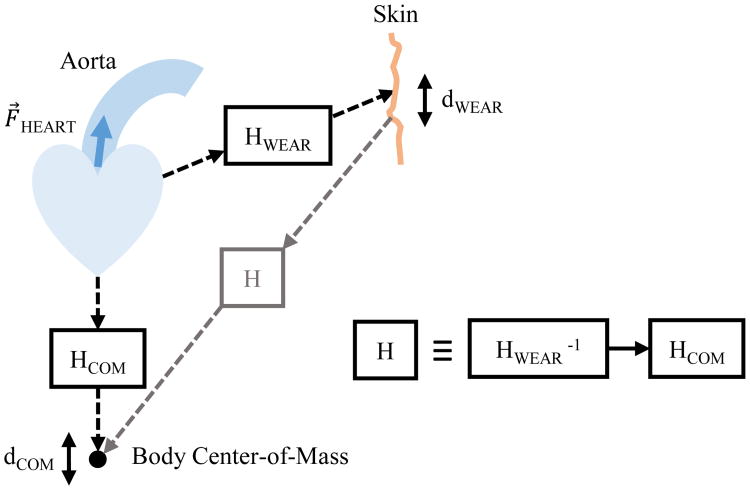
Although the wearable signal differs from these two widely-studied signals, it is related to them via the mechanics of the body. These underlying relationships can be leveraged to cross domains between different sensor modalities. In this paper we propose the relationship between the wearable BCG and the traditional BCG (which we will call the COM BCG) shown in Fig. 1, develop an improved numerical integrator to estimate the displacement of a wearable sensor from its acceleration, build a framework to resolve the COM BCG from the wearable BCG, and provide preliminary validation of this framework with data from human subjects.
Fig. 1.
Block diagram modeling the relationship between the wearable BCG and the COM BCG. Ejection of blood into the aorta causes displacement perturbations at the surface of the skin and the center-of-mass via two different mathematical systems.
II. Physical Overview and Hypotheses
The BCG is a displacement measurement that represents small reactionary forces of the body's COM resulting from cardiac ejection of blood into the vasculature [2, 12]. In this paper we examine the BCG signal in the vertical, or head-to-foot, axis when the subject is standing upright. Recently, several researchers have attempted to measure BCG signals from wearable devices, most notably a miniature accelerometer attached to the surface of the skin [13, 14]. Although this approach may yield continuous BCG recording in naturalistic environments, there are several outstanding scientific questions that must be addressed to properly compare between the two domains - wearable versus COM BCG.
The results of our previous study suggest that these whole-body (COM) displacements most closely match those at the surface of the skin when the wearable sensor is located at regions on the body that are well-coupled to the rigid skeletal system. Specifically, acceleration measurements at these locations closely matched the second derivative of the BCG as measured with a weighing scale [11]. This paper builds on our previous work by examining the relationship between these two fundamentally different BCG measurements and developing a novel method to reconstruct the COM BCG from the wearable signal. To achieve this reconstruction, our method relies heavily on the following hypothesis: a first-order approximation of the COM BCG can be obtained by twice integrating the wearable BCG.
To motivate the need for double integration, it is important to first highlight one aspect of the wearable BCG vis-à-vis the COM BCG. The wearable BCG is a measure of the acceleration of the sensor's mass on the surface of the skin. By contrast, the weighing scale is a measure of whole-body displacement via force measurements and Hooke's law. These two signals are fundamentally different and related primarily by the integral operator. When modeling the relationship between the wearable and COM BCG signals, it is important to first integrate the wearable acceleration signal twice in order to obtain an estimate of the sensor's relative displacement.
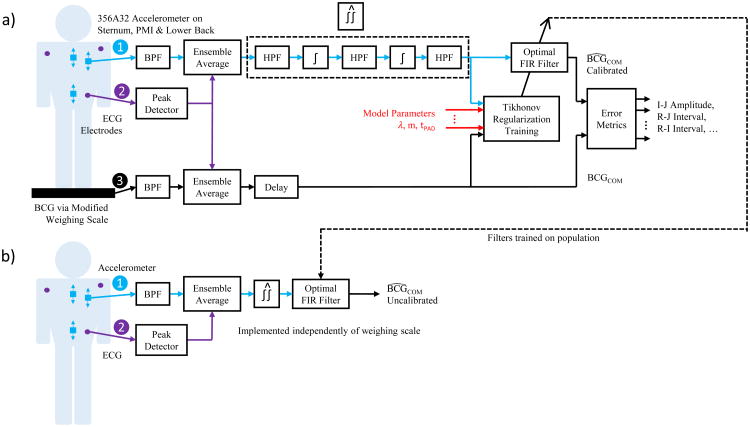
A priori knowledge about the physical behavior of the wearable sensor was leveraged to improve this displacement estimate. Since the accelerometer was physically attached to the skin and not able to move freely in space, we assume that nearly zero low-frequency energy should exist in the acceleration, velocity, and displacement. (If low-frequency components in these signals were allowed to persist, small errors in the acceleration measurement would accumulate into large velocities and displacements via the integral operators, and would thus incorrectly signify a slow drift of the sensor's position away from the thorax.) Therefore, numerical integration was performed in series with high-pass filters as shown in Fig. 2 to eliminate spurious low-frequency energy, and the cutoff frequency of the filters was determined empirically. The output of this sequence of operations was an estimate of the wearable sensor's displacement as a function of time, which was then used in subsequent steps to estimate the displacement of the body's center of mass (COM).
Fig. 2.
Block diagram showing the signal processing subsystems. The calibrated configuration is shown in (a), where the system is first trained on the individual, and (b) shows the uncalibrated configuration, where the system is pre-trained on a population of subjects.
To estimate the COM displacement, we would like to model the relationship between the wearable and COM BCG as a mathematical system H as shown in Fig. 1. In this model, the input to H is the wearable sensor's estimated displacement and the output is the COM BCG as a direct measure of the COM displacement. Single-input-single-output (SISO) mechanical systems, such as the classic spring-mass-dashpot system, are generally causal as perturbations at the input result in changes at the output only after they occur. However, since the genesis of energy in mechanical cardiac signals like the BCG is myocardial contraction and relaxation inside the thorax, and the resultant ejection of blood into the aorta, we hypothesize that wearable BCG signals recorded with an accelerometer on the surface of the body and COM BCG signals recorded with a weighing scale at the feet will both be coupled to the same source, the heart muscles and central blood movement, via two different unknown mechanical systems in the body. In this situation the outputs of two SISO systems, HWEAR and HCOM, are the displacements of the wearable and COM BCG signals, and these two systems share a common input originating from the heart. If this hypothesis is accurate, H will be non-causal because it involves the inverse of a causal system, HWEAR, in series (cascaded) with HCOM. Because inverting a causal system in general results in a non-causal one, the overall series system will also in general be non-causal.
Consequently, we posit that an approximation of H can be obtained via system identification by training a non-causal linear finite impulse response (FIR) filter Ĥ with simultaneous recordings of the wearable and COM BCG. Although H is almost certainly an infinite impulse response (IIR) system due to its mechanical origins in HWEAR and HCOM, an FIR filter of sufficient length can approximate an IIR system provided that the latter is stable. As instability would imply oscillations in the mechanical systems over time of sustained or increasing magnitude, stability of H is almost certainly a reasonable assumption. Therefore, if Ĥ can be made long enough to include most of the energy in the true system, Ĥ should provide a good reconstruction of the COM BCG from the wearable BCG. The methods we used to find Ĥ and the error metrics we used to quantify its goodness of fit are explained in the following section.
III. Methods
A. Hardware and Data Acquisition
COM BCG recordings in the head-to-foot axis were measured with a modified weighing scale, wearable BCG measurements were made with a high-resolution instrumentation-grade accelerometer oriented along the same axis, and electrocardiogram (ECG) measurements were made with handlebar and gel electrodes. For a detailed description of the hardware, refer to [11]. Two ECG waveforms were captured simultaneously to synchronize the wearable and COM BCGs, which were recorded with separate data acquisition units and sample rates of 120 Hz and 1000 Hz, respectively. All signals were recorded by a PC, resampled to a sample rate of 1000 Hz, synchronized via cross-correlation of the two ECG recordings, and analyzed offline.
B. Human Subjects
Fifteen healthy subjects with differing anthropometrics were recruited for this study approved by the Georgia Institute of Technology (GT) Institutional Review Board (IRB). Among these subjects were ten men and five women aged 22 to 57. Body mass ranged from 49 kg to 104 kg and height spanned 160 cm to 196 cm. The subjects were asked to wear three gel electrodes for measuring the ECG while also standing on a modified weighing scale to simultaneously capture the COM BCG. Additionally, subjects were asked to wear an accelerometer adhesively attached to the skin at each of three locations on the body: the body of the sternum halfway between the manubrium and the xiphoid process, the point of maximum inflection (PMI) on the pectorals directly above the heart, and the lumbar vertebrae at the lower back near the center of mass (COM). The subjects were asked to stand as still as possible on the scale while wearing the ECG electrodes and the accelerometer, and recordings approximately one minute in length were captured with the accelerometer at each of the three locations resulting in 45 total recordings.
In addition to the fifteen-subject trials, recordings were also made on one individual over a span of nine consecutive days to determine if cardiovascular health could be monitored over time via the wearable BCG. The wearable sensor was placed at the sternum, PMI, and lower back as before; however, additional recordings were also taken at the wrist. For the wrist trials, the wearable sensor was attached to the body where a person would typically place the face of a wrist watch. Cross validation was not used. Instead, Ĥ was trained on data from the first day, the COM BCG was reconstructed from the wearable BCG on each day using Ĥ , and these reconstructions were evaluated using the same error metrics as before.
C. Cross Validation and Error Metrics
K-fold cross validation is a technique commonly used to perform model selection in statistical and machine learning problems [15]. To use this tool on our dataset we split the BCG and ECG waveforms in each of the 45 recordings into individual heartbeats. Within each recording, five equal-sized sets of heartbeats were randomly partitioned. The signal processing steps described in the next section were performed on each recording five times, each time using four heartbeat sets to train the model (the training set) and using the remaining heartbeat set to perform a reconstruction of the COM BCG from the wearable BCG (the validation set). K=5 was chosen as a trade-off between immunity to overfitting for large values of K and low signal-to-noise-ratio (SNR) of the ensemble average when using a small number of heartbeats in the validation set.
Three error metrics were calculated from each fold's reconstructed COM BCG. These error metrics were the R-J interval, R-I interval, and I-J amplitude. These values are classical BCG measures of different cardiac metrics, and a good reconstruction of the COM BCG should accurately reproduce these values [7, 13, 16]. The average of these three values across all recordings and folds was determined and used as a composite error score to select each parameter in the model. 1-D error traces were generated by calculating the composite error score via cross validation for different values of one parameter while holding other parameters constant. Likewise, 2-D error traces were performed by varying two parameters.
D. Signal Processing
Fig. 2 shows a block diagram of the signal processing subsystems. First, band-pass filtering was performed on the BCG signals to eliminate out-of-band noise. The passband for these filters was 0.8 Hz – 8.0 Hz. Although the BCG contains frequency components higher than 8.0 Hz, we found that removing them improved the reconstruction (see below).
Next, a preprocessing step was necessary to increase the signal-to-noise ratio (SNR) of the two BCG signals. As described in the literature, the SNR of repeating events can be improved by leveraging the uncorrelated nature of the noise via ensemble averaging [citation needed]. An ensemble average of each signal was therefore produced by calculating the sample-by-sample mean with respect to fiducial points synchronous to the cardiac cycle. Similar to previous studies, the R-peak in the ECG was used as the fiducial point [13, 16, 17]. The minimum R-R interval for each recording, RRMIN, was used as the total number of samples in the ensemble average including and following the R-peak. A smaller number of samples before the R-peak were also included in the ensemble average to increase the total number of samples. This length was called the padding, tPAD, and the total number of samples in the ensemble average was therefore RRMIN + tPAD. Since cross validation was used, separate ensemble averages were constructed for the training and validation sets.
Finally, an estimate for the accelerometer displacement was determined via double integration and high-pass filtering. Numerical integration was performed with trapezoidal integrators, and high-pass filters were implemented with moving average subtractors. The output of each high-pass filter was its input subtracted by its moving average, and the length of the moving average was the same for all the filters. The optimal length was determined empirically with a 1-D error trace and found to be 100 samples for our sample rate of 1000 Hz. This resolves to a cutoff frequency of 6.0 Hz (corresponding to the filter's -3 dB point) and a maximum passband ripple of 1.45 dB.
E. System Identification via Least Squares Regression
A training step was used to find the impulse response of Ĥ. For any FIR filter, there are three parameters that must be optimized with the objective of achieving generalization and thereby avoiding overfitting: (1) causality of the system, (2) length of the filter, and (3) values for the filter weights. The following approach was used for optimizing these three parameters.
First, the COM BCG ensemble average was modified with a variable delay. A zero delay resulted in the best-fit causal impulse response while delays greater than zero produced a non-causal FIR. Performing cross validation for each case revealed that causality had a large impact on the reconstruction accuracy.
Second, the length of the filter was determined using 2-D error tracing. A sweep of filter lengths from 1 to 800 samples and padding lengths from 0 to 400 samples was performed and the values of these two parameters corresponding to the minimum composite error score from cross validation were found.
Third, the impulse response of the optimal FIR filter was found via least-squares regression. In a typical discrete linear system, an unknown signal x modified by a known linear transform A produces a known output b as shown in (1).
| (1) |
To find the best-fit FIR filter of order m to transform one signal f of length N into another signal d, a linear equation can be constructed in the same form. In this case, the A matrix contains samples from the input signal f, b contains samples from the desired output signal d, and x is a 1-D vector of FIR coefficients, or taps. This process is broadly named least squares filtering.
The explicit form of A, b, and x is shown in (2), (3), and (4). In this paper, signal f is the vector of samples from the wearable BCG displacement ensemble average, d is the vector of samples from the (possibly delayed) COM BCG ensemble average, and x contains the adaptive filter coefficients.
| (2) |
| (3) |
| (4) |
This particular form of A, b, and x is sometimes called the covariance method because it uses only data that is explicitly available and does not assume that samples outside of the available data window are zero [18]. In this context all of the samples in the ensemble average are used and we do not assume that samples outside of the ensemble average window are zero. This results in a matrix equation that is more computationally expensive to solve but improves the accuracy of the solution.
F. Tikhonov Regularization
The regression was also regularized to reduce overfitting. Since the data included imperfections from various sources such as electrical noise, postural sway of the subjects, and motion artifacts from small movements like head-tilts, a simple least squares solution would overfit the training data reducing the accuracy of the reconstruction. Tikhonov regularization was employed to mitigate this effect [19].
The ordinary least-squares solution x is that which minimizes the square of the l2-norm of the error as shown in (5). The solution x̂ is shown in (6).
| (5) |
| (6) |
Since ordinary least-squares is highly sensitive to noise, x̂ can be regularized by adding a term to the minimization expression as shown in (7).
| (7) |
In this updated loss function, Γ is a Tikhonov matrix whose effect is to give preference to certain solutions. For this study, the scaled identity matrix in (8) was chosen.
| (8) |
This particular Tikhonov matrix causes the solution vector x̂ to shrink toward the origin. Small values of λ result in overfitting while large values of λ result in underfitting. In other words, the solution approaches the ordinary least squares solution as λ→ 0 and zero as λ→ ∞. The optimal value of λ was 6.7 × 10⁻⁴ when displacements were expressed in meters as determined with a 1-D error trace. (Tikhonov regularization is also known as ridge regression in statistics, and this kind of error trace is often called a ridge trace in that field [20].) The Tikhonov-regularized solution is shown in (9).
| (9) |
In this case, the solution x̂ is the FIR filter's vector of coefficients and the impulse response of Ĥ.
G. Evaluating Results
The methods described above were evaluated using the composite error score. 2-D error traces were generated by sweeping the padding and filter lengths with cross validation on the entire dataset. The optimal values for these two parameters were chosen by finding the minimum average composite score for each of the three locations on the body to determine if these parameters depended on the wearable sensor's location. This process was performed separately for the causal and non-causal cases to support or refute our causality hypothesis. Additionally, the individual error values were extracted from the cross validation step for the sternum, PMI, and COM. Finally, uncalibrated reconstructions were also made by using the average FIR filter for each body location across all subjects to reconstruct the COM BCG for each subject. The error scores for these uncalibrated reconstructions were used to evaluate whether it would be possible to achieve accurate results without raining step.
IV. Results and Discussion
A. Results for All Subjects
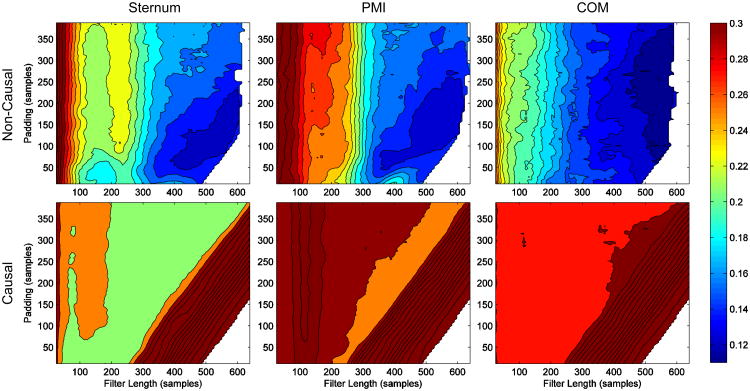
Fig. 3 shows 2-D error traces for causal and non-causal reconstructions of the COM BCG for each wearable sensor location on the body. Non-causal filters clearly resulted in a much better reconstruction than the causal ones, suggesting that the underlying impulse response of H is indeed non-causal. There was little difference in the optimal padding and filter length between the different locations on the body, although the optimal padding length for the COM was slightly longer than the other two. The optimal padding (tPAD) and filter length (m) in samples were 141 and 558 for an overall error of 0.1194 at the sternum, 145 and 550 for an error of 0.1240 at the PMI, and 162 and 550 for an error of 0.1124 at the COM. The COM was still the best location to wear the sensor, but only slightly. The raw error metrics from cross validation testing for each subject with these values for tPAD and m are shown in Table 1.
Fig. 3.
Contour plots of 2-D error traces for the causal and non-causal BCG reconstructions from the wearable BCG at the sternum, PMI (point of maximum inflection), and COM (lower back). The plots were generated on the same color scale so that comparisons can easily be made between them. The causal filters resulted in very large errors while the non-causal filters performed well with an average error across the three error metrics of about 12 percent at the optimal filter length and padding.
Table I. Error Metrics for All Subjects.
| Demographics | Sternum | PMI | Lower Back | ||||||||||||
|---|---|---|---|---|---|---|---|---|---|---|---|---|---|---|---|
| Subj. & Gdr. | Ht. (cm) | Wt. (kg) | Age (yrs) | I-J Err. | R-J Err. | R-I Err. | Avg. Err. | I-J Err. | R-J Err. | R-I Err. | Avg. Err. | I-J Err. | R-J Err. | R-I Err. | Avg. Err. |
| 1 M | 178 | 60 | 23 | 0.14 | 0.02 | 0.07 | 0.08 | 0.05 | 0.02 | 0.04 | 0.04 | 0.10 | 0.02 | 0.08 | 0.07 |
| 2 M | 175 | 69 | 22 | 0.47 | 0.12 | 0.12 | 0.24 | 0.24 | 0.02 | 0.22 | 0.16 | 0.48 | 0.52 | 0.47 | 0.49 |
| 3 F | 160 | 49 | 22 | 0.29 | 0.05 | 0.08 | 0.14 | 0.35 | 0.09 | 0.15 | 0.2 | 0.35 | 0.08 | 0.13 | 0.19 |
| 4 M | 185 | 105 | 22 | 0.26 | 0.02 | 0.05 | 0.11 | 0.34 | 0.03 | 0.04 | 0.13 | 0.16 | 0.02 | 0.04 | 0.07 |
| 5 M | 196 | 98 | 23 | 0.15 | 0.02 | 0.09 | 0.09 | 0.25 | 0.02 | 0.09 | 0.12 | 0.26 | 0.02 | 0.07 | 0.12 |
| 6 M | 178 | 89 | 32 | 0.06 | 0.01 | 0.07 | 0.05 | 0.05 | 0.004 | 0.02 | 0.02 | 0.11 | 0.01 | 0.03 | 0.05 |
| 7 M | 185 | 73 | 23 | 0.12 | 0.01 | 0.02 | 0.05 | 0.13 | 0.02 | 0.06 | 0.07 | 0.19 | 0.03 | 0.05 | 0.09 |
| 8 F | 172 | 52 | 37 | 0.33 | 0.14 | 0.22 | 0.23 | 0.22 | 0.02 | 0.04 | 0.09 | 0.10 | 0.003 | 0.03 | 0.04 |
| 9 M | 180 | 85 | 26 | 0.11 | 0.01 | 0.05 | 0.06 | 0.09 | 0.03 | 0.07 | 0.06 | 0.20 | 0.01 | 0.01 | 0.07 |
| 10 F | 165 | 53 | 48 | 0.56 | 0.04 | 0.11 | 0.24 | 0.35 | 0.03 | 0.14 | 0.17 | 0.46 | 0.08 | 0.08 | 0.21 |
| 11 M | 182 | 85 | 37 | 0.13 | 0.01 | 0.02 | 0.05 | 0.27 | 0.01 | 0.02 | 0.10 | 0.04 | 0.01 | 0.01 | 0.02 |
| 12 F | 165 | 53 | 22 | 0.30 | 0.01 | 0.12 | 0.14 | 0.15 | 0.02 | 0.04 | 0.07 | 0.22 | 0.01 | 0.03 | 0.09 |
| 13 F | 160 | 61 | 57 | 0.20 | 0.20 | 0.28 | 0.23 | 0.45 | 0.29 | 0.42 | 0.39 | 0.23 | 0.02 | 0.03 | 0.09 |
| 14 M | 180 | 78 | 32 | 0.34 | 0.14 | 0.23 | 0.24 | 0.07 | 0.04 | 0.05 | 0.05 | 0.14 | 0.01 | 0.04 | 0.06 |
| 15 M | 173 | 68 | 24 | 0.29 | 0.02 | 0.05 | 0.12 | 0.19 | 0.06 | 0.08 | 0.11 | 0.25 | 0.03 | 0.05 | 0.11 |
|
| |||||||||||||||
| Avg. | 176 | 71.9 | 30 | 0.25 | 0.05 | 0.10 | 0.14 | 0.21* | 0.05* | 0.10 | 0.12 | 0.22 | 0.06 | 0.08* | 0.12* |
| Min. | 160 | 49 | 22 | 0.06 | 0.01 | 0.02 | 0.05 | 0.05 | 0.00 | 0.02 | 0.02 | 0.04 | 0.00 | 0.01 | 0.02 |
| Max. | 196 | 105 | 57 | 0.56 | 0.2 | 0.28 | 0.24 | 0.45 | 0.29 | 0.42 | 0.39 | 0.48 | 0.52 | 0.47 | 0.49 |
| Med. | 178 | 69 | 24 | 0.26 | 0.02 | 0.08 | 0.12 | 0.22 | 0.02 | 0.06 | 0.10 | 0.20 | 0.02 | 0.04 | 0.09 |
| σ | 10.1 | 17.7 | 10.7 | 0.14 | 0.06 | 0.08 | 0.08 | 0.12 | 0.07 | 0.10 | 0.09 | 0.13 | 0.13 | 0.11 | 0.11 |
The best location is marked with an asterisk.
While Fig. 3 shows that the best reconstructions were from the COM for short filter lengths, suggesting that the COM displacement is probably closest to the true COM BCG and agreeing with the results of our previous paper, it is interesting to note that when the techniques in this paper were applied the difference between wearable locations almost completely disappeared. After an initial training step, or calibration, reconstructing the COM BCG from the wearable BCG was just as accurate from one location on the body as another. As a result, the wearable device could be placed on any location on the body by the user themselves, and after a calibration step with the weighing scale the COM BCG could be accurately reconstructed for the remainder of use.
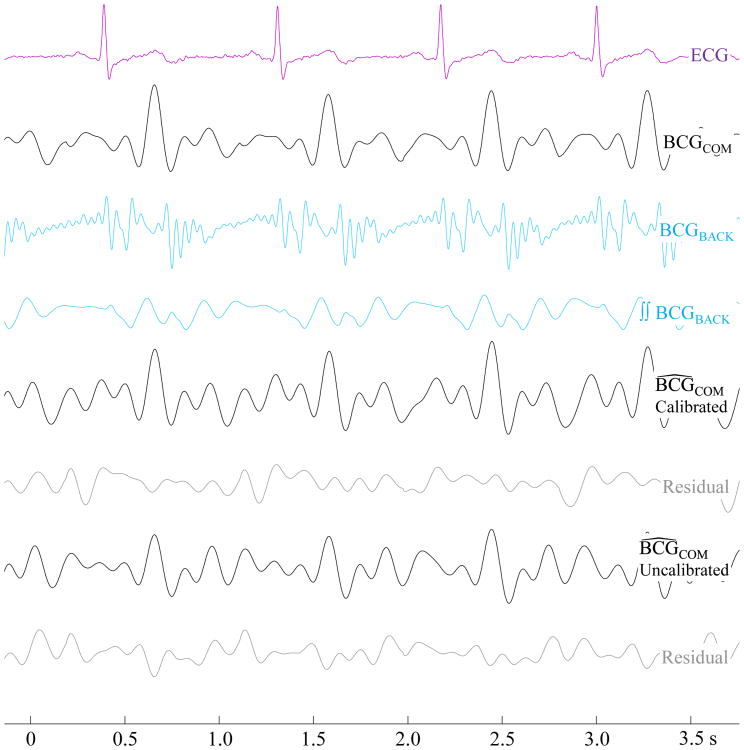
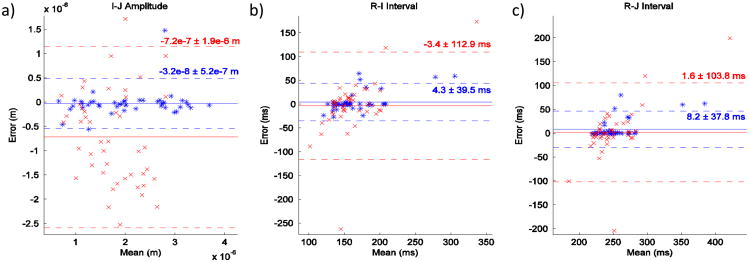
Fig. 4 shows the waveforms of an example reconstruction from the COM. The uncalibrated reconstruction in this example appears qualitatively worse than the calibrated, or trained, reconstruction. This observation is supported by the Bland-Altman plots [21] in Fig. 5 which compare the accuracy of the two methods in measuring I-J amplitude, R-I interval, and R-J interval of the COM BCG for all subjects. Specifically, the standard deviation of the uncalibrated measurements is much larger than the calibrated ones. Since the uncalibrated results are worse in all three metrics, calibration is clearly needed to obtain the most accurate results. This suggests that there may be large differences in the true impulse response H between different locations on the same subject and between different subjects at the same location.
Fig. 4.
Waveforms showing the reconstruction process of a recording with the wearable sensor placed at the COM. The calibrated reconstruction is visibly superior to the uncalibrated BCG.
Fig. 5.
Bland-Altman plots comparing the calibrated (blue) and uncalibrated (red) methods for I-J amplitude, R-I interval, and R-J interval measurements. The calibrated reconstructions had a much smaller standard deviation than the uncalibrated counterparts.
B. Results for Multi-Day Trials
The error metrics over all nine days of the multi-day trials appear in Fig. 6. The I-J amplitude error spanned -16.2% to +8.4%, the R-I interval error was between -13.5% and -0.9%, and the R-J interval error was between -6.2% and -0.5%. As these errors were relatively low and did not trend in any particular direction with time, the wearable BCG is likely most consistent within the same subject and location on the body. It may therefore be possible to measure cardiac changes over time with the wearable BCG at one location – such as with accelerometers embedded in a smartwatch – using one initial calibration with the scale.
Fig. 6.
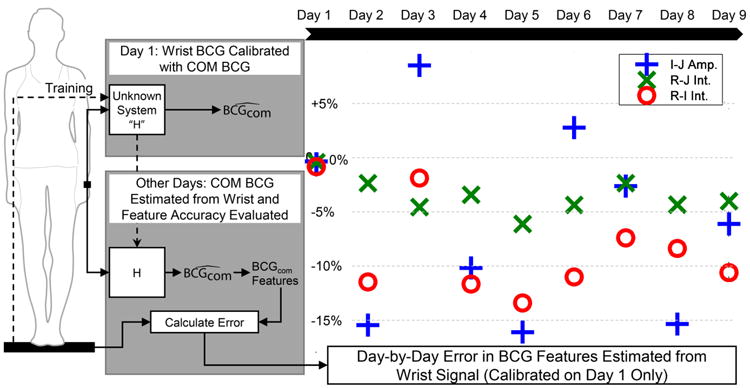
Error metrics for reconstructing the COM BCG from the wearable BCG measured at the wrist. The algorithm was trained on the first day, and that calibration was used for each subsequent day. The R-J interval reconstruction provided the lowest error of the three key features.
V. Conclusion and Future Work
In this paper we describe, for the first time, a method for estimating the COM BCG, a measure of the displacement of the body's center of mass, with an accelerometer placed on the surface of the skin and a simultaneously-acquired ECG. Preliminary validation for this new technique was performed on data from 15 consenting human subjects. Whereas it has been shown that the acceleration on the surface of the skin differs substantially from whole-body displacement measurements taken with traditional BCG platforms, training this algorithm with a COM BCG recording from a modified weighing scale allowed accurate reconstructions of the COM BCG from three arbitrary locations on the body for fifteen subjects at rest. (And from the wrist on one subject at rest over several days.) This technique could therefore enable trending cardiac output and contractility with a simple wearable device using published BCG analysis tools via a simple calibration step.
To the best of our knowledge, this is also the first demonstration of central hemodynamic force measurement from the wrist. Because the BCG is a measurement of central hemodynamic forces, the ability to measure the signal from a distal location, such as the wrist, potentially has profound applicability to the important problem of cuffless blood pressure measurement. In future work, by pairing the measurement of central BCG forces from the wrist with additional local pulse measurement modalities – such as photoplethysmography – we plan to develop novel pulse-transit time based approaches for blood pressure monitoring in a smart-watch form factor.
Further studies are also needed to validate this technique for subjects whose cardiovascular systems are modulated or diseased since this study included only healthy subjects in quiescence. Freedom to measure the BCG beyond large appliances and the ability to place the wearable sensor on arbitrary places on the body would open up many opportunities for heart monitoring throughout the day, and we intend for this paper to serve as a framework for enabling new BCG modalities and applications going forward.
Biographies

Andrew Wiens (S'10) received B.S. degrees in electrical engineering and computer engineering with honors from Washington University in St. Louis in 2013. He came to the Department of Electrical and Computer Engineering at Georgia Institute of Technology as a teaching assistant in digital signal processing the same year, and in 2014 he became a teaching assistant in electromagnetics.
He is currently a research assistant in Dr. Omer Inan's lab and working toward the Ph.D degree. He has been a student member of IEEE since 2010, and his current research interests include bioengineering, signal processing, machine learning, and techniques for noninvasive physiological measurements.
Mr. Wiens received the President's Scholarship in 2013 from the Georgia Institute of Technology.

Omer. T. Inan (S'06, M'09) received the B.S., M.S., and Ph.D. degrees in electrical engineering from Stanford University, Stanford, CA, in 2004, 2005, and 2009, respectively.
He joined ALZA Corporation (A Johnson and Johnson Company) in 2006 as an Engineering Intern in the Drug Device Research and Development Group, where he designed micropower, high efficiency circuits for iontophoretic drug delivery, and researched options for closed-loop drug delivery systems. In 2007, he joined Countryman Associates, Inc., Menlo Park, CA where he was Chief Engineer, involved in designing and developing high-end professional audio circuits and systems. From 2009-2013, he was also a Visiting Scholar in the Department of Electrical Engineering, Stanford University. Since 2013, Dr. Inan is an Assistant Professor of Electrical and Computer Engineering, and Program Faculty in the Interdisciplinary Bioengineering Graduate Program, at the Georgia Institute of Technology. His research interests focus on non-invasive physiologic monitoring for human health and performance, and applying novel sensing systems to chronic disease management and pediatric care.
Dr. Inan is an Associate Editor of the IEEE Journal of Biomedical and Health Informatics, Associate Editor for the IEEE Engineering in Medicine and Biology Conference, Member of the IEEE Technical Committee on Translational Engineering for Healthcare Innovation, and Technical Program Committee Member or Track Chair for several other major international biomedical engineering conferences. He has published more than 35 technical articles in peer-reviewed international journals and conferences, and has three pending patents. Dr. Inan received the Gerald J. Lieberman Fellowship (Stanford University) in 2008-'09 for outstanding scholarship, teaching and service. He is a Three-Time National Collegiate Athletic Association All-American in the discus throw, and a former co-captain of the Stanford University Track and Field Team.
References
- 1.Lloyd-Jones D, Adams RJ, Brown TM, Carnethon M, Dai S, De Simone G, et al. Heart disease and stroke statistics--2010 update: a report from the American Heart Association. Circulation. 2010 Feb 23;121:e46–e215. doi: 10.1161/CIRCULATIONAHA.109.192667. [DOI] [PubMed] [Google Scholar]
- 2.Gordon JW. Certain Molar Movements of the Human Body produced by the Circulation of the Blood. J Anat Physiol. 1877 Apr;11:533–6. [PMC free article] [PubMed] [Google Scholar]
- 3.Mandelbaum H, Mandelbaum RA. Studies Utilizing the Portable Electromagnetic Ballistocardiograph: IV. The Clinical Significance of Serial Ballistocardiograms Following Acute Myocardial Infarction. Circulation. 1953;7:910–915. doi: 10.1161/01.cir.7.6.910. [DOI] [PubMed] [Google Scholar]
- 4.Salerno DM, Zanetti J. Seismocardiography for Monitoring Changes in Left Ventricular Function during Ischemia. Chest. 1991;100:991–993. doi: 10.1378/chest.100.4.991. [DOI] [PubMed] [Google Scholar]
- 5.Giovangrandi L, Inan OT, Wiard RM, Etemadi M, Kovacs GTA. Ballistocardiography: A method worth revisiting. EMBC 2011. 2011:4279–4282. doi: 10.1109/IEMBS.2011.6091062. [DOI] [PMC free article] [PubMed] [Google Scholar]
- 6.Alihanka J, Vaahtoranta K, Saarikivi I. A new method for long-term monitoring of the ballistocardiogram, heart rate, and respiration. Am J Physiol. 1981 May;240:R384–92. doi: 10.1152/ajpregu.1981.240.5.R384. [DOI] [PubMed] [Google Scholar]
- 7.Lindqvist A, Pihlajamaki K, Jalonen J, Laaksonen V, Alihanka J. Static-Charge-Sensitive Bed Ballistocardiography In Cardiovascular Monitoring. Clinical Physiology. 1996;16:23–30. doi: 10.1111/j.1475-097x.1996.tb00553.x. [DOI] [PubMed] [Google Scholar]
- 8.Inan OT, Etemadi M, Wiard RM, Giovangrandi L, Kovacs GTA. Robust ballistocardiogram acquisition for home monitoring. Physiological Measurement. 2009;30:169. doi: 10.1088/0967-3334/30/2/005. [DOI] [PubMed] [Google Scholar]
- 9.Koivistoinen T, Junnila S, Varri A, Koobi T. A new method for measuring the ballistocardiogram using EMFi sensors in a normal chair. Conf Proc IEEE Eng Med Biol Soc. 2004;3:2026–9. doi: 10.1109/IEMBS.2004.1403596. [DOI] [PubMed] [Google Scholar]
- 10.Inan OT. Recent advances in cardiovascular monitoring using ballistocardiography. Engineering in Medicine and Biology Society (EMBC), 2012 Annual International Conference of the IEEE. 2012:5038–5041. doi: 10.1109/EMBC.2012.6347125. [DOI] [PubMed] [Google Scholar]
- 11.Wiens A, Etemadi M, Roy S, Klein L, Inan OT. Towards Continuous, Non-Invasive Assessment of Ventricular Function and Hemodynamics: Wearable Ballistocardiography. IEEE JBHI. 2014 doi: 10.1109/JBHI.2014.2359937. In Press. [DOI] [PMC free article] [PubMed] [Google Scholar]
- 12.Nickerson JL, Warren JV, Brannon ES. The Cardiac Output in Man: Studies with the Low Frequency, Critically-Damped Ballistocardiography, and the Method of Right Atrial Catheterization. J Clin Invest. 1947;26:1–10. doi: 10.1172/JCI101780. [DOI] [PMC free article] [PubMed] [Google Scholar]
- 13.He DD, Winokur ES, Sodini CG. A continuous, wearable, and wireless heart monitor using head ballistocardiogram (BCG) and head electrocardiogram (ECG) Engineering in Medicine and Biology Society, EMBC, 2011 Annual International Conference of the IEEE. 2011:4729–4732. doi: 10.1109/IEMBS.2011.6091171. [DOI] [PubMed] [Google Scholar]
- 14.Rienzo MD, Vaini E, Castiglioni P, Merati G, Meriggi P, Parati G, et al. Wearable seismocardiography: Towards a beat-by-beat assessment of cardiac mechanics in ambulant subjects. Autonomic Neuroscience: Basic and Clinical. 2013:50–59. doi: 10.1016/j.autneu.2013.04.005. [DOI] [PubMed] [Google Scholar]
- 15.Stone M. Cross-Validatory Choice and Assessment of Statistical Predictions. Journal of the Royal Statistical Society. 1974;36:111–147. [Google Scholar]
- 16.Etemadi M, Inan OT, Giovangrandi L, Kovacs GTA. Rapid Assessment of Cardiac Contractility on a Home Bathroom Scale. Information Technology in Biomedicine, IEEE Transactions on. 2011;15:864–869. doi: 10.1109/TITB.2011.2161998. [DOI] [PubMed] [Google Scholar]
- 17.Inan OT, Etemadi M, Wiard RM, Kovacs GTA, Giovangrandi L. Novel methods for estimating the ballistocardiogram signal using a simultaneously acquired electrocardiogram. Engineering in Medicine and Biology Society, 2009 EMBC 2009 Annual International Conference of the IEEE. 2009:5334–5347. doi: 10.1109/IEMBS.2009.5333709. [DOI] [PubMed] [Google Scholar]
- 18.Moon TK, Stirling WC. Mathematical Methods and Algorithms for Signal Processing. Upper Saddle River: Prentice Hall; 2000. [Google Scholar]
- 19.Tikhonov AN. Solution of Incorrectly Formulated Problems and the Regularization Method. Soviet Mathematics. 1963;5:1035–1038. 1963. [Google Scholar]
- 20.Hoerl AE, Kennard RW. Ridge Regression: Biased Estimation for Nonorthogonal Problems. Technometrics. 1970;12:55–67. [Google Scholar]
- 21.Bland JM, Altman DG. Statistical methods for assessing agreement between two methods of clinical measurement. The Lancet. 1986;327:307–310. [PubMed] [Google Scholar]


