Abstract

Arylvinylenebipyridyl (AVB) ligands are bright, zinc(II)-sensitive fluoroionophores. The applicability of AVBs as fluorescent indicators for imaging cellular zinc(II), however, is limited by low photostability, partially attributable to the photoisomerization of the vinylene functionality. Two configurationally immobilized (i.e., “locked”) AVB analogues are prepared in this work. The zinc(II)-sensitive photophysical properties and zinc(II) affinities of both AVBs and their locked analogues are characterized in organic and aqueous media. The zinc(II) sensitivity of the emission is attributed to the zinc(II)-dependent energies of the charge transfer excited states of these compounds. The configurationally locked ligands have improved photostability, while maintaining the brightness and zinc(II) sensibility of their AVB progenitors. The feasibility of the “locked” AVB analogues with improved photostability for imaging intracellular Zn(II) of eukaryotic cells using laser confocal fluorescence microscopy is demonstrated.
INTRODUCTION
Zinc(II) ions are involved in a broad spectrum of mammalian physiological processes.1–3 The amount of kinetically labile (sometimes referred as “free”) zinc(II) in an organism is maintained in a delicate homeostatic balance,4–6 the deviation from which is implicated in many diseases.7,8 The understanding, on the cellular and molecular levels, of the functions of zinc(II) in these disease-causing processes is expected to aid diagnosis and treatment. An indicator that is capable of selectively recording zinc(II) abundance and trafficking in living cells in preferably a quantitative manner would be an invaluable tool in zinc(II) biology. The choice of fluorescence as the signal readout is attributed to the minimally invasive live-cell imaging capabilities and the ever-increasing spatial and temporal resolutions of modern fluorescence microscopes.9 The success of fluorescent calcium(II) indicators10,11 is a significant facilitator in the development of zinc(II) indicators, by providing valuable experience in the design of ligands and fluorophores.
Zinc(II) indicators12–16 based on fluorescence intensity readout can be separated into two categories.17,18 A fluorescence turn-on indicator reports the zinc(II) concentration by a proportional increase in fluorescence intensity without changing its frequency. The fluorescence intensity at a single wavelength therefore is a function of zinc(II) concentration. A fluorescence ratiometric indicator undergoes zinc(II)-dependent emission frequency change without significantly altering the fluorescence quantum yield. Therefore, the zinc(II) concentration is the function of the ratio of emission intensity at two wavelengths, those of the free and zinc(II)-bound indicators. A ratiometric readout is sometimes preferred over the absolute intensity readout of a turn-on indicator, because the output dependence on photobleaching and uneven loading of dyes as well as on instrumental variations are somewhat minimized in the ratiometric mode.10,19
From a molecular design point of view, turn-on and ratiometric indicators require different structural considerations. A turn-on indicator is a fluorophore of which the major nonradiative decay pathway is eliminated upon forming a zinc(II) complex, while the wavelength of emission is unchanged. For a ratiometric indicator, the ground- and excited-state energies are altered differently upon binding zinc(II), thus resulting in an emission frequency change. A straightforward method for creating a ratiometric indicator is to exploit the differing electrostatic interactions between a zinc(II) ion and ground- and excited-state dipoles of a charge-transfer fluorophore (also commonly referred to as a donor—acceptor, or a “push-pull” fluorophore). Assuming the excited state has a dipole moment larger than that of the ground state, cation coordination at either the positive or the negative end of the excited-state dipole (or the disjoint HOMO or LUMO orbital in a quadruple20,21) would lead to a hypsochromic or a bathochromic shift, respectively, of emission and/or excitation (Figure 1). Other frequency- changing molecular photophysical processes such as excimer formation, excited-state proton transfer, and Förster resonance energy transfer can also be rendered zinc(II)-dependent for creating ratiometric zinc(II) indicators.15,16
Figure 1.

Charge-transfer (or “push-pull”) fluoroionophore and the effect on emission via zinc(II) coordination.
Our group has studied the fluorescence properties of arylvinylenebipyridyl (AVB) compounds, which are considered charge-transfer fluorophores.22,23 An example is compound 1 (Chart 1), which has a p-methoxyphenyl as the electron-donating group that is conjugated via a vinylene functionality to the electron-withdrawing bipyridyl. The push–pull AVBs show a positive emission solvatochromic effect, and bathochromic shifts in both emission and excitation upon zinc(II) binding at the bipyridyl site. Despite the brightness and zinc(II) sensitivity of the AVBs, such as 1 and 3 (Chart 1),22 one drawback of this series of compounds is the lack of photostability resulting from their propensity for photoisomerization. To address this issue, compounds 2 and 4 (Chart 1) are prepared in the current work, in which the vinylene trans configurations are frozen in a furan ring. As a result, the zinc(II) sensitivity of their AVB precursors 1 and 3 is preserved, while the photostability is improved.
Chart 1.
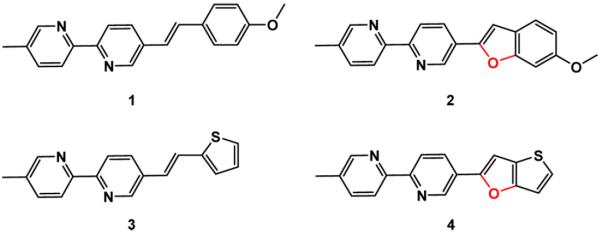
Structures of AVBs
RESULTS AND DISCUSSION
1. Synthesis
The synthesis of compound 2 is shown in Scheme 1. Horner–Wadsworth–Emmons reaction between aldehyde 224 and diethyl phosphonate 625 afforded compound 7 in 80%. Removal of the methoxymethyl (MOM) group of 7 by TsOH resulted in compound 8, which upon treating with I2 in the presence of K2CO3 was converted to compound 2.26
Scheme 1.

Synthesis of Compound 2a
The synthesis of compound 4 is outlined in Scheme 2. Compound 1127 was prepared from the commercially available 3-methoxythiophene (9) in two steps. Protection of the hydroxy group of 11 by methoxymethyl bromide (MOMBr) afforded aldehyde 12 in 95%, which underwent the Horner–Wadsworth–Emmons reaction with diethyl phosphonate 625 to give compound 13 in 66%. The MOM group of compound 13 was removed using TsOH to result in 14, the oxidative cyclization of which using K2CO3 and I2 afforded compound 4.
Scheme 2.

Synthesis of Compound 4a
2. Solvent-Dependent Fluorescence of Compounds 2 and 4
Apart from the reinforced trans-configuration in a furan ring, the structure of compound 2 is similar to that of 1. The fluorescence quantum yield (ϕ) and lifetime (τ) of compounds 1 and 2 were measured in different solvents (Table 1). The time constants of radiative (kr) and nonradiative (knr) decays (Table 1) were calculated based on eqs 1 and 2. The ϕ and τ values of the configurationally immobilized compound 2 are larger than those of the photoisomerizable 1, by 90% and 100% on average, respectively. Both compounds have similar kr values in the same solvents. However, compound 2 has significantly smaller knr than that of 1 in all solvents. These data suggest that the configurational stability of 2 does not contribute to a more allowed radiative transition (a larger kr). Rather, the rate of nonradiative decay is reduced (a smaller knr, by 78% on average), most likely a consequence of eliminating the photoisomerization pathway.
Table 1.
Fluorescence Quantum Yield (ϕ), Lifetime (τ), and Radiative and Nonradiative Decay Rate Constants (kr and knr) of Compounds 1 and 2 in Different Solventsa
| solvent | ε | ϕ (1) | ϕ (2) | τ/ns (1) | τ/ns (2) | kr/ns−1 (1) | kr/ns−1 (2) | knr/ns−1 (1) | knr/ns−1 (2) |
|---|---|---|---|---|---|---|---|---|---|
| hexanes | 2.02 | 0.60 | 0.84 | 0.91 | 1.12 | 0.65 | 0.75 | 0.43 | 0.14 |
| dioxane | 2.3 | 0.49 | 0.78 | 0.84 | 1.47 | 0.60 | 0.53 | 0.59 | 0.15 |
| benzene | 2.3 | 0.53 | 0.75 | 0.75 | 1.30 | 0.71 | 0.58 | 0.62 | 0.19 |
| toluene | 2.4 | 0.54 | 0.71 | 0.79 | 1.28 | 0.69 | 0.55 | 0.56 | 0.23 |
| CHCl3 | 4.8 | 0.36 | 0.70 | 0.70 | 1.57 | 0.52 | 0.45 | 0.90 | 0.19 |
| EtOH | 25 | 0.35 | 0.83 | 0.92 | 2.02 | 0.39 | 0.41 | 0.69 | 0.08 |
| MeOH | 33 | 0.33 | 0.79 | 0.95 | 2.18 | 0.35 | 0.36 | 0.69 | 0.08 |
| MeCN | 36.6 | 0.28 | 0.91 | 0.60 | 1.84 | 0.47 | 0.49 | 1.20 | 0.05 |
| DMF | 38.3 | 0.37 | 0.69 | 0.76 | 1.80 | 0.48 | 0.38 | 0.82 | 0.17 |
| DMSO | 47 | 0.48 | 0.82 | 0.86 | 1.80 | 0.56 | 0.46 | 0.59 | 0.10 |
| H2Ob | 78.5 | 0.05 | 0.25 | 1.11 | 2.48 | 0.04 | 0.10 | 0.86 | 0.30 |
ε: dielectric constant; ϕ: fluorescence quantum yield; τ: fluorescence lifetime determined via time-correlated single-photon counting (TCSPC); kr and knr: radiative and nonradiative decay time constants, determined using eqs 1 and 2. The table is sorted in the ascending order of ε.
An aqueous solution buffered by HEPES (100 mM) at pH 7.4.
| (1) |
| (2) |
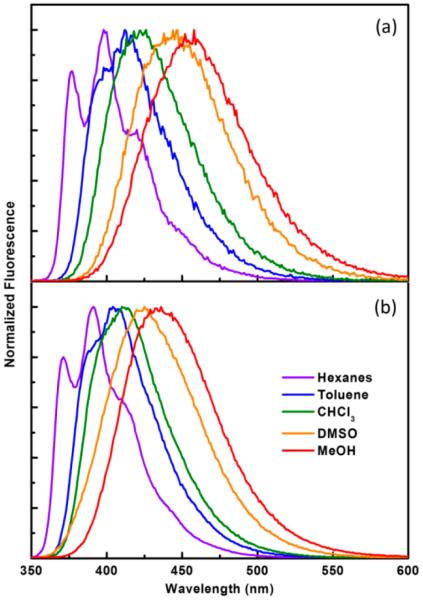
It is noteworthy that the high fluorescence quantum yield (ϕ) of compound 2 measured in organic solvents (≥0.69) depends little on solvent polarity. The lifetime (τ) of 2 increases moderately as the solvent polarity grows, which can be attributed to the increasing charge-transfer character of the emissive excited state that likely decreases kr. The substantial excited-state dipole moment of compound 2 is reflected in the solvent-dependent emission band shape and wavelength (Figure 2a). A structured fluorescence spectrum was obtained in the nonpolar hexanes, which do not offer strong solvent–solute interactions that would lead to inhomogeneous broadening of the spectrum.28,29 As the polarity and/or the hydrogen bond donating ability of the solvent increases, the strong solvent–solute interaction not only stabilizes the dipolar excited state of 2 but contributes to the inhomogeneous broadening, to result in a broad, structure-less emission at a longer wavelength from that in hexanes. The normalized excitation of 2 in all solvents is independent of emission wavelength (Figures S1–S5, Supporting Information), which indicates that solvent relaxation of the excited state is fast and reaches equilibrium well within the lifetime of the excited fluorophore. On the basis of the literature convention, the structured high energy emission of 2 in hexanes might be referred to as the locally excited (LE) emission, whereas the structure-less low energy emission in more polar solvents is considered to be charge transfer (CT) emission, although the meanings of LE and CT could become ambiguous under different contexts.30–33 The emission of compound 4 has similar solvent dependency, the spectra of which are shown in Figure 2b.
Figure 2.
Normalized emission spectra of (a) 2 (2.2 μM) and (b) 4 (2.5 μM) in different solvents (shown in the legend in b). λex = 340 nm.
The ϕ and τ values of compounds 3 and 4 along with the kr and knr values are listed in Table 2. The kr values of the configurationally locked 4 in the tested solvents are larger than that of the “unlocked” olefin analogue 3. The rates of nonradiative decay (knr) of 4 are significantly smaller than those of 3 in all solvents. These observations are consistent with the comparison between compounds 1 and 2 and support the rationale that eliminating the potential of photoisomerization in the AVB fluoroionophores by confining the trans double bond in a heterocycle decreases the rate of nonradiative decay, hence increasing the fluorescence quantum yield.
Table 2.
Fluorescence Quantum Yield (ϕ), Lifetime (τ), and Radiative and Nonradiative Decay Rate Constants (kr and knr) of Compounds 3 and 4 in Different Solventsa
| solvent | ε | ϕ (3) | ϕ (4) | τ/ns (3) | τ/ns (4) | kr/ns−1 (3) | kr/ns−1 (4) | knr/ns−1 (3) | knr/ns−1 (4) |
|---|---|---|---|---|---|---|---|---|---|
| hexanes | 2.02 | 0.16 | 0.50 | 0.46 | 0.85 | 0.35 | 0.59 | 1.83 | 0.59 |
| dioxane | 2.3 | 0.10 | 0.50 | 0.41 | 0.94 | 0.24 | 0.53 | 2.20 | 0.53 |
| benzene | 2.3 | 0.10 | 0.59 | 0.40 | 0.85 | 0.25 | 0.69 | 2.25 | 0.48 |
| toluene | 2.4 | 0.12 | 0.58 | 0.43 | 0.86 | 0.28 | 0.67 | 2.05 | 0.49 |
| CHCl3 | 4.8 | 0.07 | 0.44 | 0.34 | 0.92 | 0.21 | 0.48 | 2.74 | 0.61 |
| EtOH | 25 | 0.05 | 0.66 | 0.33 | 1.63 | 0.15 | 0.40 | 2.88 | 0.21 |
| MeOH | 33 | 0.04 | 0.65 | 0.32 | 1.82 | 0.13 | 0.36 | 3.00 | 0.19 |
| MeCN | 36.6 | 0.04 | 0.60 | 0.23 | 1.30 | 0.17 | 0.46 | 4.17 | 0.31 |
| DMF | 38.3 | 0.06 | 0.67 | 0.32 | 1.34 | 0.19 | 0.50 | 2.94 | 0.25 |
| DMSO | 47 | 0.07 | 0.76 | 0.33 | 1.51 | 0.21 | 0.50 | 2.82 | 0.16 |
| H2Ob | 78.5 | 0.06 | 0.54 | 0.30 | 2.31 | 0.20 | 0.23 | 3.13 | 0.20 |
ε: dielectric constant; ϕ: fluorescence quantum yield; τ: fluorescence lifetime determined via time-correlated single-photon counting (TCSPC); kr and knr: radiative and nonradiative decay constants, determined using eqs 1 and 2. The table is sorted in the ascending order of ε.
An aqueous solution buffered by HEPES (100 mM) at pH 7.4.
3. Fluorescence Titrations of 1–4 with Zn(ClO4)2 in CH3CN
The fluorescence quantum yields, lifetime, and emission maxima of compounds 1–4 under zinc(II)-free and zinc(II)-saturated conditions in CH3CN are listed in Table 3. Similar to their configurationally unlocked olefin counterparts, the binding of zinc(II) (in the form of Zn(ClO4)2) of the locked CT fluoroionophores 2 and 4 in CH3CN leads to bathochromic shifts of their absorption and emission spectra (Figures S6 and S7, Supporting Information). As an example, the zinc(II) titration data using compound 4 in both absorption and emission modes are included as Figure S9, Supporting Information. Both lowest energy absorption and emission bands of 4 were red-shifted as zinc(II) titration proceeded. Therefore, this compound could be used for analyzing zinc(II) in a ratiometric mode, i.e., the ratio of the absorption or the emission bands of the zinc(II)-free and the zinc(II)-bound forms, respectively, is a function of zinc(II) concentration. The p-methoxyphenyl-containing compounds 1 and 2 are capable of larger zinc(II)-induced emission bathochromic shifts (, Table 3) than the thienyl-containing 3 and 4, suggesting that the p-methoxyphenyl group is a more effective electron-donating group than the thienyl in CT type fluorophores. Fluorescence quantum yield (ϕ) relates to the rates of both radiative (kr) and nonradiative (knr) decays (eq 3). Unlike compounds 1 and 3, the ϕ values of which grow upon zinc(II) binding due to a more significant decrease in knr relative to kr (Table 3), the metal-free forms of compounds 2 and 4 already have high fluorescence quantum yields, which are slightly reduced upon zinc(II) binding, attributable to the steeper drop of kr relative to knr (Table 3).
| (3) |
Table 3.
Photophysical Parameters of 1–4 (L) and Their Zinc(II) Complexes (ZnL) in CH3CNa
| L | λabs(L) (nm) | λabs(ZnL) (nm) | ϕ L | ϕ ZnL | λem(L) (nm) | λem(ZnL) (nm) |
|
τL (ns) | τZnL (ns) | kr(L) (ns−1) | kr(ZnL) (ns−1) | knr(L) (ns−1) | knr(ZnL) (ns−1) | |
|---|---|---|---|---|---|---|---|---|---|---|---|---|---|---|
| 1 | 345 | 374 | 0.28 | 0.46 | 431 | 533 | 4440 | 0.60 | 3.14 | 0.47 | 0.15 | 1.20 | 0.17 | |
| 2 | 347 | 381 | 0.91 | 0.34 | 435 | 538 | 4401 | 1.84 | 3.33 | 0.49 | 0.10 | 0.05 | 0.20 | |
| 3 | 348 | 375 | 0.04 | 0.25 | 422 | 504 | 3855 | 0.23 | 1.91 | 0.17 | 0.13 | 4.17 | 0.39 | |
| 4 | 343 | 380 | 0.60 | 0.55 | 420 | 505 | 4008 | 1.30 | 3.71 | 0.46 | 0.15 | 0.31 | 0.12 |
λabs(L) and λabs(ZnL) are wavelengths at absorbance maxima; ϕL and ϕZnL are fluorescence quantum yields λem(L) and λem(ZnL) are wavelengths at emission maxima; is the zinc(II)-binding caused emission frequency shift in cm−1; τL and τZnL are fluorescence lifetimes; kr and knr are calculated from eqs 1 and 2.
4. Fluorescence Titrations of 1–4 with Zn(ClO4)2 under Physiologically Relevant Conditions
The zinc-(II)-dependent fluorescence of 1–4 was also studied under simulated physiological conditions to evaluate the applicability of these ligands in imaging zinc(II) ions in biological systems.12–16 The zinc(II)-dependent emission wavelengths and quantum yields of 1–4 are listed in Table 4. In a neutral aqueous solution (see caption of Figure 3), the emission maximum of 2 (478 nm, ϕ = 0.25) appears at a longer wavelength than that of 1 (460 nm). The free ligand 1 has a fluorescence quantum yield (ϕ) of 0.05. The titration of Zn(ClO4)2 leads to the formation of bipy/zinc(II) complex, which at saturation results in a ϕ of 0.31 along with a red shift of 53 nm ( = 2,246 cm−1) of compound 1. Under the same conditions, the zinc(II) complex of the configurationally rigid 2 had a longer emission band (524 nm, ϕ = 0.15) with a smaller zinc(II)-effected bathochromic shift (46 nm; 1,837 cm−1).
Table 4.
Photophysical Parameters of Ligands (L) 1–4 and Their Zinc(II) Complexes [ZnL](ClO4)2 in a Neutral Aqueous Solutiona
| L | λabs(L) (nm) | λabs(ZnL) (nm) | ϕ L | ϕ ZnL | λem(L) (nm) | λem(ZnL) (nm) | τL (ns) | τZnL (ns) | kr(L) (ns−1) | kr(ZnL) (ns−1) | knr(L) (ns−1) | knr(ZnL) (ns−1) | Kd (μM) | pKa |
|---|---|---|---|---|---|---|---|---|---|---|---|---|---|---|
| 1 | 344 | 368 | 0.05 | 0.31 | 460 | 513 | 1.11 | 2.69 | 0.04 | 0.12 | 0.86 | 0.26 | 0.04–2 | 4.5 |
| 2 | 347 | 373 | 0.25 | 0.15 | 478 | 524 | 2.48 | 2.42 | 0.10 | 0.06 | 0.30 | 0.35 | 0.02–0.8 | 4.3 |
| 3 | 350 | 371 | 0.06 | 0.18 | 456 | 493 | 0.30 | 1.75 | 0.20 | 0.10 | 3.13 | 0.47 | 0.009–0.2 | 4.3 |
| 4 | 347 | 372 | 0.54 | 0.44 | 459 | 495 | 2.31 | 3.29 | 0.23 | 0.13 | 0.20 | 0.17 | 0.01–0.4 | 4.3 |
ϕL and ϕZnL are the fluorescence quantum yields in zinc(II)-free and -saturated forms, respectively; τL and τZnL are the fluorescence lifetimes; kr, and knr are calculated from eqs 1 and 2; Kd is the dissociation constant of a presumed ZnL complex; Ka is the acidity constant of the conjugate acid of the ligand. All data except pKa were measured in an aqueous solution buffered by HEPES (100 mM) at pH 7.4.
Figure 3.
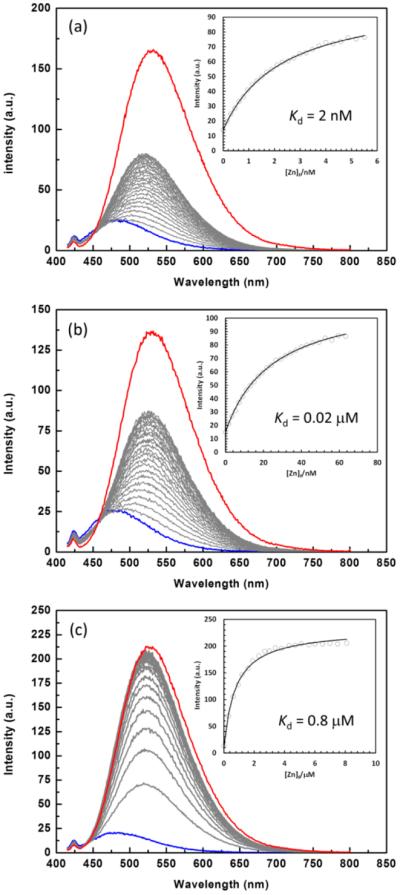
Fluorescence spectra of 2 (2.5 μM, λex = 405 nm) in the presence of Zn(ClO4)2 (0–2 mM) in an aqueous solution ([HEPES] = 100 mM, [metal buffer] = 1 mM, [KNO3] = 100 mM, pH 7.4). Metal buffer = NTA (a); ADA (b); citrate (c). The initial zinc(II)-free and the final zinc(II)-saturated spectra of each titration experiment are coded blue and red, respectively. Insets: fluorescence intensity at indicated emission wavelength vs free zinc(II) concentration [Zn]f. The solid lines are fitting curves using a 1:1 binding model.37
Excited at 405 nm where the zinc(II) complex preferentially absorbs, the zinc(II)-dependent emission spectra of 2 acquired under different conditions are shown in Figure 3. The emission spectra of 1, 3, and 4 are included in the Supporting Information (Figures S10–S12). A largely emission enhancement, instead of a ratiometric change, as [zinc(II)] increases was observed due to the increased absorption from the zinc(II) complex at the excitation wavelength of 405 nm.34 The intensity at the emission maxima was plotted versus the free zinc(II) concentration [Zn]f (see insets of Figure 3) for assessing the zinc(II) affinity of 2. The [Zn]f values were controlled using a ligand at millimolar with known zinc(II) affinity (a “metal buffer”).35 In this case, three metal buffers were evaluated for their appropriateness in determining the affinity of the ligands to zinc(II), as measured by the apparent 1:1 dissociation constant (Kd).36 Using nitrilotriacetic acid (NTA, Kd(Zn) = 14 nM) as the metal buffer, the emission of compound 2 (Figure 3a) grew with increasing [Zn]f. However, when the upper limit of the NTA buffering range was reached, the emission of 2 was not yet half saturated, as marked by the red curve. A similar observation was made when N-(2-acetamido)iminodiacetic acid (ADA, Kd(Zn) = 83 nM, Figure 3b) was used as the metal buffer. Although the binding isotherms in both cases are fittable using the 1:1 binding equation (see the fitting curves in the insets), in our view, those numbers overestimated the zinc(II) affinity of 2 (the Kd values are smaller than the true value). Citrate (Kd(Zn) = 12 μM) allowed the zinc(II) titration to reach saturation (Figure 3c), and the fitting of the binding isotherm gave a Kd of 0.8 μM. Although based on the initial large changes in the titration data, citrate is an insufficient zinc(II) buffer for competing zinc(II) with compound 2. On the basis of these observations, one would draw the conclusion that the apparent Kd of the presumed ZnL complex is somewhere between 20 nM and 800 nM.36 The estimates of the Kd values of compounds 1, 3, and 4 were obtained similarly and are listed in Table 4.
The pKa values of ligands 1–4 cluster in the narrow range of 4.3–4.5. Therefore, under pH neutral conditions, these compounds are in their neutral base forms. The Zn(II) sensitivity of these compounds, therefore, shall be free of interference from pH fluctuation in the physiologically tolerated range (from 4.8 in lysosome to 7.4 of blood). Similar to other bipy-containing fluorophores that we have reported,38,39 compounds 1–4 preferentially bind transition metal ions over alkali and alkaline earth metal ions. As expected, the selectivity of the new compounds 2 and 4 (Figures S13 and S14, Supporting Information) roughly follows the predictions of the Irving–Williams order.40
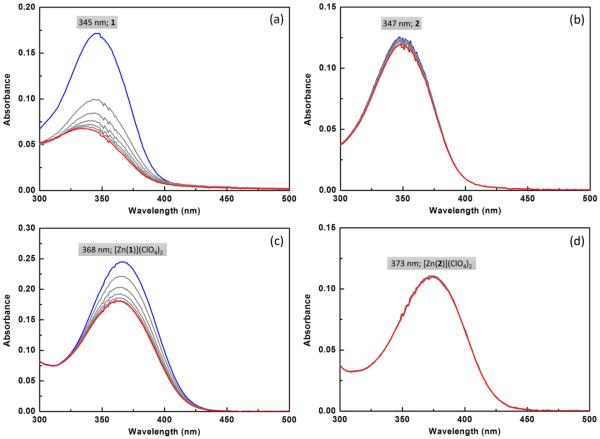
The contrast in photostability between trans-olefin 1 and configurationally locked analogue 2 is apparent in their absorption sensitivity to UV irradiation in an aqueous solution buffered at pH 7.4. When placing under the irradiation of a hand-held UV lamp (λex = 365 nm), the absorption band of compound 1 drops quite significantly (Figure 4a), consistent with the occurrence of a rapid photoisomerization. When a sample of 2 was subjected to the same treatment, the absorption change was rather minimal (Figure 4b). Similarly, superior photostability of 2 over 1 was observed while the ligands were saturated with Zn(ClO4)2 (Figures 4c,d). The saturation of compound 1 with zinc(II) appears to stabilize the compound against photoisomerization by a moderate extent, an interesting observation that is worthy of further investigation.
Figure 4.
Absorption spectra of compounds (a) 1 and (b) 2 at 5 μM each in 10% DMSO-containing aqueous solution (HEPES: 100 mM, pH = 7.4, NTA: 1 mM, KCl: 100 mM) acquired under irradiation from a hand-held UV lamp (365 nm, 4 W) for 1 min. The spectra were collected at 10 s increments from blue to red traces. The changes of absorption spectra of (c) 1 and (d) 2 under the same conditions in the presence of Zn(ClO4)2 (2 mM).
5. Laser Confocal Fluorescence Microscopy
The ability of 1–4 to image intracellular free zinc(II) was evaluated in live eukaryotic cells. HeLa S3 cells were incubated in culture medium in the presence of a ligand (2 μM) for 30 min. The medium was removed, and the cells were rinsed twice with fresh, indicator-free medium. The cells were further incubated in the presence of sodium pyrithione (50 μM), an ionophore for facilitating zinc(II) entry through the cell membrane, and either 0 or 50 μM ZnCl2 for 10 min.41 Cell morphology was monitored by acquiring brightfield differential interference contrast (DIC) images in parallel with the fluorescence images. The lack of change in cell morphology was an indication that the indicator did not exert toxicity during the course of the incubation and the imaging experiment, which lasted over 1 h.
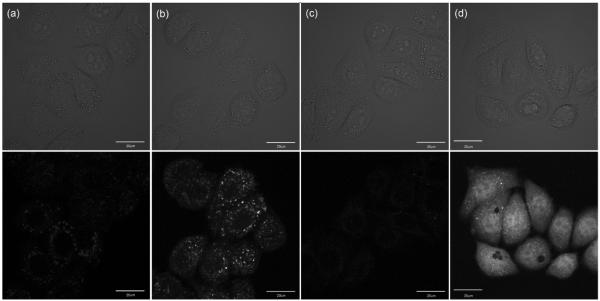
All fluorescence images were acquired on a confocal laser point-scanning fluorescence microscope under the excitation of a 405 nm diode laser. An emission window of 530–570 nm was selected via application of a variable bandpass filter. The images of cells stained by the configurationally locked compounds 2 or 4 are shown in Figure 5 in both fluorescence (bottom) and DIC modes (top). Using the identical instrumental parameter set, the fluorescence intensity of cells stained with either 2 or 4 in the presence of 50 μM of ZnCl2 is much higher than that of the cells incubated in medium without zinc(II) supplementation. This data demonstrates the abilities of 2 and 4 in imaging zinc(II) ions in live cells. The difference in the distribution patterns highlights the inability of predicting and controlling the intracellular destinations after uptake of synthetic indicators, which has been pointed out by other researchers.42,43
Figure 5.
Images of HeLa S3 cells incubated with 2 (a, b) or 4 (c, d) at 2 μM for 30 min at 37 °C. The upper and lower panels are the differential interference contrast (DIC) and the fluorescence images (λex = 405 nm, λem 530-570 nm), respectively. Panels a and c are images taken in the absence of supplemental zinc(II) ([ZnCl2] = 0), while images in b and d are taken under zinc(II)-enriched conditions ([ZnCl2] = 50 μM). [sodium pyrithione] = 50 μM. The scale bar is 20 μm.
6. Time-Lapse Experiments for Assessing Photostability
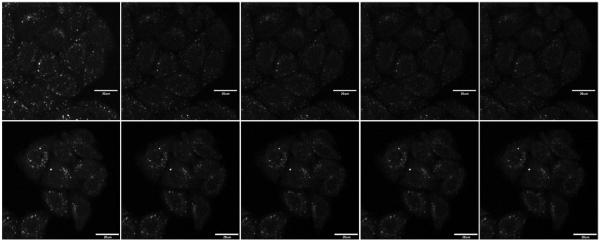
The photostability of the photoisomerizable compound 1 and 3 relative to that of their configurationally locked counterparts 2 and 4 in live cell fluorescence imaging experiments was assessed in the time-lapse video mode, while the fluorescence intensity of the samples was recorded over time under constant 405 nm diode laser irradiation. Fluorescence images were selected from the video data at defined time intervals (Figures 6 and 7). The time-lapse data of cells incubated with compounds 1 and 2 under zinc(II)-enriched conditions (50 μM in the culture medium) were collected using the same set of instrumental parameters. Therefore, the decays of the fluorescence intensity originated from 1 and 2, averaged over a number of regions of interest (ROIs), can be compared for assessing the relative photostability of these two compounds.
Figure 6.
Fluorescence images of HeLa S3 cells (λex = 405 nm, emission 530–570 nm) after incubated with “unlocked” 1 (upper) or “locked” 2 (lower) at 2 μM, in the presence of ZnCl2 (50 μM) and sodium pyrithione (50 μM) over time under continuous laser irradiation (images shown every 20 frames, approximately every 1 min from left to right). The scale bar is 20 μm.
Figure 7.
Fluorescence images of HeLa S3 cells (λex = 405 nm, emission 530–570 nm) after incubated with “unlocked” 3 (upper) or “locked” 4 (lower) at 2 μM, in the presence of ZnCl2 (50 μM) and sodium pyrithione (50 μM) over time under continuous laser irradiation (images shown every 20 frames, approximately every 1 min from left to right). The scale bar is 20 μm.
For both 1 and 2, the fluorescence intensity decayed over time by visual examination (Figure 6). The intensity as a function of time is plotted in Figure 8a. It is apparent that the emission from cells loaded with compound 2 under zinc(II)-enriched conditions (50 μM ZnCl2 in the growth medium) decayed slower than the cells stained with compound 1 under the identical conditions. The fluorescence images and intensity decay traces from the time-lapse experiments using 3 and 4 are shown in Figures 7 and 8b. Similarly, the configurationally immobilized 4 shows moderately but consistently higher photostability than the isomerizable counterpart 3.
Figure 8.
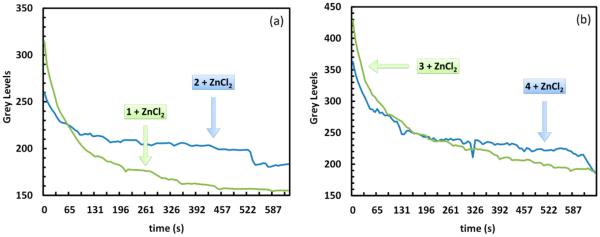
(a) Intracellular intensity of HeLa S3 cells (averaged over 21 cells, λex = 405 nm, λem 530–570 nm) over time when incubated with 1 (green) or 2 (blue) at 2 μM, in the presence of ZnCl2 (50 μM) and sodium pyrithione (50 μM). (b) Same comparison between 3 (green) and 4 (blue).
CONCLUSION
In summary, the photostability of the charge-transfer fluoroionophore arylvinylenebipyridyls 1 and 3 is improved in their configurationally immobilized analogues 2 and 4, respectively. The fluorescence quantum yield and lifetime measurements attribute the enhanced photostability to the reduction of the rate of nonradiative decay, presumably by blocking the photoisomerization pathway of the excited state. The brightness and zinc(II) sensitivity of the arylvinylenebipyridyls are maintained, which enable the configurationally locked compounds 2 and 4 to act as fluorescent indicators for zinc(II) ions in laser confocal microscopic imaging experiments.
EXPERIMENTAL SECTION
1. Materials and General Methods
Reagents and solvents were purchased from various commercial sources and used without further purification unless otherwise stated. Spectroscopic grade solvents were used in the UV–vis and fluorescence spectroscopic measurements. All reactions were carried out in oven- or flame-dried glassware in an inert atmosphere of argon. Analytical thin-layer chromatography (TLC) was performed using precoated TLC plates with silica gel 60 F254. Flash column chromatography was performed using silica (230–400 mesh) gel as the stationary phases. 1H and 13C NMR spectra were acquired on 300 MHz and 500 MHz instruments, with frequencies indicated in the synthetic procedures. All chemical shifts were reported in δ units relative to tetramethylsilane. CDCl3 was treated with alumina gel prior to use to remove trace acids. High resolution mass spectra (HRMS) were obtained using a time-of-flight (TOF) analyzer.
2. Syntheses and Characterizations
Compound 7
In the presence of t-BuOK (29 mg, 0.26 mmol), compounds 5 (271 mg, 1.38 mmol) and 6 (424 mg, 1.32 mmol) were dissolved in dry THF (10 mL) in a round-bottom flask equipped with a magnetic stir bar. The reaction mixture was stirred overnight. Afterward, water was added to quench the reaction and the solution was partitioned between water and EtOAc. The organic layer was dried over Na2SO4 and then concentrated under reduced pressure. The crude product was fractionated on a silica gel column, and the product 7 was isolated in a 80% yield (384 mg) using CH2Cl2/EtOAc (0–30%) as the eluent. 1H NMR (300 MHz, CDCl3) δ/ppm 8.72 (d, J = 2.3 Hz, 1H), 8.49 (s, 1H), 8.33 (d, J = 8.3 Hz, 1H), 8.28 (d, J = 8.1 Hz, 1H), 7.95 (dd, J = 8.4, 2.3 Hz, 1H), 7.60 (dd, J = 8.2, 2.2 Hz, 1H), 7.57–7.47 (m, 2H), 7.01 (d, J = 16.6 Hz, 1H), 6.73 (d, J = 2.5 Hz, 1H), 6.59 (dd, J = 8.6, 2.5 Hz, 1H), 5.26 (s, 2H), 3.81 (s, 3H), 3.52 (s, 3H), 2.38 (s, 3H); 13C NMR (75 MHz, CDCl3) δ/ppm 161.0, 156.1, 154.7, 153.7, 149.8, 148.1, 137.6, 133.8, 133.3, 133.2, 127.5, 125.4, 123.2, 120.7, 120.6, 119.7, 107.5, 101.7, 95.1, 56.4, 55.6, 18.5; HRMS (CI+): calcd 363.1709 (C22H23O3N2 + H+), found 363.1709.
Compound 8
TsOH·H2O (312 mg, 1.64 mmol) was added to a solution of compound 7 (300 mg, 0.828 mmol) in MeOH (10 mL) in a round-bottom flask equipped with a magnetic stir bar. The reaction mixture was stirred for overnight. The solvent was removed under reduced pressure, and the residue was washed with water, followed by trituration with ether. Compound 8 was isolated in a 90% yield (237 mg) without further purification. 1H NMR (500 MHz, DMSO-d6) δ/ppm 9.98 (s, 1H), 8.74 (s, 1H), 8.52 (s, 1H), 8.34 (d, J = 8.3 Hz, 1H), 8.29 (d, J = 8.1 Hz, 1H), 8.10 (d, J = 8.5 Hz, 1H), 7.76 (d, J = 8.3 Hz, 1H), 7.55 (d, J = 9.1 Hz, 1H), 7.50 (d, J = 16.3 Hz, 1H), 7.19 (d, J = 16.6 Hz, 1H), 6.47 (s, 2H), 3.74 (s, 3H), 2.37 (s, 3H); 13C NMR (125 MHz, DMSO-d6) δ/ppm 160.8, 157.0, 153.8, 153.1, 150.0, 148.1, 138.0, 133.8, 133.2, 128.5, 126.4, 122.0, 120.5, 120.2, 117.0, 106.1, 101.7, 55.5, 18.3; HRMS (EI+): calcd 318.1368 (C20H18N2O2) found 318.1347.
Compound 2
To a solution of 8 (300 mg, 0.942 mmol) in THF (50 mL) in a round-bottom flask equipped with a magnetic stir bar were added anhydrous K2CO3 (651 mg, 4.71 mmol) and I2 (1.2 g, 4.7 mmol). The mixture was stirred at rt for 5 h. The resulting solution was poured into a saturated NaHCO3 solution (20 mL) and treated with a saturated Na2S2O3 solution to remove the unreacted iodine. Extraction with EtOAc afforded the organic layer that was dried and concentrated. The crude solid was chromatographed on a silica gel column using EtOAc as the eluent. Compound 2 was isolated in a 95% yield (283 mg). 1H NMR (300 MHz, CDCl3) δ/ppm 9.10 (d, J = 2.1 Hz, 1H), 8.52 (d, J = 2.0 Hz, 1H), 8.44 (d, J = 8.4 Hz, 1H), 8.33 (d, J = 8.1 Hz, 1H), 8.18 (dd, J = 8.3, 2.2 Hz, 1H), 7.64 (dd, J = 8.0, 2.2 Hz, 1H), 7.48 (dd, J = 8.6, 1.3 Hz, 1H), 7.10 (s, 2H), 6.90 (dd, J = 8.5, 2.2 Hz, 1H), 3.89 (s, 3H), 2.41 (s, 3H); 13C NMR (75 MHz, CDCl3) δ/ppm 158.7, 156.4, 155.4, 153.3, 152.5, 149.8, 145.4, 137.6, 133.6, 132.2, 126.4, 122.3, 121.4, 120.8, 120.7, 112.6, 102.9, 96.0, 55.9, 18.5; HRMS (EI+): calcd 316.1212 (C20H16N2O2) found 316.1204.
Compound 1027
To a solution of 3-methoxythiophene 9 (1.0 g, 8.8 mmol) in THF (10 mL) at −78 °C was added n-BuLi (3.9 mL of 2.5 M solution in hexanes, 9.7 mmol). After stirring for 1 h, DMF (0.8 mL, 0.01 mol) was added. The solution was stirred for 1 h at rt, and water was added. The crude product 3-methoxythiophene-2-carbaldehyde 10 was obtained by extraction with CH2Cl2. The organic portions were dried over Na2SO4 before concentration under vacuum. The residue was chromatographed on silica gel using CH2Cl2 to obtain a pure product as a yellow solid in a 40% yield (500 mg). 1H NMR (300 MHz, CDCl3): δ/ppm 9.96 (s, 1H), 7.63 (d, J = 5.4 Hz, 1H), 6.85 (d, J = 5.4 Hz, 1H), 3.97 (s, 1H).
Compound 1127
To a solution of 3-methoxythiophene-2-carbaldehyde 10 (0.50 g, 3.5 mmol) in CH2Cl2 (20 mL) at 0 °C was added BBr3 (4.2 mL of 1 M solution in heptane, 4 mmol) slowly. After being stirred for 1 day at rt, water was added to the reaction mixture. Product was extracted by CH2Cl2. After silica column chromatography, the pure product was obtained as a brown amorphous solid in a 75% yield (336 mg). 1H NMR (300 MHz, CDCl3): δ/ppm 10.72 (s, 1H), 9.64 (s, 1H), 7.60 (d, J = 5.3 Hz, 1H), 6.78 (d, J = 5.3 Hz, 1H).
Compound 12
To a solution of 3-hydroxythiophene-2-carbaldehyde 11 (336 mg, 2.63 mmol) and DIPEA (596 μL, 3.42 mmol) in THF (5 mL) at 0 °C was added MOMBr (279 μL, 3.42 mmol) over a 5 min period. The solution was stirred overnight, and then diluted with EtOAc (25 mL), washed with saturated brine (3 × 25 mL), dried over Na2SO4, and filtered. The solvent was removed under vacuum to yield an orange oil. Silica chromatography (eluted by CH2Cl2, isocratic) yielded the pure aldehyde 12 as a yellow oil in a 95% yield (430 mg). 1H NMR (500 MHz, CDCl3) δ/ppm 10.05 (s, 1H), 7.62 (d, J = 5.4 Hz, 1H), 7.00 (d, J = 5.4 Hz, 1H), 5.25 (s, 2H), 3.54 (s, 3H); 13C NMR (125 MHz, CDCl3) δ/ppm 181.7, 162.3, 135.0, 123.2, 118.4, 96.4, 56.9; HRMS (ESI+): calcd 195.0092 (C7H8O3S + Na+) found 195.0100.
Compound 13
A flame-dried flask was charged with dry THF (20 mL) and 6 (577 mg, 1.80 mmol) and cooled to −78 °C. Compound 12 (310 mg, 1.80 mmol) and KHMDS (4.0 mL of 0.5 M in toluene, 2 mmol) were added dropwise sequentially. The mixture turned dark reddish after 15 min. The temperature was then slowly raised to rt in 2 h. The reaction mixture was poured into icy saturated brine and extracted with CH2Cl2. The organic portions were washed with saturated brine and dried over Na2SO4. The olefin product 13 as a yellow solid was obtained after fractionation on a silica column eluted by 50% EtOAc in CH2Cl2 in a 66% yield (404 mg). 1H NMR (500 MHz, CDCl3) δ/ppm 8.69 (d, J = 2.2 Hz, 1H), 8.51 (dd, J = 1.5, 0.7 Hz, 1H), 8.33 (d, J = 8.4 Hz, 1H), 8.29 (d, J = 8.1 Hz, 1H), 7.93 (dd, J = 8.4, 2.3 Hz, 1H), 7.62 (dd, J = 8.1, 2.2 Hz, 1H), 7.43 (d, J = 16.3 Hz, 1H), 7.13 (d, J = 5.5 Hz, 1H), 6.96 (d, J = 5.5 Hz, 1H), 6.83 (d, J = 16.3 Hz, 1H), 5.18 (s, 2H), 3.54 (s, 3H), 2.40 (s, 3H); 13C NMR (125 MHz, CDCl3) δ/ppm 154.8, 153.7, 153.1, 149.8, 147.9, 137.6, 133.4, 133.2, 133.0, 123.6, 122.3, 122.1, 120.8, 120.7, 119.3, 96.6, 56.5, 18.6; HRMS (ESI+): calcd 361.0987 (C19H18N2O2S + Na+) found 361.0980.
Compound 14
TsOH·H2O (456 mg, 2.40 mmol) was added to a solution of compound 13 (404 mg, 1.20 mmol) in MeOH (5 mL). The reaction mixture was stirred overnight. The solvent was removed under reduced pressure, and the residue was diluted with CH2Cl2 followed by neutralization by a saturated NaHCO3 solution. The organic layer was collected and concentrated under vacuum. Compound 14 was isolated via silica chromatography (eluted by 1% MeOH in CH2Cl2) as a brown solid in a 99% yield (349 mg). 1H NMR (500 MHz, DMSO-d6) δ/ppm 10.13 (s, 1H), 8.72 (d, J = 2.2 Hz, 1H), 8.51 (d, J = 2.2 Hz, 1H), 8.31 (d, J = 8.4 Hz, 1H), 8.27 (d, J = 8.1 Hz, 1H), 8.07 (dd, J = 8.4, 2.2 Hz, 1H), 7.74 (dd, J = 8.1, 2.2 Hz, 1H), 7.53 (d, J = 16.2 Hz, 1H), 7.34 (d, J = 5.4 Hz, 1H), 6.74 (d, J = 16.2 Hz, 1H), 6.70 (d, J = 5.4 Hz, 1H), 2.36 (s, 3H); 13C NMR (125 MHz, DMSO-d6) δ/ppm 154.1, 153.3, 152.6, 149.5, 147.4, 137.5, 133.4, 133.3, 132.5, 124.4, 121.4, 120.8, 120.1, 119.8, 119.4, 115.6, 17.8; HRMS (ESI+): calcd 295.0905 (C17H14N2OS + H+) found 295.0894.
Compound 4
To a solution of compound 14 (156 mg, 0.531 mmol) in THF (10 mL) were added anhydrous K2CO3 (375 mg, 2.72 mmol) and I2 (691 mg, 2.72 mmol). The mixture was stirred at rt for 5 h. The resulting solution was poured into a saturated NaHCO3 solution (20 mL) and treated with a saturated Na2S2O3 solution to remove the unreacted iodine. Extraction with EtOAc afforded the organic layer that was dried and concentrated. The crude solid was chromatographed on a silica gel column using EtOAc as the eluent. Compound 4 was isolated as light yellow solid in a 95% yield (147 mg). 1H NMR (500 MHz, CDCl3) δ/ppm 9.05 (d, J = 2.2 Hz, 1H), 8.53 (d, J = 2.2 Hz, 1H), 8.43 (d, J = 8.4 Hz, 1H), 8.32 (d, J = 8.1 Hz, 1H), 8.12 (dd, J = 8.4, 2.2 Hz, 1H), 7.65 (dd, J = 8.1, 2.2 Hz, 1H), 7.26 (d, J = 5.3 Hz, 1H), 7.15 (s, 1H), 7.14 (d, J = 5.3 Hz, 1H), 2.42 (s, 3H); 13C NMR (75 MHz, CDCl3) δ/ppm 158.5, 155.2, 154.9, 153.4, 149.9, 144.9, 137.7, 133.7, 131.8, 126.9, 126.6, 125.3, 120.9, 120.8, 111.1, 102.8, 18.6; HRMS (ESI+): calcd 293.0749 (C17H12N2OS + H+) found 293.0750.
3. Zinc(II) Titration in Absorption and Emission Modes
Spectrophotometric and fluorometric titrations were conducted on a UV−vis spectrophotometer and a fluorometer, respectively, with a 1 cm semimicro quartz cuvette capped with a septum. The previously published zinc(II) titration procedure was followed.44 The pH titration also followed a previously published procedure.44
4. Fluorescence Quantum Yield Measurements
All samples were degassed by bubbling argon through before recording the absorption and emission. Absorbance at the excitation wavelength was kept below 0.1 to minimize the inner-filter effect. The fluorescence quantum yields were determined by comparing the integrated area of the corrected emission spectrum with that of the reference quinine bisulfate (ϕf = 0.54 in 1 N H2SO4).45
5. Fluorescence Lifetime Measurements
The lifetime values were collected using the time-correlated single photon counting (TCSPC) technique. Compounds 1–4 and their zinc(II) complexes were excited using the 370 nm LED. The LED operated at a repetition rate of 1 MHz. The data were recorded with a bandwidth of 4 nm and 10 000 counts in the peak channel. The time scale of the experiment was 100 ns (115.3 ps/channel).
6. Cell Culture and Confocal Fluorescence Microscopy
HeLa S3 cells were seeded and grown directly in Delta T open culture dishes for at least 24 h to approximately 70–80% confluency. The culture medium was a 1:1 mixture of DMEM and Ham's F-12, supplemented with 12.5% cosmic calf serum, 0.01% (w/v) sodium pyruvate, 0.05% (w/v) l-glutamine, 0.12% (w/v) sodium bicarbonate, and 1% (v/v) penicillin/streptomycin and finally adjusted to a pH of 7.9. In preparation for imaging, cells were rinsed twice with fresh culture medium and then incubated with the appropriate dye at a concentration of 2 μM, diluted in fresh culture medium, for 30 min at 5% CO2, 95% humidity, and 37 °C. Following incubation with dye, the cells were quickly rinsed twice in fresh culture medium and then incubated with 50 μM sodium pyrithione and either 50 or 0 μM ZnCl2 diluted in fresh culture medium for an additional 10 min. During this time, the Delta T culture vessel is loaded into the microscope incubation chamber stage insert.
Confocal fluorescence microscopy was performed using a confocal laser point-scanning system on an inverted microscope stand. Imaging was performed using an NA = 1.4 oil immersion objective and 405 nm diode laser line. Green fluorescence from the tested compounds was detected between 530 and 570 nm using a variable bandpass filter to isolate the waveband of interest from spectrally dispersed emission light. Video microscopy was performed using continuous acquisition at constant laser power and other settings, including the laser excitation power, PMT voltage, gain register, pixel dwell time, pixel depth, and offset. Photobleaching was evaluated by drawing an ROI around each cell, with cell boundaries determined using the brightfield DIC image and not fluorescence. Background fluorescence was determined using an ROI over part of the image not occupied by any cells and subsequently subtracted. Next, the change in absolute intensity in each ROI (N = 21) was determined and averaged for each time point, with representative images provided by Figures 6 and 7, and plotted in Figure 8.
Supplementary Material
ACKNOWLEDGMENTS
This work was supported by the National Institute of General Medical Sciences (R01GM081382).
Footnotes
Supporting Information Additional spectra; 1H and 13C NMR spectra of new compounds. The Supporting Information is available free of charge on the ACS Publications website at DOI: 10.1021/acs.joc.5b00503.
Author Contributions The manuscript was written through contributions of all authors. All authors have given approval to the final version of the manuscript.
The authors declare no competing financial interest.
REFERENCES
- (1).Frederickson CJ. Int. Rev. Neurobiol. 1989;31:145–238. doi: 10.1016/s0074-7742(08)60279-2. [DOI] [PubMed] [Google Scholar]
- (2).Vallee BL, Falchuk KH. Physiol. Rev. 1993;73:79–118. doi: 10.1152/physrev.1993.73.1.79. [DOI] [PubMed] [Google Scholar]
- (3).Berg JM, Shi Y. Science. 1996;271:1081–1085. doi: 10.1126/science.271.5252.1081. [DOI] [PubMed] [Google Scholar]
- (4).Maret W. BioMetals. 2001;14:187–190. [Google Scholar]
- (5).Maret W, Li Y. Chem. Rev. 2009;109:4682–4707. doi: 10.1021/cr800556u. [DOI] [PubMed] [Google Scholar]
- (6).Colvin RA, Holmes WR, Fontaine CP, Maret W. Metallomics. 2010;2:306–317. doi: 10.1039/b926662c. [DOI] [PubMed] [Google Scholar]
- (7).Hambidge M, Cousins RJ, Costello RB. J. Nutr. 2000;130:1341S–1343S. doi: 10.1093/jn/130.5.1341S. [DOI] [PubMed] [Google Scholar]
- (8).Frederickson CJ, Koh J-Y, Bush AI. Nat. Rev. Neurosci. 2005;6:449–462. doi: 10.1038/nrn1671. [DOI] [PubMed] [Google Scholar]
- (9).Murphy DB, Davidson MW. Fundamentals of Light Microscopy and Electronic Imaging. 2nd ed. Wiley-Blackwell; Hoboken, NJ: 2013. [Google Scholar]
- (10).Grynkiewicz G, Poenie M, Tsien RY. J. Biol. Chem. 1985;260:3440–3450. [PubMed] [Google Scholar]
- (11).Minta A, Kao JPY, Tsien RY. J. Biol. Chem. 1989;264:8171–8178. [PubMed] [Google Scholar]
- (12).Tomat E, Lippard SJ. Curr. Opin. Chem. Biol. 2010;14:225–230. doi: 10.1016/j.cbpa.2009.12.010. [DOI] [PMC free article] [PubMed] [Google Scholar]
- (13).Xu Z, Yoon J, Spring DR. Chem. Soc. Rev. 2010;39:1996–2006. doi: 10.1039/b916287a. [DOI] [PubMed] [Google Scholar]
- (14).Pluth MD, Tomat E, Lippard SJ. Annu. Rev. Biochem. 2011;80:333–355. doi: 10.1146/annurev-biochem-061009-091643. [DOI] [PMC free article] [PubMed] [Google Scholar]
- (15).Liu Z, He W, Guo Z. Chem. Soc. Rev. 2013;42:1568–1600. doi: 10.1039/c2cs35363f. [DOI] [PubMed] [Google Scholar]
- (16).Zhu L, Yuan Z, Sreenath K, Simmons JT. RSC Adv. 2014;4:20398–20440. doi: 10.1039/C4RA00354C. [DOI] [PMC free article] [PubMed] [Google Scholar]
- (17).Lim NC, Freake HC, Brückner C. Chem.—Eur. J. 2005;11:38–49. doi: 10.1002/chem.200400599. [DOI] [PubMed] [Google Scholar]
- (18).Carol P, Sreejith S, Ajayaghosh A. Chem.—Asian J. 2007;2:338–348. doi: 10.1002/asia.200600370. [DOI] [PubMed] [Google Scholar]
- (19).Demchenko AP. J. Fluoresc. 2010;20:1099–1128. doi: 10.1007/s10895-010-0644-y. [DOI] [PubMed] [Google Scholar]
- (20).Wilson JN, Bunz UHF. J. Am. Chem. Soc. 2005;127:4124–4125. doi: 10.1021/ja050017n. [DOI] [PubMed] [Google Scholar]
- (21).Zucchero AJ, Wilson JN, Bunz UHF. J. Am. Chem. Soc. 2006;128:11872–11881. doi: 10.1021/ja061112e. [DOI] [PubMed] [Google Scholar]
- (22).Younes AH, Zhang L, Clark RJ, Zhu L. J. Org. Chem. 2009;74:8761–8772. doi: 10.1021/jo901889y. [DOI] [PubMed] [Google Scholar]
- (23).Younes AH, Zhang L, Clark RJ, Davidson MW, Zhu L. Org. Biomol. Chem. 2010;8:5431–5441. doi: 10.1039/c0ob00482k. [DOI] [PMC free article] [PubMed] [Google Scholar]
- (24).Boehlow TR, Harburn JJ, Spilling CD. J. Org. Chem. 2001;66:3111–3118. doi: 10.1021/jo010015v. [DOI] [PubMed] [Google Scholar]
- (25).Zhang L, Clark RJ, Zhu L. Chem.—Eur. J. 2008;14:2894–2903. doi: 10.1002/chem.200701419. [DOI] [PubMed] [Google Scholar]
- (26).Duan X-F, Zeng J, Zhang Z-B, Zi G-F. J. Org. Chem. 2007;72:10283–10286. doi: 10.1021/jo7019652. [DOI] [PubMed] [Google Scholar]
- (27).Jeong Y-C, Ahn D-J, Lee W-S, Lee S-H, Ahn K-H. Bull. Korean Chem. Soc. 2011;32:1063–1066. [Google Scholar]
- (28).Suppan P, Ghoneim N. Solvatochromism. The Royal Society of Chemistry; London: 1997. [Google Scholar]
- (29).Painelli A, Terenziani F. J. Phys. Chem. A. 2000;104:11041–11048. [Google Scholar]
- (30).Kosower EM. Acc. Chem. Res. 1982;15:259–266. [Google Scholar]
- (31).Rettig W. Angew. Chem., Int. Ed. Engl. 1986;25:971–988. [Google Scholar]
- (32).Sissa C, Calabrese V, Cavazzini M, Grisanti L, Terenziani F, Quici S, Painelli A. Chem.—Eur. J. 2013;19:924–935. doi: 10.1002/chem.201202154. [DOI] [PubMed] [Google Scholar]
- (33).Olsen SJ. Phys. Chem. B. 2015;119:2566–2575. doi: 10.1021/jp508723d. [DOI] [PubMed] [Google Scholar]
- (34). To replicate the ratiometric response as shown in the titration experiments in acetonitrile, the excitation wavelength would have to be in the UV region, which would not be suitable for the following confocal fluorescence microscopy experiments.
- (35).Patton C, Thompson S. Epel, D. Cell Calcium. 2004;35:427–431. doi: 10.1016/j.ceca.2003.10.006. [DOI] [PubMed] [Google Scholar]
- (36).Zinc(II) is able to bind bipy to form complexes of ZnL up to ZnL3, depending on counter ion and/or solvent. Under metal-buffered conditions, it is conceivable that bipy binds zinc(II) together with a metal buffer ligand to form a ternary complex, which would also contribute to the observed emission and consequently the emission dependency on metal buffer. This scenario is realistic and similar to the formation of protein·zinc(II)·indicator ternary complexes that were characterized by Petering and co-workers Meeusen JW, Tomasiewicz H, Nowakowski A, Petering DH. Inorg. Chem. 2011;50:7563–7573. doi: 10.1021/ic200478q.
- (37).Kuang G-C, Allen JR, Baird MA, Nguyen BT, Zhang L, Morgan TJJ, Levenson CW, Davidson MW, Zhu L. Inorg. Chem. 2011;50:10493–10504. doi: 10.1021/ic201728f. [DOI] [PMC free article] [PubMed] [Google Scholar]
- (38).Sreenath K, Allen JR, Davidson MW, Zhu L. Chem. Commun. 2011;47:11730–11732. doi: 10.1039/c1cc14580k. [DOI] [PMC free article] [PubMed] [Google Scholar]
- (39).Sreenath K, Yuan Z, Allen JR, Davidson MW, Zhu L. Chem.—Eur. J. 2015;21:867–874. doi: 10.1002/chem.201403479. [DOI] [PMC free article] [PubMed] [Google Scholar]
- (40).Irving H, Williams RJP. Nature. 1948;162:746–747. [Google Scholar]
- (41).Forbes IJ, Zalewski PD, Hurst NP, Giannakis C, Whitehouse MW. FEBS Lett. 1989;247:445–447. doi: 10.1016/0014-5793(89)81388-2. [DOI] [PubMed] [Google Scholar]
- (42).Qin Y, Miranda JG, Stoddard CI, Dean KM, Galati DF, Palmer AE. ACS Chem. Biol. 2013;8:2366–2371. doi: 10.1021/cb4003859. [DOI] [PMC free article] [PubMed] [Google Scholar]
- (43).Maret W. Metallomics. 2015;7:202–211. doi: 10.1039/c4mt00230j. [DOI] [PubMed] [Google Scholar]
- (44).Simmons JT, Allen JR, Morris DR, Clark RJ, Levenson CW, Davidson MW, Zhu L. Inorg. Chem. 2013;52:5838–5850. doi: 10.1021/ic302798u. [DOI] [PMC free article] [PubMed] [Google Scholar]
- (45).Fery-Forgues S, Lavabre D. J. Chem. Educ. 1999;76:1260–1264. [Google Scholar]
Associated Data
This section collects any data citations, data availability statements, or supplementary materials included in this article.


