Abstract
We previously reported that rats increase meal size upon initial presentation of a calorically dense diet. The increase may be attributed to increased orosensory stimulation and/or reduced sensitivity to post-ingestive inhibitory signals. During feeding both types of signals are simultaneously in play thus here, we compare responses in rats presented a high-energy diet (HE) or 45% high-fat diet (HF) with those of chow-fed controls (CHOW) in a sham-feeding procedure in which post-ingestive feedback is minimized. Measures of sham-feeding to sucrose were taken before diet manipulation (baseline), ~5 days (dynamic phase) and ~ 6 weeks (static phase) following introduction of the palatable diet, as well as after animals were switched back to standard chow (recovery phase). Some but not all the hypotheses based on our previous findings were confirmed by the outcomes here. Consistent with our hypothesis that enhanced orosensory stimulation during the dynamic phase compared with the static phase would generalize to increased intake of other palatable stimuli, HE rats showed higher sucrose intake during the dynamic phase compared with the static phase. Contrary to what we hypothesized, HE and HF rats did not increase responses to sucrose compared to CHOW rats. In fact, HE rats showed decreased responses compared to CHOW controls. Thus changes in orosensory stimulation do not necessarily generalize to increased intake of other palatable stimuli.
Keywords: high fat, calorie dense, palatability, sweet, taste, post-ingestive, oral
Introduction
Diet induced obesity (DIO) is a model in which animals will overeat and consequently gain weight when presented a calorie-dense diet. The DIO model provides an experimental analogy for the overconsumption of high fat/high sugar foods that lead to obesity in the human population. In hypothalamic-lesioned rats, the development of obesity can be characterized by an initial rapid rate of food intake, which has been referred to as the dynamic phase, followed by a static phase characterized by a plateau in intake (see Brobeck, 1946). We previously showed that when presented a calorically dense diet (45% fat, D12451, Research Diets; 4.73 kcal/g), rats displayed hyperphagia driven primarily by an increase in meal size. This was most pronounced across the first several days thus characterizing the dynamic phase. With continued access to the palatable, calorically dense diet, intake and meal size decreased but remained significantly higher than that of chow-fed controls thus marking the static phase. Across both dynamic and static phases, meal number decreased but was insufficient to compensate for the increased meal size. Finally, the recovery phase is characterized by behavior that follows when the high-energy diet is switched back to standard chow diet. Daily intake and meal size decreased and eventually returned to values comparable to chow-fed controls. Meal number remained lower suggesting exposure to the calorically dense diet elicited changes in physiological mechanism(s) that underlie ingestive behavior control (Treesukosol and Moran, 2013a).
The direct controls of meal size can be conceptualized as providing positive or negative feedback that maintain or terminate eating behavior respectively (see Smith, 1996). Positive signals can be triggered by contact with gustatory, olfactory and somatosensory receptors in the oral cavity. Positive signals can also be induced by gastrointestinal nutrients, as demonstrated by the learned associations between pairings of oral flavors and gastrointestinal nutrients (Sclafani, 2001). Negative feedback can be elicited by contact with receptors in the oral cavity and post-ingestive receptors in the stomach and small intestine (Davis and Smith, 1990; Davis et al., 1993). Thus the increase in meal size observed in animals presented a high-energy diet can be attributed to increased positive orosensory stimulation and/or reduced sensitivity to post-ingestive inhibitory signals. It follows that changes in ingestive behavior, particularly meal size across the development of DIO, are driven by alterations in the relative contributions of these orosensory and postoral signals, yet these issues remain poorly understood.
One barrier to understanding the relative contributions of these excitatory and inhibitory signals is that during real feeding, both types of signals are simultaneously in play. Sham-feeding is a technique that allows for some experimental segregation of orosensory and post-ingestive stimulation. The procedure involves allowing the animal to ingest a food or fluid and then preventing accumulation in the stomach by draining the fluid from a fistula via a cannula implanted in the stomach. Thus intake with minimized negative post-ingestive feedback can be measured. Studies that have utilized sham-feeding in the rat have collectively shown that sham-fed meals are larger than real-fed meals thus suggesting that post-ingestive cues terminate eating under real feeding conditions. Data obtained from sham-feeding techniques have also provided evidence for the role of orosensory stimulation in determining rate and duration of feeding (e.g. Davis and Campbell, 1973; Kraly et al., 1978; Mook, 1963; Weingarten and Watson, 1982; Young et al., 1974). This procedure could thus shed light on how the relative contributions of these excitatory and inhibitory signals change across the development of DIO.
Here, sham-feeding intake measures to three concentrations of sucrose were taken in rats at four different time points: prior to (Test 1; baseline), following ~5 days (Test 2; dynamic) and ~ 6 weeks (Test 3; static) exposure to a calorically dense diet and finally ~5 days after being returned to a standard chow diet (Test 4; recovery). Two cohorts were presented either a combination of a high-energy pellet and liquid diet (HE) or a 45% high-fat diet (HF) and sham-feeding measures were compared to those of the control groups maintained on a standard chow diet (CHOW). The high-energy pellet (4.41 kcal/g) and liquid (Ensure Nutrition Shake, 1.48 kcal/ml) diet has been previously presented to rats to investigate models of diet induced obesity (Levin and Dunn-Meynell, 2002). The 45% high-fat diet contains a fat content comparable to that of western diets in human populations (Drewnowski and Popkin, 1997). The diet does not include a liquid component and was used in our previously reported meal pattern analysis study (Treesukosol and Moran, 2013a). We hypothesized that enhanced orosensory stimulation elicited by exposure to the calorically dense diets would generalize to increased responsiveness to other palatable stimuli such that sham-feeding intake of sucrose should be higher in HE and HF animals compared to intake in CHOW controls. Next, since we previously showed that meal size is larger during the dynamic phase compared with that observed in the static phase of calorically dense diet exposure, we predicted that HE and HF groups would show increased sham-feeding intake of sucrose during dynamic testing compared with responses in static testing. Finally, any group differences in sham-feeding measures after switching back to a standard chow diet would provide information about alterations as a function of previous exposure to a calorically dense diet.
Methods
Subjects
Two cohorts, each of twenty-one male Sprague Dawley rats (Harlan) ~275–300 g in body weight upon arrival were single-housed with ad libitum access to chow (2018 Teklad, Harlan; 3.1 kcal/g) and water, except where noted. All procedures were approved by the Institutional Animal Care and Use Committee at The Johns Hopkins University.
Surgery
After 1 week acclimatization to the laboratory environment, all animals underwent surgery for gastric fistula implantation as previously described (Smith, 1998). Rats were anesthetized with a mixture of ketamine hydrochloride (100 mg/kg) and xylazine (20 mg/kg) delivered via intraperitoneal injection. Supplemental doses were administered as necessary. The circular base of the cannula was secured in the stomach and held in place with surgical mesh and sutures. The shaft of the cannula was exteriorized through an incision in the abdominal wall and skin. Animals regained body weight 1–5 days following surgery. At least 2 weeks was allowed after surgery for recovery before testing began.
Behavioral Procedure
Training and testing sessions for any particular phase were conducted across consecutive days. Animals were mildly food deprived (~2 h) shortly after the onset of the light cycle, before a sham-feeding session. Preceding each session, animals were removed from their home-cages and had their stomachs flushed via the gastric cannula with lukewarm water until the gastric drainage was clear similar to what has been done so previously (Liang et al., 2006; Liang et al., 2012). Collecting tubes were attached to the external end of the open cannula and threaded through a slot that ran along the middle of the testing cage floor. The collecting tube allowed the gastric contents to drain into a container placed underneath the cage. A single sucrose solution was presented via a 100 ml glass Richter feeding tube attached to the front of the testing cage, from which time the 60-min sham feeding session began. Intake measurements were recorded every 5 minutes to the nearest 1 ml. At the end of the session, animals were removed from the testing cage, the collecting tube was removed and the gastric fistula was closed up. The drainage after each sham-feeding session was measured and drainage volume of equal or more than the amount consumed by the rat was indicative of what was considered a successful sham-feeding test. The rats were returned to their home cage and ~ 1 h after returning, food was placed back into the home cage.
Experimental Design
Each phase of testing was preceded by at least 1 sham-feeding training session with 0.3 M sucrose followed by the presentation of 0.03, 0.03, 0.3, 0.3, 1.0 and 1.0 M sucrose (Sigma Aldrich, St. Louis MO) across 6 consecutive sham-feeding test days. On each sham-feeding day, a single sucrose concentration was presented for 1 h. All solutions were prepared with distilled water and presented at room temperature.
Four phases of testing were conducted (Table 1). For one cohort of animals, after Test 1 (baseline), animals were assigned to one of two groups (CHOW and HE) so that there were no significant differences in body weight on the final day of Test 1 or in total intake across the three sucrose concentrations. The HE group was presented with ad libitum access to a high energy diet (D12266B, Research Diets; 4.41 kcal/g) and a liquid diet supplement (Ensure Nutrition Shake, Abbott Nutrition; 1.48 kcal/ml) (Levin and Dunn-Meynell, 2002) after the last day of Test 1 testing. The CHOW group remained on ad libitum access to standard laboratory chow (2018 Tekland, Harlan; 3.1 kcal/g). Test 2 (dynamic) for both groups was conducted after the HE group had been on the new diet for 5 days. Test 3 (static) training and testing occurred after ~6 weeks following the diet switch. After the last day of Test 3 testing, the HE group was returned to a standard chow diet. Following 5 days after the diet reversal, Test 4 (recovery) testing was conducted.
Table 1.
Experimental design
| Group | |||
|---|---|---|---|
| Test | CHOW | HE or HF | Time on diet after testing begins |
| TEST 1: baseline | Standard chow | Standard chow | Upon arrival |
| TEST 2: dynamic | Standard chow | High-energy diet + Ensure or 45% high-fat diet |
5 days |
| TEST 3: static | Standard chow | High-energy diet + Ensure or 45% high-fat diet |
6 weeks |
| TEST 4: recovery | Standard chow | Standard chow | 5 days |
In a second cohort, animals were assigned to one of two groups (CHOW and HF) where the HF group was presented ad libitum access to a 45% high fat diet (D12451, Research Diets; 4.73 kcal/g) but no liquid diet. The same four phases of testing were conducted as described above.
Data Analysis
During the experiment, the gastric fistulas became compromised for some animals. Data from these animals were removed. If this occurred during a test phase, data from that animal was removed for the entire test phase.
At each test phase, the mean intake for a given animal at each measured time point was calculated by collapsing data across the two test sessions of a given concentration. Data for the HE and HF groups were compared with that of their respective control CHOW groups. Furthermore, the mean total sham-feeding intake across the 60-min sessions for an individual HE or HF animal was divided by the group mean intake of their respective control group such that a ratio value for each HE or HF rat was obtained. Given the baseline differences between cohorts, these values provide a measure that is indicative of changes in the experimental groups as a proportion of their respective controls. A ratio value of 1.0 indicates equal intake between the HE or HF groups and their CHOW controls. A ratio value of 0 indicates no sham-feeding intake in an experimental animal.
Curves were fit to individual animal data at 1.0 M sucrose and mean data for each group at 0.3 M and 1.0 M sucrose by using the following function:
where x = time, y = cumulative intake, a = asymptotic intake and b = time taken for ~63% of total intake, thus giving an indication of rate of intake. A smaller b value indicates a faster rate of intake. Intake values of the two groups were compared using t-tests. Paired t-tests with Bonferroni corrections were used to compare given parameter values derived from data of a given group across test phases. Curves were not fit for data of individual animals that did not drink during these sham-feeding sessions at a particular concentration but data from all animals were included for mean intake analyses. The statistical rejection criterion of 0.05 was used for all analyses.
Two-bottle test
Behavioral Procedure
To assess relative responses to the stimuli following exposure throughout the experiment, Ensure and sucrose solutions were presented in polypropylene plastic tubes attached via rubber stoppers to drinking tubes with orifice size ~2.7 mm. These were presented by inserting the straight sipper-tube between the metal bars of the animal’s home cage. After the last day of sham-feeding testing, the rats were habituated to drinking from these sipper-tubes with ad libitum access to water for at least two days. For testing, one bottle was filled with Ensure and the other with a sucrose solution (0.3 or 1.0 M). First Ensure vs. 0.3 M sucrose was presented for 2 consecutive days, followed by Ensure vs. 1.0 M sucrose for 2 additional consecutive days. Intake was measured and the bottle positions were presented in an ABBA order across the 4 days.
Data analysis
Sham-feeding intake of a given sucrose concentration and intake of Ensure and sucrose in the two-bottle tests at a given sucrose concentration, did not significantly differ across each two consecutive days for a given animal. Thus, the average intake across each of these two days was taken for analysis. For each group, paired t-tests were used to compare relative intake of Ensure and sucrose solution. Two-sample t-tests were used to compare the intake and preference ratio values across groups. Preference ratio was calculated as follows:
The statistical rejection criterion of 0.05 was used for all analyses.
Results
Caloric intake and body weight gain
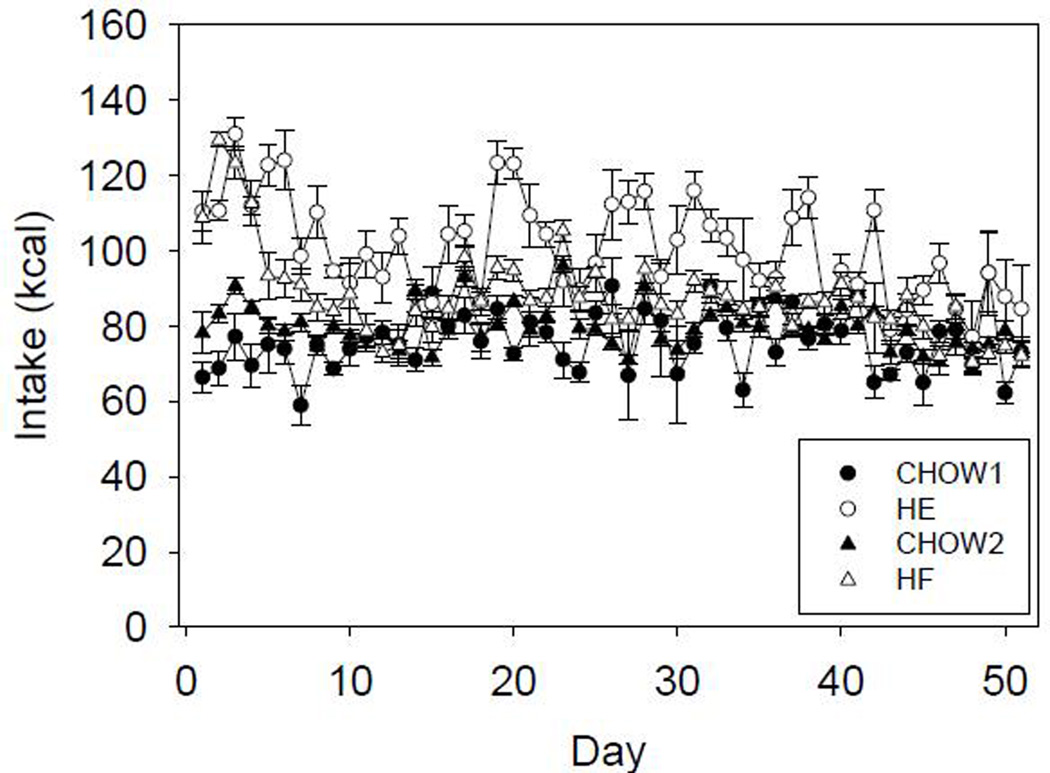
Caloric intake for the HE and HF groups was significantly higher than that of their respective CHOW controls (Figure 1). A two-way ANOVA comparing daily caloric intake between HE and CHOW rats revealed a main effect of group (F(1,12)=67.904, p<0.001), a main effect of day (F(50,600)=3.513, p<0.001) and a significant interaction (F(50,600)=2.879, p<0.001). Similarly, a two-way ANOVA comparing daily caloric intake between HF and its respective CHOW group revealed a main effect of group (F(1,13)=8.223, p=0.013), a main effect of day (F(51,663)=17.632, p<0.001) and a significant interaction (F(51,663)=6.450, p<0.001).
Figure 1.
Mean caloric intake ±SE across days for CHOW and HE groups of cohort 1 (CHOW1, HE) and CHOW and HF groups of cohort 2 (CHOW2, HF)
For the first cohort, the HE group were heavier than controls but as sham-feeding sessions progressed, the group difference in body weight was no longer observed. Comparing body weight gain, two-sample t-tests showed a group difference emerge after several days on the new diet (t(16)=−2.270, p=0.037). In the second cohort, there were no significant group differences in body weight between the HF group and the control group. The group difference in body weight gain for the second cohort was not as robust as that observed in the first cohort. Two-sample t-tests revealed a group difference following several days on the new diet (t(18)=−2.422, p=0.026) but this group difference is only maintained for two of the experimental days.
Sham feeding
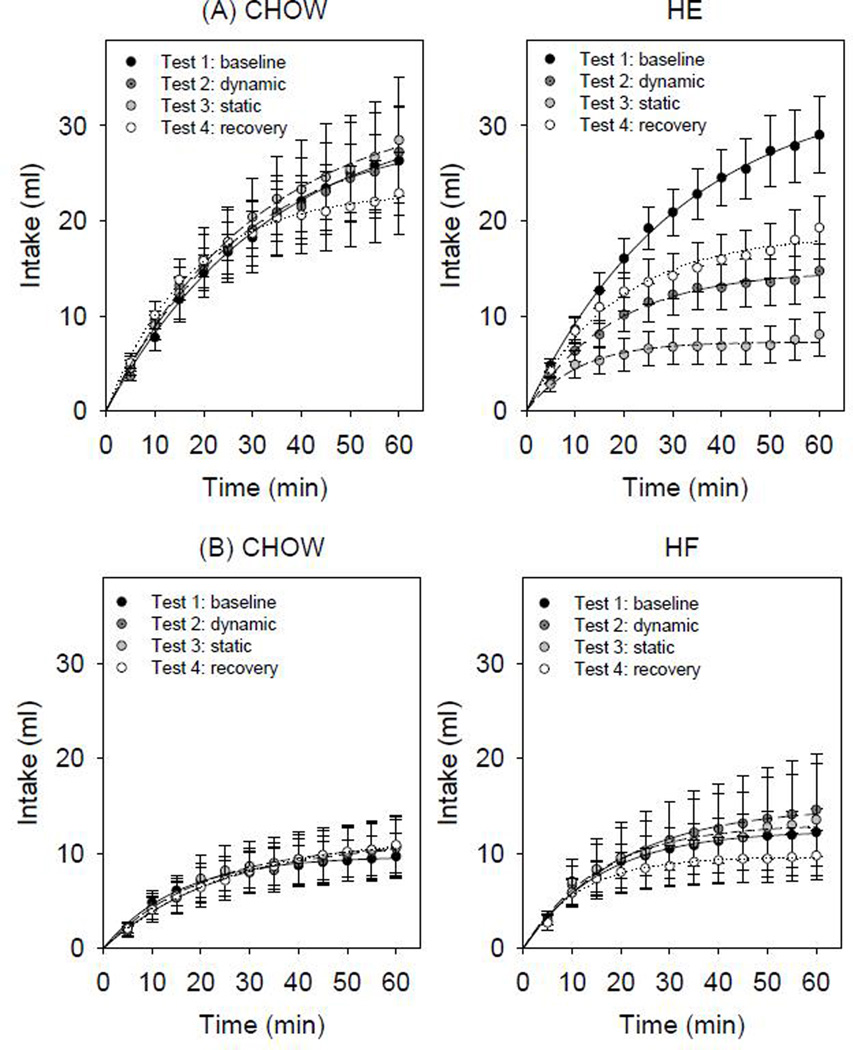
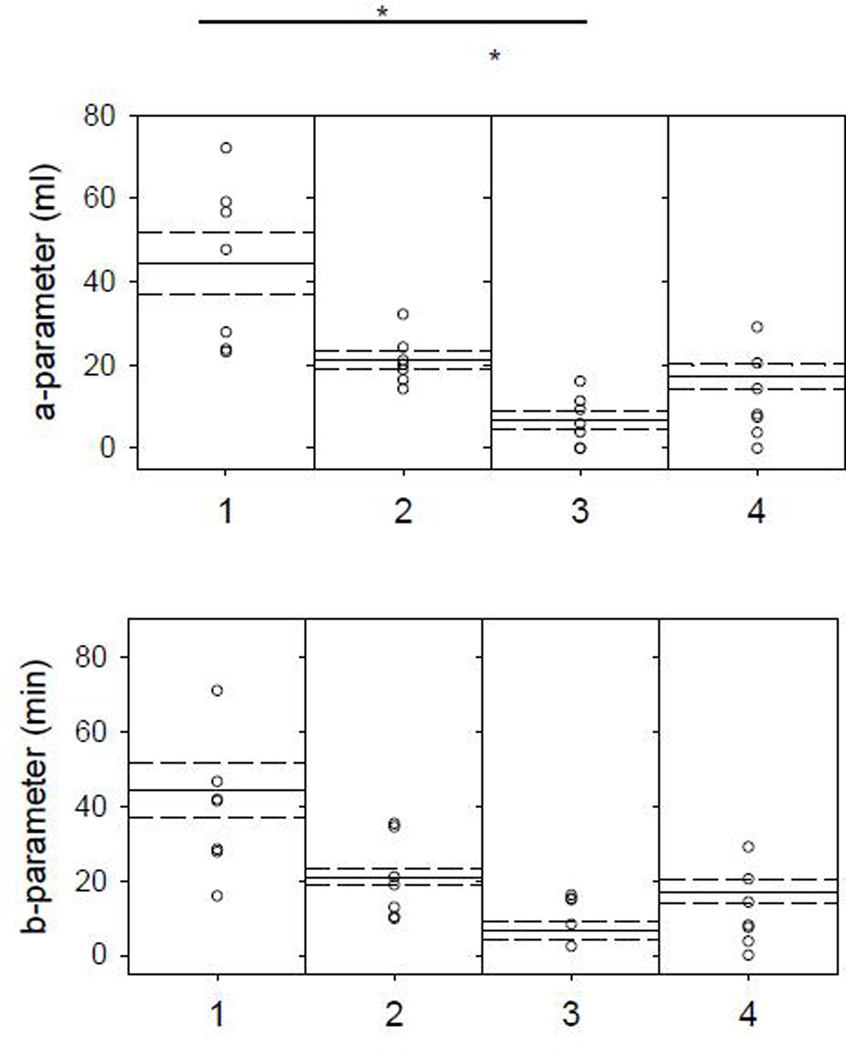
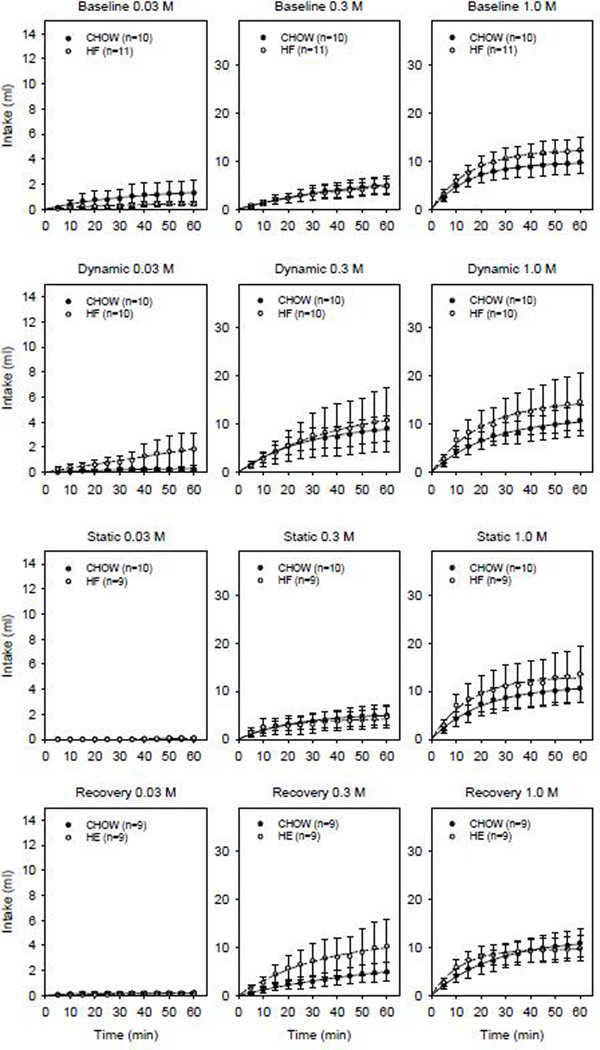
In animals maintained on the high-energy diet (HE), compared with responses during the dynamic phase (Test 2), sham-feeding intake to sucrose decreased when tested after longer exposure to the diet (Test 3). When HE animals were returned to standard chow diet and tested during Test 4, sham-feeding intake values returned to values comparable to that observed during Test 2 (Figure 2). Paired t-tests comparing parameter values for HE animals responding to 1.0 M sucrose revealed a-parameter values (asymptotic intake) differed across test phases. Namely between Test 1 vs. Test 3 and Test 2 vs. Test 3. Comparisons of the b-parameter values (rate of intake) were not significantly different across testing phases (Figure 3). In comparison, sham-feeding intake to sucrose in CHOW controls did not significantly differ across the testing phases. Paired t-tests comparing parameter values for CHOW group responses to 1.0 M sucrose, did not reveal any significant differences between test phases for a-parameter values (t(4)≤1.509, p≥0.206) or b-parameter values (t(4)≤2.541, p≥0.064). The individual animal curves reasonably fit the cumulative intake data as reflected by the mean R2 of 0.91±0.02 across animals.
Figure 2.
Mean sham-feeding intake ±SE across 60-min sessions of 1.0 M sucrose across four phases of testing (A) CHOW (left panel) and HE (right panel) and (B) CHOW and HF groups
Figure 3.
a-parameter (representing asymptotic intake; top panel) and b-parameter (indicating rate of intake; bottom panel) distribution for individual HE rats to 1.0 M sucrose. Means (solid lines) and SE (dashed lines) for each test phase (1, 2, 3, 4). * indicates significant differences after Bonferroni adjustments.
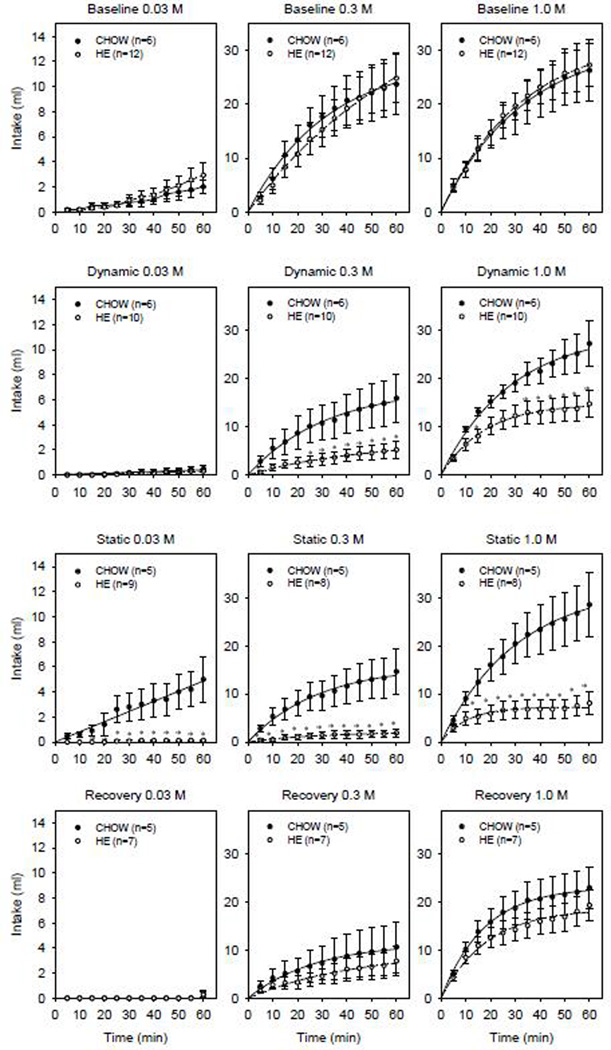
Compared to the CHOW controls, after several days (Test 2) and several weeks (Test 3) on a high-energy and Ensure liquid diet, HE rats displayed lower sham-feeding intake to 0.3 M and 1.0 M sucrose statistically confirmed by a main effect of group, main effect of time and significant interaction (Supplemental Tables 1 and 2). The significant main effect of group and interaction effects between the CHOW and HE groups were no longer apparent when HE animals were returned to a standard chow diet (Test 4) (Figure 4).
Figure 4.
Mean sham-feeding intake ± SE across 60-min sessions of 0.03 (left column), 0.3 (middle column) and 1.0 M sucrose (right column) when tested at baseline (first row), dynamic (second row), static (third row) and recovery (bottom row) test phases in CHOW (solid symbols) and HE (open symbols) groups.
In contrast, sham-feeding intake to sucrose did not significantly differ across test phases in animals maintained on the 45% high-fat diet (Figure 2). Paired t-tests comparing a- and b-parameter values derived from responses to 1.0 M sucrose failed to reveal any significant differences between test phases for the HF (a-parameter values (t(8)≤0.938, p≥0.376); b-parameter values (t(8)≤1.162, p≥0.298) or CHOW groups (a-parameter values (t(8)≤−1.488, p≥0.175); b-parameter values (t(8)≤−2.015, p≥0.600)). The individual animal curves reasonably fit the cumulative intake data as reflected by the mean R2 of 0.93±0.01 across animals. Furthermore, comparisons between the CHOW and HF group showed that neither short- (Test 2) nor long- (Test 3) term exposure to the 45% high-fat diet altered sham-feeding intake to sucrose (Figure 5). Two-way ANOVAs comparing sham-feeding intake of 0.3 M and 1.0 M sucrose between CHOW and HF groups did not reveal any significant main effects of group nor significant interaction effects for any of the test phases (Supplementary Tables 3 and 4).
Figure 5.
Mean sham-feeding intake of CHOW (solid symbols) and HF (open symbols) groups across 60-min sessions to 0.03 (left column), 0.3 (middle column) and 1.0 M sucrose (right column) when tested at baseline (first row), dynamic (second row), static (third row) and recovery (bottom row) test phases.
Total mean sham-feeding intake of the HE and HF animals was also analyzed as a proportion of intake of their respective controls. One-sample t-tests revealed that the intake ratio values for HE animals were significantly lower than 1.0 at 0.3 M (t(9)=−6.274, p<0.001) and at 1.0 M sucrose (t(9)=−4.531, p=0.001) during Test 2, at 0.3 M (t(8)=−17.803, p<0.001) and at 1.0 M sucrose (t(8)=−9.669, p<0.001) during Test 3 but not at 0.3 M (t(6)=−0.978, p=0.366 nor 1.0 M sucrose (t(6)=−1.111, p=0.309) during Test 4. These results indicate that intake in the HE animals is significantly lower as a proportion of that of CHOW controls during Tests 2 and 3 but not after HE animals are returned to standard chow and tested during Test 4. In contrast, intake ratio values for the HF group at 0.3 M or 1.0 M sucrose were not significantly different from 1.0 during Tests 2, 3 nor 4 (t(8)≤0.786, p≥0.454) indicating even standardizing for intake in the control groups, intake in the HF group was not significantly different from that of CHOW rats.
Preference for Ensure
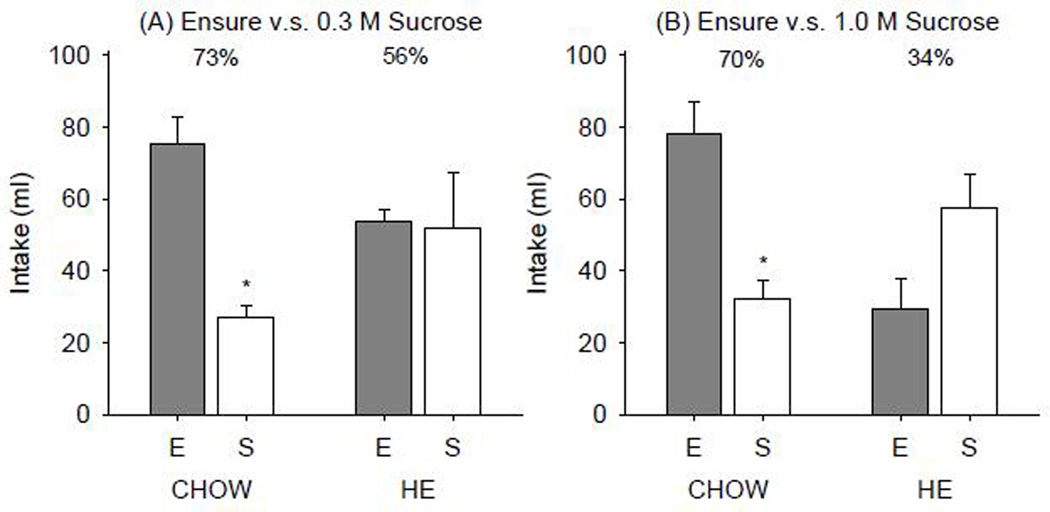
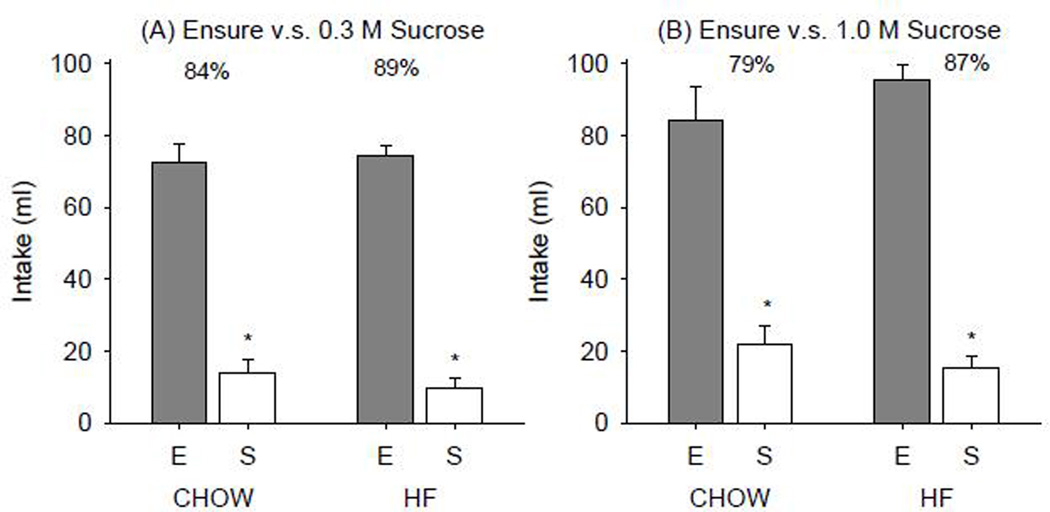
The CHOW group drank significantly more of the Ensure than 0.3 M (t(4)=4.925, p=0.008) or 1.0 M sucrose (t(4)=3.497, p=0.025) in the two-bottle intake tests. In contrast, HE rats did not prefer Ensure over either of the sucrose concentrations presented (0.3 M (t(7)=0.131, p=0.900); 1.0 M (t(6)=−1.708, p=0.138) Figure 6). In the second cohort, both CHOW and HF groups showed a significant preference for Ensure over 0.3 M or 1.0 M sucrose (Figure 7).
Figure 6.
Mean ± SE intake of Ensure vs. (A) 0.3 M and (B) 1.0 M sucrose in a 23-h two-bottle intake test in CHOW and HE groups. Percentages denote relative preference of Ensure (E).
Figure 7.
Mean ± SE intake of Ensure vs. (A) 0.3 M and (B) 1.0 M sucrose in a 23-h two-bottle intake test in CHOW and HF groups. Percentages denote relative preference of Ensure (E).
Discussion
We previously showed that rats presented a calorically dense diet (45% fat) increased meal size compared to standard chow-fed controls. Thus we hypothesized that enhanced orosensory stimulation elicited by diet exposure would generalize to increased responsiveness to other palatable stimuli such that sham-feeding intake to sucrose would be higher. Yet, contrary to what we predicted, HE and HF groups did not show increased sham-feeding intake of sucrose. Furthermore HE rats showed decreased responses compared to CHOW controls. We previously reported that the increased meal size was more robust during the dynamic phase compared with during the static phase of diet-exposure. In partial support of the hypothesis that this would generalize to increased sham-feeding intake during the dynamic phase, here, rats maintained on the high-energy diet displayed higher sham-feeding intake to sucrose during the dynamic phase compared with responses in the static phase. This may be indicative of underlying mechanisms that drive the robust hyperphagia observed during this diet exposure period. Finally, when HE and HF animals were returned to standard chow and tested in the recovery phase, sham-feeding intake did not significantly differ from that of their CHOW controls.
As sucrose concentration increased, all groups increased sham-feeding intake in a concentration-dependent manner. Yet, compared to their CHOW controls, the HE group showed decreased sucrose intake. In the second cohort, the HF and CHOW groups displayed similar sham-feeding sucrose intake across all testing points. Whereas obese CCK-1 receptor deficient OLETF rats (De Jonghe et al., 2005; De Jonghe et al., 2007; Hajnal et al., 2005), obese Zuker rats (Enns and Grinker, 1983) and obese ventromedial hypothalamic lesioned rats (Black and Weingarten, 1988) show greater responsiveness to sucrose compared to their respective controls, this phenomenon does not appear to be observed in rodents maintained on calorically dense diets. Additionally, rats fed a high-fat diet displayed decreased intake for saccharin solutions (vs. water) in 1-h tests compared to control diet-fed rats (Chen et al., 2010). High-fat diet-fed mice showed lower sucrose intake in 20-min tests compared to chow-fed controls (Johnson, 2012). Compared to chow-fed controls, rats maintained on high-fat diet showed decreased and increased responses to 10-s presentations of lower and higher sucrose concentrations respectively (Shin et al., 2011). Similarly, diet-induced obese rats showed decreased 48-h sucrose intake and 1-h sham-feeding sucrose intake compared to chow-fed controls (Duca et al., 2014). Consistent with these findings, we previously reported that rats maintained on a calorically dense diet decreased intake to sucrose or Polycose compared to chow-fed controls in a two-bottle intake test (Treesukosol and Moran, 2013b), a procedure that is influenced by both oral and postoral signals (Mook, 1963). Here, we find complementary findings with a sham-feeding protocol in which postoral cues are minimized. Thus contrary to what was predicted, it appears that alterations in orosensory stimulation as a function of calorically dense diet exposure, do not necessarily generalize to increased intake of other palatable stimuli.
The lower sham-feeding intake of sucrose during exposure to the high-energy diet may be at least partly explained by incentive contrast (see Flaherty, 1982). In other words, to animals maintained on this diet, the sucrose in the sham-feeding in take test may not be as orally palatable as it may be to the standard chow-fed controls. Indeed in the Ensure vs. sucrose solution intake tests, control animals preferred Ensure over sucrose. These data do not provide information as to what the Ensure vs. sucrose preference would be at an earlier time point (e.g. before or during sham-feeding to sucrose) but the preference for Ensure over sucrose, even at 1.0 M sucrose which is calorically comparable to Ensure, lend support to the possibility that Ensure is more palatable than sucrose. Furthermore, when returned to a standard chow diet, the decreased sham-feeding intake of sucrose observed in the HE group returned to levels comparable to those of CHOW controls. Previous studies in the literature have reported hypophagia when animals are switched from a palatable diet to a less calorically dense diet (Rogers, 1985; Rolls and Rowe, 1979; Rolls et al., 1980; Stephens, 1980) that eventually return to intake levels of controls. The lower sham-feeding to sucrose observed in the HE animals may also be partially attributed to the availability of the high-energy diet and Ensure and its associated weight gain. Consistent with what was observed in the current study, when diet-induced obese mice were returned to standard chow and re-tested in short-term access tests to various sucrose solutions, burst size and number returned to levels comparable to those of controls (Johnson, 2012). Also there is evidence of reduced hedonic value in high-fat fed rats including decreased dopamine turnover in the mesolimbic system and reduced operant responding for sucrose (Davis et al., 2008). Thus these group differences may be at least partly attributed to a negative contrast effect or the increased body weight gain in turn reducing the hedonic value of sucrose. These are not mutually exclusive possibilities.
Both the high-energy and high-fat diets were used for animal models of diet-induced hyperphagia leading to obesity. In these experiments, likely due to exposure to sucrose and the sham-feeding sessions, robust group differences in body weight did not develop and the body weight gain observed in the HF cohort was not as robust as that in the HE cohort. Compared with intake during Baseline (Test 1), intake during Recovery (Test 4) appears to be lower in the HE animals compared with controls, yet this does not appear to be the case for HF rats compared with their controls. Intake during Test 4 does not significantly differ between HE and controls groups and a-parameter values (asymptotic intake) do not significantly differ for HE rats between Tests 1 and 4. One possible explanation for any difference may be related to body weight gain which was not as robust in the HF animals. Furthermore, it is not clear why there are differences in baseline intake between cohorts 1 and 2. Nor is it clear why there was more variability observed in the second cohort. The variability was observed in both control and experimental groups and each cohort was tested with its own control group. To take into account the cohort differences, intake in the experimental animals was analyzed as a proportion of the group mean of their respective control groups. These analyzes confirmed the results from analyzing intake across the time points and comparisons of parameter values.
To the CHOW groups, in contrast to the previously sham-feeding exposed sucrose solutions, Ensure was a novel, more viscous and caloric stimulus. As expected, the CHOW rats in both cohorts showed significantly higher preference for Ensure over the sucrose solutions, even over 1.0 M sucrose which provides calories comparable to that of Ensure. Yet following long-term exposure to Ensure, preference for Ensure vs. sucrose decreases in HE rats. These data do not indicate how long the Ensure exposure needs to be to observe a decreased preference for Ensure, but at least here across the four consecutive days of testing, Ensure intake was relatively stable in all groups. The HE animals had previous sham-feeding exposure to sucrose and real-feeding exposure to Ensure. Essentially the HE rats had post-ingestive conditioning trials with Ensure but not sucrose. Thus at first glance, it is surprising that unlike the CHOW rats, the HE group did not show significantly higher preference for Ensure. Particularly since it appears that the HE animals showed decreased sham-feeding intake of sucrose at least partly driven by a negative contrast effect. There are, however, examples in the literature in which rats do not prefer the flavor previously paired with the higher caloric stimulus and instead prefer the flavor previously paired with fewer calories (Sclafani et al., 1994; Van Vort and Smith, 1983; Warwick and Weingarten, 1996). These findings support the hypothesis that flavor-conditioning involves both a positive reinforcing effect that plays a larger role when a flavor is associated with dilute solutions, and an anticipated satiety effect that predominates when a flavor is associated with more calorically concentrated solutions. In light of these results, there are several possible explanations for the lack of Ensure preference observed in the HE animals in the current study. After several weeks of exposure to Ensure in the HE rats, Ensure may elicit post-ingestive consequences that are more satiating or are mildly aversive. Alternatively, exposure to Ensure may have decreased orosensory stimulation in the HE rats. This possibility would be consistent with the lower sham-feeding intake to sucrose and with the lower total intake of Ensure in the two-bottle preference test in the HE group compared to the CHOW controls. That is, to the HE animals, compounds such as Ensure and sucrose are not as orally palatable. Finally, these oral and postoral possible contributions are not mutually exclusive. To the HE group, the oral stimulation of Ensure may indeed be positive but as intake continues, postingestive inhibitory signals may be more robust than in the CHOW rats.
We previously reported that hyperphagia of a calorically dense diet is driven by meal size and that this is more robust during the dynamic, compared with the static phase. Some but not all aspects of the hypotheses based on these findings were consistent with the outcomes of the current study. First, contrary to what was hypothesized, HE and HF groups did not show increased sham-feeding intake of sucrose compared to CHOW controls. Thus it appears that exposure to a calorically dense diet does not necessarily generalize to increased responsiveness to other palatable stimuli. Second, in line with the robust meal size-driven hyperphagia observed in the dynamic phase previously reported, here, we show that first, rats maintained on the high-energy diet displayed higher sham-feeding intake to sucrose during the dynamic phase compared with responses in the static phase. The current findings also reveal that the HE group showed decreased sham-feeding of sucrose compared with the CHOW group. This may be at least partially attributed by a negative contrast effect between the ad libitum access to Ensure and the test sucrose stimuli or the ad libitum availability of Ensure and high-energy diet setting up a positive energy balance state and/or body weight gain such that robust responsivity to sucrose is not elicited. During the recovery phase (when Ensure and the high-energy diet were no longer available), the group effect was no longer observed. Finally, preference for Ensure over sucrose appears to be altered as a function of previous exposure, likely by conditioning, thus highlighting the complex nature of the effects of exposure to palatable, calorically dense stimuli.
Supplementary Material
Highlights.
Neither high energy (HE) nor high fat diet (HF) groups showed increased sham feeding (SF) intake compared to CHOW controls
HE rats show increased SF intake in the dynamic compared with the static phase
HE rats have lower SF intake likely explained by negative contrast effect
Acknowledgements
We would like to thank Heather Oros for her technical assistance with these experiments. Supported by NIH DK019302 (T.H.M.)
Footnotes
Publisher's Disclaimer: This is a PDF file of an unedited manuscript that has been accepted for publication. As a service to our customers we are providing this early version of the manuscript. The manuscript will undergo copyediting, typesetting, and review of the resulting proof before it is published in its final citable form. Please note that during the production process errors may be discovered which could affect the content, and all legal disclaimers that apply to the journal pertain.
Parts of this paper were presented at Obesity Week 2013 for The Obesity Society, Atlanta, GA, USA November 2013.
References
- Black RM, Weingarten HP. A comparison of taste reactivity changes induced by ventromedial hypothalamic lesions and stria terminalis transections. Physiol Behav. 1988;44(6):699–708. doi: 10.1016/0031-9384(88)90050-9. [DOI] [PubMed] [Google Scholar]
- Brobeck JR. Mechanism of the development of obesity in animals with hypothalamic lesions. Physiol Rev. 1946;26(4):541–559. doi: 10.1152/physrev.1946.26.4.541. [DOI] [PubMed] [Google Scholar]
- Chen K, Yan J, Suo Y, Li J, Wang Q, Lv B. Nutritional status alters saccharin intake and sweet receptor mRNA expression in rat taste buds. Brain Res. 2010;1325:53–62. doi: 10.1016/j.brainres.2010.02.026. [DOI] [PubMed] [Google Scholar]
- Davis JD, Campbell CS. Peripheral control of meal size in the rat. Effect of sham feeding on meal size and drinking rate. J Comp Physiol Psychol. 1973;83(3):379–387. doi: 10.1037/h0034667. [DOI] [PubMed] [Google Scholar]
- Davis JD, Smith GP. Learning to sham feed: behavioral adjustments to loss of physiological postingestional stimuli. Am J Physiol Regul Integr Comp Physiol. 1990;259(6 Pt 2):R1228–R1235. doi: 10.1152/ajpregu.1990.259.6.R1228. [DOI] [PubMed] [Google Scholar]
- Davis JD, Smith GP, Miesner J. Postpyloric stimuli are necessary for the normal control of meal size in real feeding and sham feeding rats. Am J Physiol. 1993;265(4 Pt 2):R888–R895. doi: 10.1152/ajpregu.1993.265.4.R888. [DOI] [PubMed] [Google Scholar]
- Davis JF, Tracy AL, Schurdak JD, Tschop M, Lipton JW, Clegg DJ, Benoit SC. Exposure to elevated levels of dietary fat attenuates psychostimulant reward and mesolimbic dopamine turnover in the rat. Behav Neurosci. 2008;122(6):1257–1263. doi: 10.1037/a0013111. [DOI] [PMC free article] [PubMed] [Google Scholar]
- De Jonghe BC, Hajnal A, Covasa M. Increased oral and decreased intestinal sensitivity to sucrose in obese, prediabetic CCK-A receptor-deficient OLETF rats. Am J Physiol Regul Integr Comp Physiol. 2005;288:R292–R300. doi: 10.1152/ajpregu.00481.2004. [DOI] [PubMed] [Google Scholar]
- De Jonghe BC, Hajnal A, Covasa M. Conditioned preference for sweet stimuli in OLETF rat: effects of food deprivation. Am J Physiol Regul Integr Comp Physiol. 2007;292(5):R1819–R1827. doi: 10.1152/ajpregu.00339.2006. [DOI] [PMC free article] [PubMed] [Google Scholar]
- Duca FA, Swartz TD, Covasa M. Effect of diet on preference and intake of sucrose in obese prone and resistant rats. PLoS One. 2014;9(10):e111232. doi: 10.1371/journal.pone.0111232. [DOI] [PMC free article] [PubMed] [Google Scholar]
- Enns MP, Grinker JA. Dietary self-selection and meal patterns of obese and lean Zucker rats. Appetite. 1983;4(4):281–293. doi: 10.1016/s0195-6663(83)80021-x. [DOI] [PubMed] [Google Scholar]
- Flaherty CF. Incentive contrast: A review of behavioral changes following shifts in reward. Anim Learn Behav. 1982;10(4):409–440. [Google Scholar]
- Hajnal A, Covasa M, Bello NT. Altered taste sensitivity in obese, prediabetic OLETF rats lacking CCK-1 receptors. Am J Physiol Regul Integr Comp Physiol. 2005;289(6):R1675–R1686. doi: 10.1152/ajpregu.00412.2005. [DOI] [PMC free article] [PubMed] [Google Scholar]
- Johnson AW. Dietary manipulations influence sucrose acceptance in diet induced obese mice. Appetite. 2012;58(1):215–221. doi: 10.1016/j.appet.2011.09.015. [DOI] [PubMed] [Google Scholar]
- Kraly FS, Carty WJ, Smith GP. Effect of pregastric food stimuli on meal size and intermeal interval in the rat. Physiol Behav. 1978;20(6):779–784. doi: 10.1016/0031-9384(78)90305-0. [DOI] [PubMed] [Google Scholar]
- Levin BE, Dunn-Meynell AA. Defense of body weight depends on dietary composition and palatability in rats with diet-induced obesity. Am J Physiol Regul Integr Comp Physiol. 2002;282(1):R46–R54. doi: 10.1152/ajpregu.2002.282.1.R46. [DOI] [PubMed] [Google Scholar]
- Liang N-C, Hajnal A, Norgren R. Sham feeding corn oil increases accumbens dopamine in the rat. Am J Physiol Regul Integr Comp Physiol. 2006;291(5):R1236–R1239. doi: 10.1152/ajpregu.00226.2006. [DOI] [PubMed] [Google Scholar]
- Liang NC, Freet CS, Grigson PS, Norgren R. Pontine and thalamic influences on fluid rewards: I. Operant responding for sucrose and corn oil. Physiol Behav. 2012;105(2):576–588. doi: 10.1016/j.physbeh.2011.06.010. [DOI] [PMC free article] [PubMed] [Google Scholar]
- Mook DG. Oral and postingestional determinants of the intake of various solutions in rats with esophageal fistulas. J Comp Physiol Psychol. 1963;56(4):645–659. [Google Scholar]
- Rogers PJ. Returning 'cafeteria-fed' rats to a chow diet: negative contrast and effects of obesity on feeding behaviour. Physiol Behav. 1985;35(4):493–499. doi: 10.1016/0031-9384(85)90129-5. [DOI] [PubMed] [Google Scholar]
- Rolls BJ, Rowe EA. Exercise and the development and persistence of dietary obesity in male and female rats. Physiol Behav. 1979;23(2):241–247. doi: 10.1016/0031-9384(79)90361-5. [DOI] [PubMed] [Google Scholar]
- Rolls BJ, Rowe EA, Turner RC. Persistent obesity in rats following a period of consumption of a mixed, high energy diet. J Physiol. 1980;298:415–427. doi: 10.1113/jphysiol.1980.sp013091. [DOI] [PMC free article] [PubMed] [Google Scholar]
- Sclafani A. Post-ingestive positive controls of ingestive behavior. Appetite. 2001;36(1):79–83. doi: 10.1006/appe.2000.0370. [DOI] [PubMed] [Google Scholar]
- Sclafani A, Nissenbaum JW, Ackroff K. Learned preferences for real-fed and sham-fed polycose in rats: interaction of taste, postingestive reinforcement, and satiety. Physiol Behav. 1994;56(2):331–337. doi: 10.1016/0031-9384(94)90203-8. [DOI] [PubMed] [Google Scholar]
- Shin AC, Townsend RL, Patterson LM, Berthoud H-R. "Liking" and "wanting" of sweet and oily food stimuli as affected by high-fat diet-induced obesity, weight loss, leptin, and genetic predisposition. Am J Physiol Regul Integr Comp Physiol. 2011;301(5):R1267–R1280. doi: 10.1152/ajpregu.00314.2011. [DOI] [PMC free article] [PubMed] [Google Scholar]
- Smith GP. The direct and indirect controls of meal size. Neurosci Biobehav Rev. 1996;20:41–46. doi: 10.1016/0149-7634(95)00038-g. [DOI] [PubMed] [Google Scholar]
- Smith GP. Sham feeding in rats with chronic, reversible gastric fistulas. Curr Protoc Neurosci. 1998;Chapter 8(Unit 8):6D. doi: 10.1002/0471142301.ns0806ds04. [DOI] [PubMed] [Google Scholar]
- Stephens DN. Growth and the development of dietary obesity in adulthood of rats which have been undernourished during development. Br J Nutr. 1980;44(3):215–227. doi: 10.1079/bjn19800034. [DOI] [PubMed] [Google Scholar]
- Treesukosol Y, Moran TH. Analyses of meal patterns across dietary shifts. Appetite. 2013a;75C:21–29. doi: 10.1016/j.appet.2013.12.004. [DOI] [PMC free article] [PubMed] [Google Scholar]
- Treesukosol Y, Moran TH. Sucrose intake measured in a 23-h two-bottle test, decreases following several days maintained on a high fat diet. 21st Annual Meeting of the Society for the Study of Ingestive Behavior; New Orleans LA, USA. 2013b. [Google Scholar]
- Van Vort W, Smith GP. The relationships between the positive reinforcing and satiating effects of a meal in the rat. Physiol Behav. 1983;30(2):279–284. doi: 10.1016/0031-9384(83)90019-7. [DOI] [PubMed] [Google Scholar]
- Warwick ZS, Weingarten HP. Flavor-postingestive consequence associations incorporate the behaviorally opposing effects of positive reinforcement and anticipated satiety: implications for interpreting two-bottle tests. Physiol Behav. 1996;60(3):711–715. doi: 10.1016/0031-9384(96)00087-x. [DOI] [PubMed] [Google Scholar]
- Weingarten H, Watson S. Sham feeding as a procedure for assessing the influence of diet palatability on food intake. Physiol Behav. 1982;28(3):401–407. doi: 10.1016/0031-9384(82)90131-7. [DOI] [PubMed] [Google Scholar]
- Young RC, Gibbs J, Antin J, Holt J, Smith GP. Absence of satiety during sham feeding in the rat. J Comp Physiol Psychol. 1974;87(5):795–800. doi: 10.1037/h0037210. [DOI] [PubMed] [Google Scholar]
Associated Data
This section collects any data citations, data availability statements, or supplementary materials included in this article.


