

Abstract
Due to its central role in glucose homeostasis, the liver is an important target for drug development efforts for type 2 diabetes mellitus (T2DM). Significant differences across species in liver metabolism necessitate supplementation of animal data with assays designed to assess human-relevant responses. However, isolated primary human hepatocytes (PHHs) display a rapid decline in phenotypic functions in conventional monolayer formats. Cocultivation of PHHs with specific stromal cells, especially in micropatterned configurations, can stabilize some liver functions for ∼4 weeks in vitro. However, it remains unclear whether coculture approaches can stabilize glucose metabolism that can be modulated with hormones in PHHs. Thus, in this study, we compared commonly employed conventional culture formats and previously developed micropatterned cocultures (MPCCs) of cryopreserved PHHs and stromal fibroblasts for mRNA expression of key glucose metabolism genes (i.e., phosphoenolpyruvate carboxykinase-1 [PCK1]) and sensitivity of gluconeogenesis to prototypical hormones, insulin and glucagon. We found that only MPCCs displayed high expression of all transcripts tested for at least 2 weeks and robust gluconeogenesis with responsiveness to hormones for at least 3 weeks in vitro. Furthermore, MPCCs displayed glycogen storage and lysis, which could be modulated with hormones under the appropriate feeding and fasting states, respectively. Finally, we utilized MPCCs in proof-of-concept experiments where we tested gluconeogenesis inhibitors and evaluated the effects of stimulation with high levels of glucose as in T2DM. Gluconeogenesis in MPCCs was decreased after stimulation with drugs (i.e., metformin) and the PHHs accumulated significant amount of lipids following incubation with excess glucose (i.e., 340% in 50 mM glucose relative to physiologic 5 mM glucose controls). In conclusion, MPCCs provide a platform to study glucose metabolism and hormonal responsiveness in cryopreserved PHHs from multiple donors for several weeks in vitro. This model is also useful to study the effects of drugs and overnutrition for applications in T2DM.
Introduction
Relative insulin deficiency due to declining pancreatic functions coupled with insulin resistance in target tissues (i.e., liver, muscle) can lead to high levels of glucose in the blood or type 2 diabetes mellitus (T2DM), which accounts for ∼95% of total diabetes cases with over 285 million people affected globally (World Health Organization). Insulin resistance has also been implicated in the pathogenesis of metabolic syndrome, nonalcoholic fatty liver disease (NAFLD), nonalcoholic steatohepatitis, and cardiovascular disease.1–5 The liver plays a central role in glucose homeostasis.6 Hepatocytes in the liver can regulate blood glucose levels within 3.9–6.1 mM by preventing hyperglycemia in the fed state via storage of excess glucose as glycogen, and avoiding hypoglycemia in the fasting state by releasing glucose through glycogen breakdown and/or gluconeogenesis. Therefore, with the rise of obesity, T2DM, and metabolic syndrome, the liver has become an important organ for fundamental investigations of metabolic disorders and for developing novel drugs to treat T2DM and NAFLD.7–10
While studies in animals are useful for elucidating mechanisms underlying the aforementioned diseases, there are significant differences across species in liver pathways.11–13 Thus, in vitro models of the human liver, such as liver slices, cell lines, and primary human hepatocytes (PHHs) are now used to supplement animal data.14,15 However, liver slices suffer from a rapid (hours to days) decline in liver functions, while immortalized/cancerous cell lines contain abnormal levels of liver functions.14–17 Thus, PHHs are ideal for constructing in vitro human liver models since they maintain an intact cell architecture and can be used in vitro for medium- to high-throughput experimentation, including drug screening.18 However, conventional culture models that expose confluent PHH monolayers to extracellular matrix (ECM) coatings/gels ignore other key liver microenvironmental cues (i.e., stromal contact) and display a precipitous decline in liver functions, which makes them inadequate for accurate prediction of human physiology.15 While three-dimensional culture of hepatocytes in aggregates has been demonstrated, many studies have been restricted to animal hepatocytes,14,15,18,19 which can display different functional responses compared with PHHs.11,12 Furthermore, most studies that cultured hepatocytes in engineered platforms have not evaluated glucose metabolism or responsiveness to hormones over long-term (weeks) culturing.19
Coculture with liver- and nonliver-derived stromal cells can stabilize several functions of primary hepatocytes from both animal and human livers.20,21 Furthermore, organization of homotypic interactions between hepatocytes and heterotypic interactions between hepatocytes and specific stromal cells can significantly augment the levels and longevity of liver functions. Indeed, such micropatterned cocultures (MPCCs) between PHHs and 3T3-J2 murine embryonic fibroblasts have been shown to be higher functioning with respect to major liver functions than pure hepatocyte cultures and randomly distributed cocultures of the same two cell types.22 However, it remains unclear whether coculture approaches, including MPCCs, can stabilize the glucose handling capacity and hormonal responsiveness of PHHs over several weeks in vitro. Thus, in this study, we assessed gene expression relevant for glucose metabolism, gluconeogenesis, and glycogen dynamics in MPCCs in the presence or absence of hormones over several weeks. Glucose output and responsiveness to hormones in MPCCs were compared with those obtained in conventional monolayers using the same donor of cryopreserved PHHs. Last, we explored two glucose-related applications of MPCCs: one for screening small molecules to modulate gluconeogenesis and another to model hyperglycemia-induced fat (lipid) accumulation in vitro, as occurs in NAFLD.
Materials and Methods
Culture of PHHs
Cryopreserved PHHs were purchased from vendors permitted to sell products derived from human organs procured in the United States by federally designated organ procurement organizations (BioreclamationIVT; Triangle Research Laboratories). Lots used were EJW (age: 29, Caucasian, female) from BioreclamationIVT and Hum4011 (age: 26, Caucasian, male) from Triangle Research Laboratories. PHHs were thawed and counted and viability was assessed as previously described.23 Conventional monolayer cultures and sandwich cultures were created as previously described.22,23 Briefly, ∼350,000 PHHs were seeded in each collagen-coated (rat tail type I; Corning Biosciences) well of a 24-well plate in the serum-supplemented hepatocyte medium. For the creation of sandwich cultures, cultures were overlaid with ∼0.25 mg/mL Matrigel™ (Corning Life Sciences) the next day after seeding. Conventional cultures were maintained in a serum-free culture medium (500 μL/well) with daily replacement of the medium as previously described.22,23
MPCCs were created as previously described.22,23 Briefly, adsorbed collagen was lithographically patterned in each well of a multiwell plate to create 500-μm diameter circular domains spaced 1200 μm apart, center to center. Hepatocytes selectively attached to the collagen domains leaving ∼30,000 attached hepatocytes on ∼85 collagen-coated islands within each well of a 24-well plate or ∼4500 hepatocytes attached on ∼13 collagen-coated islands within each well of a 96-well plate. 3T3-J2 murine embryonic fibroblasts24 were seeded 12–18 h later in each well to create MPCCs. The culture medium was replaced every 2 days (∼50 μL/well for the 96-well format or ∼300 μL/well for the 24-well format).
Gene expression profiling
Total RNA was isolated and purified using the RNeasy mini kit (Qiagen), and genomic DNA was digested using the Optizyme™ recombinant DNase-I digestion kit (Fisher BioReagents). Approximately 10 μL of purified RNA was reverse transcribed into cDNA using the high-capacity cDNA reverse transcription kit (Life Technologies–Applied Biosystems). Approximately 250 ng of cDNA was added to each well along with Solaris™ master mix and premade primer/probe sets according to the manufacturers' protocol (GE Healthcare–Dharmacon). Quantitative polymerase chain reaction (qPCR) was performed on a Mastercycler Realplex instrument (Eppendorf), and data were analyzed using the comparative C(T) method.25 Gene expression was normalized to the housekeeping gene, glyceraldehyde 3-phosphate dehydrogenase (GAPDH).
Biochemical assays
Urea concentration in supernatants was assayed using a colorimetric endpoint assay utilizing diacetyl monoxime with acid and heat (Stanbio Labs). Albumin levels were measured using an enzyme-linked immunosorbent assay (MP Biomedicals) with horseradish peroxidase detection and 3,3′,5,5′-tetramethylbenzidine (Fitzgerald Industries) as the substrate.21 ATP in cell lysates was quantified using the Celltiter-Glo® kit (Promega). Glucose levels were measured using the Amplex Red glucose/glucose-oxidase assay kit (Life Technologies–Molecular Probes).
Staining assays
Cultures were fixed with 4% paraformaldehyde (Electron Microscopy Sciences) for 15 min at room temperature, washed thrice with 1× phosphate-buffered saline (PBS; Mediatech), and stained for intracellular lipids with Nile Red (AAT Bioquest). Briefly, cultures were incubated in Nile Red solution (10 μM in 1× PBS) for 10 min, washed thrice with 1× PBS, and then imaged using a GFP light cube (excitation/emission: 470/510 nm) on an EVOS® FL Imaging System (Life Technologies). Hepatic glycogen content was visualized using the Periodic Acid-Schiff (PAS) staining kit (Sigma-Aldrich).
Gluconeogenesis and glycogen assays
To assess gluconeogenesis, cultures were first washed thrice with 1× PBS, and then incubated with the glucose-free and serum-free Dulbecco's modified Eagle's medium (DMEM; Life Technologies) containing 100 nM glucagon for ∼24 h to rapidly deplete glycogen stores. Then, cultures were washed thrice with 1× PBS and incubated with glucose-free DMEM for an additional ∼24 h to deplete residual intracellular glycogen. After this 48-h starvation period, cultures were washed thrice with 1× PBS and incubated for up to 24 h with specific culture media as detailed below. Control cultures were incubated in glucose-free DMEM, while other cultures were incubated in glucose-free DMEM mixed with substrates for gluconeogenesis, specifically 2 mM pyruvate (GE Healthcare–Hyclone) and 20 mM sodium DL-Lactate (Sigma-Aldrich). For some conditions, insulin (100 nM; Sigma-Aldrich) or glucagon (100 nM; Sigma-Aldrich) was added to the glucose-free culture medium with or without gluconeogenic substrates. Culture supernatants were collected between 4 and 24 h post incubation and assayed for glucose levels as described above.
To assess glycogen lysis, cultures were first incubated with high-glucose DMEM (25 mM) for several days to build up hepatic glycogen stores. Next, cultures were incubated in glucose-free DMEM with or without hormones (100 nM glucagon or 100 nM insulin) for 24 h. To assess glycogen synthesis, hepatocyte cultures were first depleted of glycogen with the ∼48-h starvation protocol as described above. Then, cultures were incubated with or without hormones (100 nM glucagon or 100 nM insulin) in glucose-supplemented (5 mM) medium for 24 h. Glycogen content was assessed using PAS staining as described above.
Drug studies
Hepatic glycogen was depleted for 24 h as described above. Then, cultures were washed thrice with 1× PBS and incubated with gluconeogenic substrates as described above and increasing concentrations of metformin (10.4, 52, 104, 208 μM; Sigma-Aldrich) for 24 h or 3-mercaptopicolinic acid (3-MPA) (50, 100, 250, 500 μM; Santa Cruz Biotechnology) for 4 h. Culture supernatants were assayed for glucose levels as described above.
Data analysis
Each experiment was carried out at least thrice in duplicate or triplicate wells for each condition. Two different cryopreserved PHH donors identified above were used to confirm trends. GraphPad Prism 5.0 was used for data analysis and plotting data. Statistical significance of the data was determined using Student's t-test or one-way analysis of variance (ANOVA) with Tukey's post hoc test (p<0.05).
Results
Morphology, gene expression, and gluconeogenesis in conventional hepatocyte cultures
We created conventional confluent monolayers of PHHs on adsorbed collagen and also overlaid select cultures with a Matrigel overlay (i.e., sandwich cultures) (Fig. 1a), a commonly employed ECM for hepatocyte culture.15 PHH morphology declined over time in conventional cultures with the presence of very few bile canaliculi between hepatocytes (Fig. 1b). However, the cultures maintained low levels (relative to MPCCs) of albumin and urea secretion over 1 week of culture, suggesting that the overall hepatic phenotype was not entirely degraded (Fig. 1c, d). Next, we evaluated expression of transcripts involved in glucose regulation, including glucose 6-phosphatase (G6PC), phosphoenolpyruvate carboxykinase-1 (PCK1), solute carrier family 2 (facilitated glucose transporter) member 2 (SLC2A2), and glycogen synthase 2 (GYS2) (Fig. 1e). After 1 week of culture, PCK1 transcript levels in conventional monolayers decreased ∼85%, while G6PC transcript levels increased 270% relative to expression levels in 3-day-old cultures. On the other hand, expression levels of GYS2 and SLC2A2 were relatively stable during the time points tested (93% GYS2 and 134% SLC2A2 after 1 week of culture relative to expression levels in 3-day-old cultures).
FIG. 1.

Functional characterization of conventional pure cultures of primary human hepatocytes (PHHs). (a) Schematic of conventional culture formats. Hepatocytes were seeded on top of a thin adsorbed collagen coat on tissue culture plastic to make monolayers, which were then overlaid with Matrigel™ to create extracellular matrix (ECM) sandwich cultures. Such conventional cultures were maintained in a high-glucose culture medium before incubation in a glucose-free culture medium for data shown in panels (f) and (g) below. (b) Morphology of PHHs in confluent monolayer after 7 days of culture. (c, d) Albumin production and urea synthesis over 1 week in monolayer format. (e) Expression of transcripts related to glucose metabolism and transport on day 7 of culture normalized to day 3 monolayer gene expression. (f) Glucose release in supernatants (24-h time point, incubation in glucose-free culture medium) from 3- and 7-day-old monolayer cultures on adsorbed collagen in the presence or absence of gluconeogenic substrates (lactate, pyruvate) and effects of hormones, insulin and glucagon, on glucose output. +S and −S refer to incubation with or without gluconeogenic substrates, respectively; −H refers to incubation without hormones, while +I and +G refer to incubation with insulin and glucagon, respectively. (g) Same as panel (f), but with sandwich cultures. In all panels, data from a single representative cryopreserved PHH donor are shown, whereas trends were seen in at least two donors. Error bars represent SD. Scale bar is 400 μm. G6PC, glucose 6-phosphatase, catalytic subunit; PCK1, phosphoenolpyruvate carboxykinase-1; SLC2A2, solute carrier family 2 (facilitated glucose transporter) member 2; GYS2, glycogen synthase 2. Color images available online at www.liebertpub.com/tec
Conventional monolayers released glucose into supernatants in all conditions tested (+/−gluconeogenic substrates, +/−hormones) after 3 days of culture, but this level dropped by ∼95–97% after 7 days of culture (Fig. 1f). When incubated in the glucose-free culture medium in the presence of gluconeogenic substrates (pyruvate, lactate), monolayers that were 3 days old did not produce more glucose over control cultures in the glucose-free medium alone. Furthermore, glucose output was not responsive to insulin and glucagon stimulation in conventional monolayers at either of the time points tested (3 or 7 days). Lastly, overlaying the confluent monolayers on adsorbed collagen with a Matrigel overlay (sandwich cultures) did not significantly alter the gluconeogenesis results obtained with conventional monolayers (Fig. 1g).
Morphology, gene expression, and gluconeogenesis in MPCCs
MPCCs were created as described in the Materials and Methods section using the same PHH donors used for conventional monolayers of Figure 1 (Fig. 2a). PHHs in MPCCs maintained a prototypical hepatic morphology, such as polygonal shape, distinct nuclei/nucleoli, and bile canaliculi between hepatocytes (Fig. 2b). Furthermore, albumin and urea secretion levels in MPCCs were relatively stable for at least 3 weeks and several-fold higher (approximately threefold for albumin, approximately ninefold for urea) than observed in conventional monolayers (Fig. 2c, d). In contrast to conventional monolayers, MPCCs maintained expression of mRNA transcripts (G6PC, PCK1, SLC2A2, GYS2) between 88% and 220% of week 1 levels by the end of the second week of culture (Fig. 2e). By the third week, we observed downregulation of these transcripts in MPCCs to 52–70% of week 1 levels (data not shown), although such downregulation was significantly less than that observed in the first week of conventional culture.
FIG. 2.

Functional characterization of micropatterned cocultures (MPCCs) containing PHHs. (a) Schematic of MPCCs starting with collagen patterned on tissue culture plastic. MPCCs were maintained in the high-glucose culture medium before incubation in the glucose-free culture medium for data shown in panels (f) and (g) below. (b) Morphology of PHHs in MPCCs after 7 days of coculture. (c, d) Albumin production and urea synthesis over 3 weeks in MPCCs. (e) Glucose metabolism gene expression on day 14 normalized to day 7 MPCC gene expression. (f) Glucose release in supernatants (24-h time point, incubation in glucose-free culture medium) from 1- and 2-week-old MPCCs in the presence or absence of gluconeogenic substrates (lactate, pyruvate). (g) Effects of hormones, insulin and glucagon, on MPCC glucose output displayed as a percentage of the substrate-only control at 1 and 2 weeks of culture. Statistical significance was determined by comparing each condition to its respective hormone-free control for that week. Data from 1- and 2-week-old MPCCs are shown; however, similar trends were seen for 3 weeks of culture. +S refers to incubation with gluconeogenic substrates; −H refers to incubation without hormones, while +I and +G refer to incubation with insulin and glucagon, respectively. In all panels, data from a single representative cryopreserved PHH donor are shown, whereas trends were seen in at least two donors. Error bars represent SD. Scale bar is 400 μm. Asterisks represent statistical significance (*, **, *** denote p-values ≤0.05, 0.01, and 0.001, respectively). Color images available online at www.liebertpub.com/tec
Glucose production by 1-week-old MPCCs increased by ∼310% upon stimulation with gluconeogenic substrates. MPCCs that were 2 weeks old had a similar gluconeogenic response as that observed after 1 week of culture (Fig. 2f). Furthermore, incubation with insulin decreased gluconeogenesis in MPCCs by ∼40% and 60%, while incubation with glucagon increased glucose output in MPCCs by ∼310% and 340% after 1 and 2 weeks of culture, respectively, relative to hormone-free cultures (Fig. 2g). Glucose output in MPCCs was also responsive to different concentrations of insulin and glucagon (Supplementary Fig. S1; Supplementary Data are available online at www.liebertpub.com/tec). After 3 weeks of culture, MPCCs continued to display gluconeogenesis and respond to hormones with physiologically relevant trends, although glucose production levels dropped by ∼51% (Supplementary Fig. S2). Last, MPCCs that were stimulated to undergo gluconeogenesis could be put back in the serum-containing maintenance culture medium and restimulated several days later without loss of glucose output or insulin responsiveness, thereby showing an ability to evaluate such functions in MPCC wells over multiple time points (Supplementary Fig. S3).
Glycogen dynamics of hepatocytes in MPCCs
MPCCs were allowed to build intracellular glycogen stores through incubation in the culture medium containing high glucose (25 mM) for 1–2 weeks in culture. Hepatic glycogen content was visualized using the PAS stain as described in the Materials and Methods section. Next, MPCCs were incubated in the glucose-free culture medium for 24 h in the presence or absence of hormones, insulin or glucagon. In the absence of hormones, some of the hepatic glycogen content was depleted during this time frame. However, glucagon induced significant lysis of glycogen in PHH islands (Fig. 3a), which appeared as glucose in the culture medium (data not shown). Insulin, on the other hand, inhibited glycogen lysis in MPCCs relative to the glucagon-treated cultures. Last, MPCCs were first starved for 2 days (as described in the Materials and Methods section) to deplete the glycogen almost entirely in the PHHs. Then, a physiologic concentration of glucose was introduced into the culture medium (5 mM) and cultures were stained for glycogen after 24 h. In the presence of glucose, PHH islands in MPCCs stored glycogen, which was significantly enhanced in the presence of insulin (Fig. 3b). However, glucagon prevented any glycogen storage and even stimulated lysis of residual glycogen in PHHs following the starvation period.
FIG. 3.
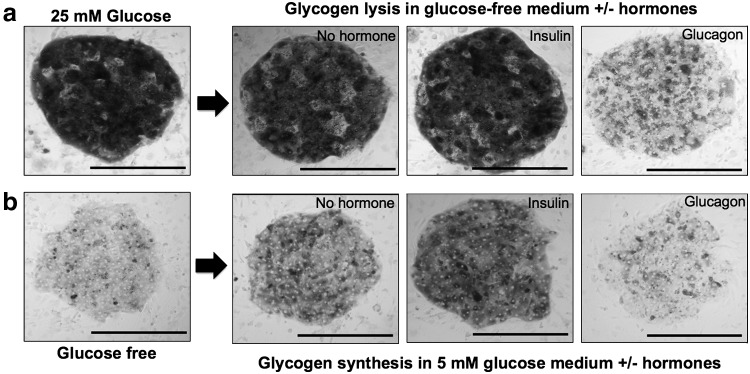
Glycogen lysis and synthesis in MPCCs. (a) Representative images of glycogen lysis in fed (with high glucose) MPCCs over 24 h of incubation in the glucose-free culture medium in the presence or absence of hormones, insulin or glucagon. (b) Representative images of glycogen synthesis in starved (in glucose-free culture medium) MPCCs over 24 h of incubation in the glucose-supplemented (5 mM) culture medium in the presence or absence of hormones, insulin or glucagon. Images from 2-week-old MPCCs are shown, but similar trends were seen after 1 week of culture. In all panels, data from a single representative cryopreserved PHH donor are shown, whereas trends were seen in at least two donors. Scale bar is 400 μm.
Small-molecule-based inhibition of hepatic gluconeogenesis in MPCCs
We stimulated gluconeogenesis in MPCCs as described above while incubating them with different concentrations of metformin, a T2DM drug known to inhibit glucose output from the liver.7 Concentrations of metformin at 17.5 μg/mL or higher were capable of inhibiting gluconeogenesis in 1-week-old MPCCs (14–30% inhibition relative to vehicle-only controls) without causing loss of cell viability at the same doses as assessed by ATP in cell lysates (Fig. 4a, b). Next, we incubated MPCCs with 3-MPA, a specific inhibitor of PCK, an enzyme that carries out the rate-controlling step in gluconeogenesis.26 Concentrations of 3-MPA at 9.58 μg/mL or higher were capable of inhibiting gluconeogenesis in 1-week-old MPCCs (12–63% inhibition relative to vehicle-only controls) without causing significant depletion of ATP (Fig. 4c, d). Both metformin and 3-MPA inhibited gluconeogenesis in 2-week-old MPCCs as well (Supplementary Fig. S4).
FIG. 4.

Utility of MPCCs for screening of small molecules that affect hepatic glucose metabolism. (a) Inhibition of gluconeogenesis in MPCCs upon incubation with increasing doses of metformin over 24 h. (b) ATP levels in MPCC lysates after dosing with metformin. (c) Inhibition of gluconeogenesis in MPCCs upon incubation with increasing doses of PCK inhibitor, 3-mercaptopicolinic acid (3-MPA), over 4 h. (d) ATP levels in MPCC lysates after dosing with 3-MPA. Statistical significance was determined by comparing each drug-treated condition with its drug-free control. Data from 1-week-old MPCCs are shown here, but trends were seen for 2 weeks as seen in Supplementary Figure S4. In all panels, data from a single representative cryopreserved PHH donor are shown, whereas trends were seen in at least two donors. Error bars represent SD. Asterisks represent statistical significance (**, *** denote p-values ≤0.01 and 0.001, respectively), while ns denotes not statistically significant.
Hyperglycemia-induced hepatic lipid accumulation in MPCCs
We incubated MPCCs for 6 days with increasing concentrations of glucose (5, 25, 50, 100 mM). Lipid accumulation in PHH islands was then visualized using the Nile Red fluorescent stain, which was quantified using ImageJ software (http://imagej.nih.gov/ij/).27 Nile Red displays a characteristic shift in emission from red to yellow when bound to neutral lipids, such as triglycerides and cholesterol.28 PHHs in MPCCs increased their intracellular lipid content with increasing glucose concentrations in the culture medium (Fig. 5a). Quantitatively, PHHs treated with 25 mM glucose accumulated ∼256% more lipids, which saturated at 340% in 50 mM and 100 mM glucose compared with 5 mM glucose-treated cultures (Fig. 5b). Furthermore, albumin secretion by MPCCs was decreased by 12% after incubation with 25 mM glucose, 22% with 50 mM glucose, and 34% with 100 mM glucose relative to 5 mM glucose-treated cultures. Urea secretion by MPCCs was decreased by 12% after incubation with 50 mM glucose and 18% with 100 mM glucose relative to incubation with 5 mM glucose (Fig. 5c).
FIG. 5.

Hyperglycemia-induced lipid accumulation in MPCCs. (a) Representative images of Nile Red staining in the PHH island in 2-week-old MPCCs following treatment with increasing levels of glucose for 6 days (started when cultures were 1 week old). (b) Quantification of Nile Red fluorescence observed in panel (a). (c) Urea and albumin production in MPCCs following dosing with glucose as in panel (a). In all panels, data from a single representative cryopreserved PHH donor are shown, whereas trends were seen in at least two donors. Error bars represent SD. Scale bar is 400 μm. Asterisks represent statistical significance (*** denotes p-value ≤0.001). Color images available online at www.liebertpub.com/tec
Discussion
Due to its central role in glucose homeostasis, the liver is often at risk for developing diseases related to overnutrition, such as NAFLD, which has been linked to fibrosis, cirrhosis, hepatocarcinoma, and T2DM.4,29,30 PHHs cultured in vitro can provide a powerful tool to better understand the role of the human liver in the aforementioned diseases relative to their animal counterparts. In this study, we demonstrate that MPCCs containing cryopreserved PHHs and 3T3-J2 murine embryonic fibroblasts can be induced to undergo gluconeogenesis (i.e., de novo production of glucose from precursor substrates) for at least 3 weeks in vitro and that such responses are sensitive to insulin and glucagon with in vivo-like trends. In contrast, commonly employed conventional cultures created from the same PHH donor and under identical dosing conditions lost gluconeogenesis and hormonal responsiveness after only 3 days in culture, which is in agreement with other studies, and thus limits utility of such models for evaluating the chronic aspects of drug treatments and disease progression.19,31 Furthermore, even absolute glucose output from conventional cultures declined by 95–97% after 7 days in culture, whereas such output remained relatively stable in MPCCs for 2 weeks. The stable expression of PCK1 in MPCCs, as opposed to its declining expression in conventional cultures, may underlie these differences in glucose output. Indeed, inhibiting PCK1 using 3-mercaptopicolinc acid,26 reduced MPCC glucose output.
Culturing MPCCs in a high-glucose (25 mM) culture medium (i.e., feeding) led to significant stores of intracellular glycogen in PHH islands. Incubating these fed MPCCs in the glucose-free medium (i.e., starvation), and then in the presence of insulin inhibited glycogen lysis, while the presence of glucagon allowed the PHHs to lyse most of their glycogen stores. Once the hepatic glycogen stores were depleted following an ∼48-h starvation period in the glucose-free medium, PHHs in MPCCs cultured in the glucose-containing medium (re-feeding) synthesized glycogen when stimulated with insulin, whereas such synthesis was severely inhibited in the presence of glucagon relative to hormone-free controls. Thus, these results show that glycogen dynamics were observed in MPCCs with in vivo-relevant fasting and feeding trends.
A reduction in hepatic glucose production has been shown to be an effective treatment of hyperglycemia in patients with T2DM.32 Metformin, in particular, treats hyperglycemia mainly by decreasing gluconeogenesis.7 In this study, metformin reduced gluconeogenesis in MPCCs in a dose-dependent manner; however, doses of 10 times the maximal concentration of metformin observed in human blood (i.e., Cmax) were needed to elicit statistically significant downregulation of gluconeogenesis. The need for such a higher dose could be due to downregulation of key pathways in MPCCs being modulated by metformin and/or due to a higher concentration of metformin in the liver in vivo as a result of transporter-mediated uptake.33 Nonetheless, it is not uncommon during drug screening to use doses as high as 100-fold of a drug's anticipated Cmax to account for variability across individual patients in drug concentrations in the liver due to polymorphisms in drug metabolism enzymes and transporters.23,34 Such a strategy still allows effective rank ordering of structural analog drugs based on efficacy and toxicity and prioritization for further development. The effects of metformin on ATP levels in MPCCs were minimal, suggesting that it was efficacious without causing loss of cell viability. However, increasing doses of metformin decreased urea synthesis in MPCCs (data not shown), which merits further investigation since detoxification of ammonia into urea is a key liver function. Nonetheless, our data show that MPCCs provide the dual advantage of evaluating both the efficacy and toxicity of T2DM drug candidates due to the retention of not only glucose metabolism functions but also high activities of drug metabolism enzymes and transporters.22,35 Furthermore, the use of cryopreserved PHHs in MPCCs allows on-demand creation of cultures for drug screening applications.
Once glycogen stores in hepatocytes are saturated, glucose is shifted into pathways leading to fatty acid synthesis,36 thereby leading to accumulation of intracellular triglycerides and diacylglycerol. Such fat accumulation in hepatocytes has been linked to pathways involved in inducing insulin resistance.37 Abnormal lipid accumulation is defined as more than 5% of hepatocytes in the liver containing visible lipids.38 In this study, majority of the PHHs in MPCCs accumulated neutral lipids when incubated with increasing concentrations of glucose, up to 340% more lipids in high-glucose conditions (50–100 mM) compared with incubation in a physiologic level of glucose (5 mM). Other liver functions (albumin, urea) were also affected upon incubation with high levels of glucose; however, the effects on lipid accumulation were significantly greater (i.e., 256% increase in lipid content vs. 12% reduction in albumin secretion and no effect on urea secretion with 25 mM glucose incubation relative to 5 mM glucose control). These results suggest that MPCCs are capable of responding to hyperglycemia with in vivo-relevant trends while displaying basic liver functions, as would be the case in a live patient.
While our results show that, in contrast to conventional culture techniques, MPCCs have robust utility in the study of glucose metabolism, hormonal responsiveness, drug screening to reduce hepatic glucose output, and effects of hyperglycemia on PHHs, the culture method has limitations. In particular, we observed downregulation of gluconeogenesis by the third week of culture, which limits the ability to evaluate effects of overnutrition, drugs, and other stimuli over several months. Furthermore, PHHs in MPCCs produce ∼2.8-fold lower glucose following stimulation with glucagon than observed in vivo,39,40 which is likely due to the reduction in PCK1 transcript expression in MPCCs relative to thawed hepatocytes immediately before plating (data not shown). We also needed to use supraphysiologic concentrations of insulin to see robust downregulation of gluconeogenesis (i.e., 1 nM vs. 100 nM). Such deviations from physiological outcomes are likely due to incomplete presentation of microenvironmental cues in MPCCs that play modulatory roles in vivo (i.e., complex mixtures of ECM, liver stromal cells).41 For instance, Kupffer macrophages have been implicated in metabolic disorders.42,43
We chose 3T3-J2 fibroblasts as the support cell type in MPCCs because of ease of propagation, contact inhibition of growth in culture, lack of detectable liver functions, and induction of liver phenotype in hepatocytes from multiple species.22,44 Nonetheless, our preliminary studies indicate that the fibroblast monolayer can be mixed with Kupffer macrophages and liver sinusoidal endothelial cells (data not shown), which may ultimately improve PHH glucose metabolism. While the use of static media allows us to create MPCCs in industry-standard multiwell formats (i.e., 24- and 96-well plates) for higher throughput experimentation than larger formats (i.e., petri dishes, glass slides), perfusion of the culture medium in the future will allow subjecting PHHs and stromal cells in MPCCs to gradients of hormones, among other factors (i.e., oxygen), that are implicated in zonal liver functions in vivo.45
In conclusion, PHHs cultured in MPCCs displayed high levels of gluconeogenesis and glycogen lysis/synthesis, which were responsive to hormones (insulin, glucagon) with in vivo-relevant trends for at least 3 weeks. In contrast, gluconeogenesis and modulation with hormones were lost within 3 days in conventional PHH cultures. Furthermore, using prototypical drugs, we showed that MPCCs could be potentially useful for screening novel drug candidates that modulate gluconeogenesis in PHHs. Hyperglycemia induced significant lipid accumulation in PHHs in MPCCs, suggesting utility of this model to explore mechanisms underlying effects of T2DM on the human liver. Ultimately, the longevity of MPCCs for several weeks allows for the study of effects of repeat drug dosing and overnutrition on PHH functions, including glucose metabolism and insulin sensitivity.
Supplementary Material
Acknowledgments
The authors are grateful to Kimberly Ballinger, Dustin Berger, Christine Lin, and Brenton Ware at Colorado State University for assistance with cell culture. Funding for this research was provided by Colorado State University.
Disclosure Statement
Matthew D. Davidson: no competing financial interests exist; Michael Lehrer: no competing financial interests exist; Salman R. Khetani: Equity holder in Hepregen Corporation, which has licensed the MPCC technology from M.I.T. for drug development applications.
References
- 1.Haffner S.M., D'Agostino R., Mykkänen L., Tracy R., Howard B., Rewers M., Selby J., Savage P.J., and Saad M.F. Insulin sensitivity in subjects with type 2 diabetes. Relationship to cardiovascular risk factors: the Insulin Resistance Atherosclerosis Study. Diabetes Care 22, 562, 1999 [DOI] [PubMed] [Google Scholar]
- 2.Hanley A.J.G., Williams K., Festa A., Wagenknecht L.E., D'Agostino R.B., and Haffner S.M. Liver markers and development of the metabolic syndrome: the Insulin Resistance Atherosclerosis Study. Diabetes 54, 3140, 2005 [DOI] [PubMed] [Google Scholar]
- 3.Sanyal A.J., Campbell-Sargent C., Mirshahi F., Rizzo W.B., Contos M.J., Sterling R.K., Luketic V.A., Shiffman M.L., and Clore J.N. Nonalcoholic steatohepatitis: association of insulin resistance and mitochondrial abnormalities. Gastroenterology 120, 1183, 2001 [DOI] [PubMed] [Google Scholar]
- 4.Cusi K. Nonalcoholic fatty liver disease in type 2 diabetes mellitus. Curr Opin Endocrinol Diabetes Obes 16, 141, 2009 [DOI] [PubMed] [Google Scholar]
- 5.Samuel V.T., and Shulman G.I. Mechanisms for insulin resistance: common threads and missing links. Cell 148, 852, 2012 [DOI] [PMC free article] [PubMed] [Google Scholar]
- 6.Sherwin R.S. Role of liver in glucose homeostasis. Diabetes Care 3, 261, 1980 [DOI] [PubMed] [Google Scholar]
- 7.Viollet B., and Foretz M. Revisiting the mechanisms of metformin action in the liver. Ann Endocrinol (Paris) 74, 123, 2013 [DOI] [PubMed] [Google Scholar]
- 8.Tahrani A.A., Bailey C.J., Del Prato S., and Barnett A.H. Management of type 2 diabetes: new and future developments in treatment. Lancet 378, 182, 2011 [DOI] [PubMed] [Google Scholar]
- 9.Perry R.J., Samuel V.T., Petersen K.F., and Shulman G.I. The role of hepatic lipids in hepatic insulin resistance and type 2 diabetes. Nature 510, 84, 2014 [DOI] [PMC free article] [PubMed] [Google Scholar]
- 10.Tao H., Zhang Y., Zeng X., Shulman G.I., and Jin S. Niclosamide ethanolamine–induced mild mitochondrial uncoupling improves diabetic symptoms in mice. Nat Med 20, 1263, 2014 [DOI] [PMC free article] [PubMed] [Google Scholar]
- 11.Olson H., Betton G., Robinson D., Thomas K., Monro A., Kolaja G., Lilly P., Sanders J., Sipes G., Bracklen W., Dorato M., Van Deun K., Smith P., Berger B., and Heller A. Concordance of the toxicity of pharmaceuticals in humans and in animals. Regul Toxicol Pharmacol 32, 56, 2000 [DOI] [PubMed] [Google Scholar]
- 12.Shih H., Pickwell G.V., Guenette D.K., Bilir B., and Quattrochi L.C. Species differences in hepatocyte induction of CYP1A1 and CYP1A2 by omeprazole. Hum Exp Toxicol 18, 95, 1999 [DOI] [PubMed] [Google Scholar]
- 13.Raman P., Donkin S.S., and Spurlock M.E. Regulation of hepatic glucose metabolism by leptin in pig and rat primary hepatocyte cultures. Am J Physiol Regul Integr Comp Physiol 286, R206, 2004 [DOI] [PubMed] [Google Scholar]
- 14.Guillouzo A., and Guguen-Guillouzo C. Evolving concepts in liver tissue modeling and implications for in vitro toxicology. Expert Opin Drug Metab Toxicol 4, 1279, 2008 [DOI] [PubMed] [Google Scholar]
- 15.LeCluyse E.L., Witek R.P., Andersen M.E., and Powers M.J. Organotypic liver culture models: meeting current challenges in toxicity testing. Crit Rev Toxicol 42, 501, 2012 [DOI] [PMC free article] [PubMed] [Google Scholar]
- 16.Wilkening S., Stahl F., and Bader A. Comparison of primary human hepatocytes and hepatoma cell line Hepg2 with regard to their biotransformation properties. Drug Metab Dispos 31, 1035, 2003 [DOI] [PubMed] [Google Scholar]
- 17.Hariparsad N., Carr B.A., Evers R., and Chu X. Comparison of immortalized Fa2N-4 cells and human hepatocytes as in vitro models for cytochrome P450 induction. Drug Metab Dispos 36, 1046, 2008 [DOI] [PubMed] [Google Scholar]
- 18.Godoy P., Hewitt N.J., Albrecht U., Andersen M.E., Ansari N., Bhattacharya S., Bode J.G., Bolleyn J., Borner C., Böttger J., Braeuning A., Budinsky R.A., Burkhardt B., Cameron N.R., Camussi G., Cho C.-S., Choi Y.-J., Craig Rowlands J., Dahmen U., Damm G., Dirsch O., Donato M.T., Dong J., Dooley S., Drasdo D., Eakins R., Ferreira K.S., Fonsato V., Fraczek J., Gebhardt R., Gibson A., Glanemann M., Goldring C.E.P., Gómez-Lechón M.J., Groothuis G.M.M., Gustavsson L., Guyot C., Hallifax D., Hammad S., Hayward A., Häussinger D., Hellerbrand C., Hewitt P., Hoehme S., Holzhütter H.-G., Houston J.B., Hrach J., Ito K., Jaeschke H., Keitel V., Kelm J.M., Kevin Park B., Kordes C., Kullak-Ublick G.A., LeCluyse E.L., Lu P., Luebke-Wheeler J., Lutz A., Maltman D.J., Matz-Soja M., McMullen P., Merfort I., Messner S., Meyer C., Mwinyi J., Naisbitt D.J., Nussler A.K., Olinga P., Pampaloni F., Pi J., Pluta L., Przyborski S.A., Ramachandran A., Rogiers V., Rowe C., Schelcher C., Schmich K., Schwarz M., Singh B., Stelzer E.H.K., Stieger B., Stöber R., Sugiyama Y., Tetta C., Thasler W.E., Vanhaecke T., Vinken M., Weiss T.S., Widera A., Woods C.G., Xu J.J., Yarborough K.M., and Hengstler J.G. Recent advances in 2D and 3D in vitro systems using primary hepatocytes, alternative hepatocyte sources and non-parenchymal liver cells and their use in investigating mechanisms of hepatotoxicity, cell signaling and ADME. Arch Toxicol 87, 1315, 2013 [DOI] [PMC free article] [PubMed] [Google Scholar]
- 19.Lu Y., Zhang G., Shen C., Uygun K., Yarmush M.L., and Meng Q. A novel 3D liver organoid system for elucidation of hepatic glucose metabolism. Biotechnol Bioeng 109, 595, 2012 [DOI] [PMC free article] [PubMed] [Google Scholar]
- 20.Bhatia S.N., Balis U.J., Yarmush M.L., and Toner M. Effect of cell-cell interactions in preservation of cellular phenotype: cocultivation of hepatocytes and nonparenchymal cells. FASEB J 13, 1883, 1999 [DOI] [PubMed] [Google Scholar]
- 21.Guguen-Guillouzo C., Clément B., Baffet G., Beaumont C., Morel-Chany E., Glaise D., and Guillouzo A. Maintenance and reversibility of active albumin secretion by adult rat hepatocytes co-cultured with another liver epithelial cell type. Exp Cell Res 143, 47, 1983 [DOI] [PubMed] [Google Scholar]
- 22.Khetani S.R., and Bhatia S.N. Microscale culture of human liver cells for drug development. Nat Biotechnol 26, 120, 2008 [DOI] [PubMed] [Google Scholar]
- 23.Khetani S.R., Kanchagar C., Ukairo O., Krzyzewski S., Moore A., Shi J., Aoyama S., Aleo M., and Will Y. Use of micropatterned co-cultures to detect compounds that cause drug induced liver injury in humans. Toxicol Sci 132, 107, 2012 [DOI] [PubMed] [Google Scholar]
- 24.Rheinwald J.G., and Green H. Serial cultivation of strains of human epidermal keratinocytes: the formation of keratinizing colonies from single cells. Cell 6, 331, 1975 [DOI] [PubMed] [Google Scholar]
- 25.Schmittgen T.D., and Livak K.J. Analyzing real-time PCR data by the comparative C(T) method. Nat Protoc 3, 1101, 2008 [DOI] [PubMed] [Google Scholar]
- 26.Robinson B.H., and Oei J. 3-Mercaptopicolinic acid, a preferential inhibitor of the cytosolic phosphoenolpyruvate carboxykinase. FEBS Lett 58, 12, 1975 [DOI] [PubMed] [Google Scholar]
- 27.Collins T.J. ImageJ for microscopy. BioTechniques 43 (1 Suppl), 25, 2007 [DOI] [PubMed] [Google Scholar]
- 28.Diaz G., Melis M., Batetta B., Angius F., and Falchi A.M. Hydrophobic characterization of intracellular lipids in situ by Nile Red red/yellow emission ratio. Micron 39, 819, 2008 [DOI] [PubMed] [Google Scholar]
- 29.Smith B.W., and Adams L.A. Nonalcoholic fatty liver disease and diabetes mellitus: pathogenesis and treatment. Nat Rev Endocrinol 7, 456, 2011 [DOI] [PubMed] [Google Scholar]
- 30.Koppe S.W.P. Obesity and the liver: nonalcoholic fatty liver disease. Transl Res 164, 312, 2014 [DOI] [PubMed] [Google Scholar]
- 31.Yamada S., Otto P.S., Kennedy D.L., and Whayne T.F. The effects of dexamethasone on metabolic activity of hepatocytes in primary monolayer culture. In Vitro 16, 559, 1980 [DOI] [PubMed] [Google Scholar]
- 32.Wu C., Okar D.A., Kang J., and Lange A.J. Reduction of hepatic glucose production as a therapeutic target in the treatment of diabetes. Curr Drug Targets Immune Endocr Metabol Disord 5, 51, 2005 [DOI] [PubMed] [Google Scholar]
- 33.Wang D.-S., Jonker J.W., Kato Y., Kusuhara H., Schinkel A.H., and Sugiyama Y. Involvement of organic cation transporter 1 in hepatic and intestinal distribution of metformin. J Pharmacol Exp Ther 302, 510, 2002 [DOI] [PubMed] [Google Scholar]
- 34.Xu J.J., Henstock P.V., Dunn M.C., Smith A.R., Chabot J.R., and de Graaf D. Cellular imaging predictions of clinical drug-induced liver injury. Toxicol Sci 105, 97, 2008 [DOI] [PubMed] [Google Scholar]
- 35.Ploss A., Khetani S.R., Jones C.T., Syder A.J., Trehan K., Gaysinskaya V.A., Mu K., Ritola K., Rice C.M., and Bhatia S.N. Persistent hepatitis C virus infection in microscale primary human hepatocyte cultures. Proc Natl Acad Sci U S A 107, 3141, 2010 [DOI] [PMC free article] [PubMed] [Google Scholar]
- 36.Postic C., and Girard J. Contribution of de novo fatty acid synthesis to hepatic steatosis and insulin resistance: lessons from genetically engineered mice. J Clin Invest 118, 829, 2008 [DOI] [PMC free article] [PubMed] [Google Scholar]
- 37.Nagle C.A., Klett E.L., and Coleman R.A. Hepatic triacylglycerol accumulation and insulin resistance. J Lipid Res 50 Suppl S74, 2009 [DOI] [PMC free article] [PubMed] [Google Scholar]
- 38.Kleiner D.E., Brunt E.M., Van Natta M., Behling C., Contos M.J., Cummings O.W., Ferrell L.D., Liu Y.-C., Torbenson M.S., Unalp-Arida A., Yeh M., McCullough A.J., and Sanyal A.J. Design and validation of a histological scoring system for nonalcoholic fatty liver disease. Hepatology 41, 1313, 2005 [DOI] [PubMed] [Google Scholar]
- 39.Sohlenius-Sternbeck A.-K. Determination of the hepatocellularity number for human, dog, rabbit, rat and mouse livers from protein concentration measurements. Toxicol In Vitro 20, 1582, 2006 [DOI] [PubMed] [Google Scholar]
- 40.Rothman D.L., Magnusson I., Katz L.D., Shulman R.G., and Shulman G.I. Quantitation of hepatic glycogenolysis and gluconeogenesis in fasting humans with 13C NMR. Science 254, 573, 1991 [DOI] [PubMed] [Google Scholar]
- 41.Kmieć Z. Cooperation of liver cells in health and disease. Adv Anat Embryol Cell Biol 161, III, 2001 [DOI] [PubMed] [Google Scholar]
- 42.Baffy G. Kupffer cells in non-alcoholic fatty liver disease: the emerging view. J Hepatol 51, 212, 2009 [DOI] [PMC free article] [PubMed] [Google Scholar]
- 43.Huang W., Metlakunta A., Dedousis N., Zhang P., Sipula I., Dube J.J., Scott D.K., and O'Doherty R.M. Depletion of liver Kupffer cells prevents the development of diet-induced hepatic steatosis and insulin resistance. Diabetes 59, 347, 2010 [DOI] [PMC free article] [PubMed] [Google Scholar]
- 44.Ukairo O., Kanchagar C., Moore A., Shi J., Gaffney J., Aoyama S., Rose K., Krzyzewski S., McGeehan J., Anderson M.E., Khetani S.R., and LeCluyse E.L. Long-term stability of primary rat hepatocytes in micropatterned cocultures. J Biochem Mol Toxicol 27, 204, 2013 [DOI] [PubMed] [Google Scholar]
- 45.Jungermann K., and Kietzmann T. Zonation of parenchymal and nonparenchymal metabolism in liver. Annu Rev Nutr 16, 179, 1996 [DOI] [PubMed] [Google Scholar]
Associated Data
This section collects any data citations, data availability statements, or supplementary materials included in this article.