Significance
Mammalian genomes are replete with silent endogenous retroviruses (ERVs). Inappropriate ERV activation in dividing cells is particularly dangerous because it can produce oncogenic mutations via new ERV insertions. Here, we show that endogenous and exogenous retroviruses are repressed in B lymphocytes from adult mice by methylation of histones that package viral DNA into repressive chromatin. These findings contrast with current models, which posit that histone methylation is dispensable for ERV repression in postembryonic tissues. We also show that ERV activation upon loss of histone methylation relies on specific sets of transcription factors in a given cell type. Our findings uncover new mechanisms of genome stability and viral repression in mammalian cells of adult origin.
Keywords: epigenetics, histone methylation, repression, transposable elements, retroviruses
Abstract
Genome stability relies on epigenetic mechanisms that enforce repression of endogenous retroviruses (ERVs). Current evidence suggests that distinct chromatin-based mechanisms repress ERVs in cells of embryonic origin (histone methylation dominant) vs. more differentiated cells (DNA methylation dominant). However, the latter aspect of this model has not been tested. Remarkably, and in contrast to the prevailing model, we find that repressive histone methylation catalyzed by the enzyme SETDB1 is critical for suppression of specific ERV families and exogenous retroviruses in committed B-lineage cells from adult mice. The profile of ERV activation in SETDB1-deficient B cells is distinct from that observed in corresponding embryonic tissues, despite the loss of repressive chromatin modifications at all ERVs. We provide evidence that, on loss of SETDB1, ERVs are activated in a lineage-specific manner depending on the set of transcription factors available to target proviral regulatory elements. These findings have important implications for genome stability in somatic cells, as well as the interface between epigenetic repression and viral latency.
Repressive chromatin is a biochemical platform for many cellular processes (1), including gene silencing during development and the suppression of potentially mutagenic repetitive elements, such as endogenous retroviruses (ERVs). The formation and maintenance of repressive chromatin rely on epigenetic modification of its DNA and nucleosome components, including hypermethylation of CpG dinucleotides by DNA methyltransferases (DNMTs). DNA methylation patterns are conserved during replication, and this modification is thought to provide the most stable form of repression (1). An important modification for initiating repressive chromatin formation is trimethylation of histone H3 at the lysine 9 position (H3K9me3) by two major histone methyltransferases (HMTs). Suppressor Of Variegation 3-9 Homolog (SUV39H)1/2 complexes maintain this modification at constitutive heterochromatin and most long interspersed nuclear elements (LINEs), which together encompass the vast majority of H3K9me3 in chromatin (2, 3). In contrast, the HMT called SET Domain, Bifurcated 1 (SETDB1 a.k.a. ESET) is targeted primarily to ERVs, which must be silenced to maintain genome and transcriptome integrity (4).
Long terminal repeat (LTR)-containing ERVs represent ∼10% of human and mouse genomes (5). Although most are defunct genomic artifacts, many species contain a substantial number of active ERVs (6). In mice, ERV expression is tissue and strain specific. The intracisternal A particle (IAP) and early transposon/Mus musculus type D (ETn/MusD) families of ERVs are expressed predominantly in early embyronic tissues. One consequence of this de-repression is the acquisition of spontaneous germ-line mutations, with IAP and ETn retrotransposition accounting for nearly 15% of these genomic alterations in mice (5). Likewise, B lymphocytes from leukemia-prone strains activate endogenous murine leukemia viruses (MLVs) or mouse mammary tumor viruses (MMTVs). Reintegration of these expressed viruses can generate mutations with potential oncogenic consequences (7). Thus, suppression of ERVs via epigenetic mechanisms is especially important in adult tissues that harbor cells with a high proliferative capacity.
Recent studies suggest that the mechanisms of ERV repression in differentiated adult tissues are distinct from those in embryonic stem cells (ESCs) or early lineage progenitors (3). In fully differentiated cells, such as fibroblasts, DNA methylation appears to be particularly important for ERV suppression, whereas HMTs responsible for H3K9me3 are largely dispensable (3, 4). In contrast, ESC and primordial germ cells rely on H3K9me3 for ERV repression, a process that is independent of CpG methylation by DNMTs (8). For LTR-containing ERVs, the repressive H3K9me3 modification is mediated by SETDB1, which is targeted by its interactions with KAP1 and sequence-specific zinc finger proteins (ZFPs). Depletion of either SETDB1 or KAP1 activates expression of IAPs, ETns, and other ERV families in ESCs (4, 9). However, suppression of these ERV families is maintained in differentiated cells lacking KAP1 or SETDB1 (9). Thus, available evidence suggests that KAP1:SETDB1 complexes are important for initial repression of ERVs in embryonic cells, whereas DNA methylation is critical for their silencing in differentiated tissues. However, a definitive test that ERV repression is HMT independent in any adult differentiated cell types is lacking. Here, we test this model via conditional deletion of SETDB1 in developing B lymphocytes. We find that SETDB1 functions as an epigenetic repressor of all ERVs in these lineage-committed cells, but that transcriptional activation of specific ERVs relies on the regulatory architecture of their LTRs and the availability of corresponding transcription factors.
Results
SETDB1 Is Required for B-Cell Development.
An outstanding question is whether HMTs are required to maintain ERV repression in the more physiologic setting of differentiated cells from an adult animal. For this purpose, we selectively removed Setdb1 in the B-lymphocyte lineage, which offers a well-defined developmental pathway characterized in great molecular detail.
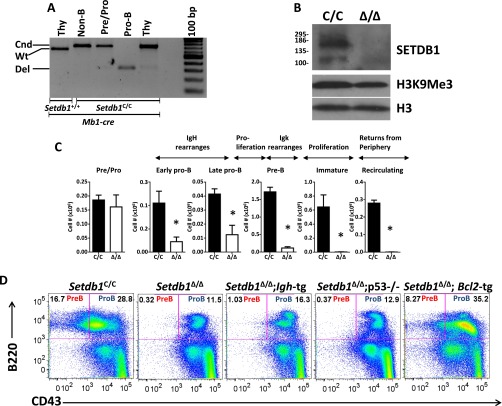
Genetic ablation of Setdb1 (Δ/Δ) was achieved by crossing mice harboring published conditional alleles (Setdb1 C/C) (4) with an Mb1-Cre driver (10), which efficiently deletes floxed exons and abrogates SETDB1 protein expression at the earliest stages of B-cell development (pro-B cells; Fig. S1 A and B). Consistent with prior findings (4), SETDB1 depletion only modestly reduces global H3K9me3 levels (Fig. S1B). Despite these modest methylation defects, SETDB1 deficiency significantly impacts the pro-B-cell compartment and nearly abolishes bone marrow and splenic B-cell populations corresponding to later stages of development (Fig. 1A and Fig. S1 C and D). Prior studies, in which KAP1 was deleted in B-lineage cells, reported only modest developmental defects (11). However, direct comparisons with our results cannot be made because a CD19-cre driver was used, which does not mediate complete Kap1 deletion in progenitor B cells (10).
Fig. S1.
SETDB1 is required for B-lymphocyte development. (A) PCR assay for excision of floxed Setdb1 exons (4). Bands corresponding to the conditional (Cnd), WT (Wt), or deleted (Del) alleles are indicated on the right. Bone marrow cells from Mb1-cre or Setdb1C/C:Mb1-cre mice were FACs sorted into the following subsets: non-B (B220—), pre/pro-B (B220+CD43+CD19—), and pro-B (B220+CD43+CD19+). Thymocytes from these animals were used as controls. (B) Western blot analysis of SETDB1 protein and global H3K9me3 levels in sorted pro-B cells from Setdb1C/C and Setdb1Δ/Δ mice. (C) Developmental B-cell subsets in bone marrow from SETDB1-deficient (Δ/Δ) and control animals (C/C) were quantified by flow cytometry as described previously (11). Key features of developmental stages are indicated at the top. The average number of each subset per femur is shown for three independent experiments (±SEM; *P < 0.05, Student t test). (D) FACS plots for bone marrow cells from the indicated mouse genotypes. Pro-B and pre-B-cell subsets are highlighted. Shown are the results of a representative experiment selected from at least three independent replicates.
Fig. 1.
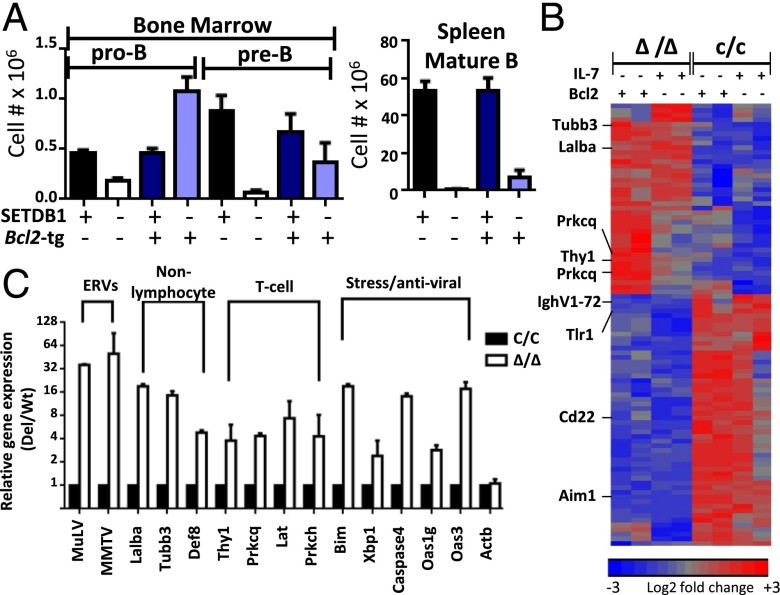
SETDB1 is required for B-lymphocyte development and transcriptional identity. (A) B-cell developmental subsets in bone marrow and spleen were quantified by flow cytometry. Genotypes for Setdb1 (C/C, + and ∆/∆, –) and the Bcl2 transgene (tg) are indicated. Bone marrow IgM–CD19+ cells were categorized as pro-B (CD43+) or pre-B (CD43–) cells. Splenic mature B cells were defined as CD19+. Shown is the average of three independent experiments. Data are represented as mean ± SEM. (B) Heat maps summarizing microarray data for differentially expressed genes in Setdb1C/C and Setdb1Δ/Δ pro-B cells. Gene expression analyses were performed on Bcl2-tg (Bcl2+) bone marrow cells cultured in IL-7 for 4 d (IL-7+) or on pro-B cells sorted directly from bone marrows of the indicated genotypes (Bcl2– and IL-7–). Genes with enhanced expression in SETDB1-deficent pro-B cells are indicated as red, whereas down-regulated genes are shown in blue. (C) Validation of microarray data by qRT-PCR for a selected set of differentially expressed genes. Analyses were performed on RNA from IL-7 cultures of Setdb1Δ/Δ:Bcl2 pro-B cells and values were normalized to those for analogous Setdb1C/C:Bcl2 cultures, which were set to a relative value of 1. Genes were divided into classes based on the tissues or pathways in which they are normally expressed.
Differentiation of pro-B cells to the next developmental stage (pre-B cells) requires the functional assembly of Ig heavy chain genes (Igh) by the process of V(D)J recombination, which is also regulated by changes in histone modifications (12). However, the pro-B to pre-B transition is not rescued in Setdb1Δ/Δ animals by provision of a preassembled Igh transgene, suggesting that V(D)J recombination is not the primary defect (Fig. S1D). IgH protein expression facilitates pro-B-cell differentiation by providing both proliferative and survival signals. Indeed, previous studies have implicated SETDB1 in viability programs for many cell types, either through regulation of P53 or caspases (13, 14). Although P53 deficiency fails to rescue B-cell development in the Setdb1Δ/Δ background (Fig. S1D), suppression of caspase pathways, via expression of the anti-apoptotic BCL2 protein, restores pro-B and pre-B-cell compartments, but not those corresponding to later stages of B-cell development in the bone marrow and spleen (Fig. 1A and Fig. S1D). Thus, SETDB1 is essential for B-cell development beginning at its earliest stages, likely providing a prosurvival function.
Cellular and Molecular Defects in B Lymphocytes Lacking SETDB1.
The rescue of Setdb1Δ/Δ B-cell precursors by BCL2 allowed us to examine the molecular and cellular pathways under SETDB1 control. Consistent with the inability of an Igh transgene to rescue the pro-B to pre-B transition, rearrangement of the endogenous Igh locus is grossly normal in Setdb1Δ/Δ pro-B cells overexpressing BCL2 (Fig. S2A). However, when cultured ex vivo in media containing the IL-7 growth factor, SETDB1-deficent pro-B cells fail to proliferate (Fig. S2B). To identify gene expression defects in cells lacking this HMT, we performed microarray and RNA-seq analyses on Bcl2 transgenic pro-B cells from Setdb1Δ/Δ mice after short-term growth in IL-7 cultures. As summarized in Fig. 1B and Table S1, the expression of 41 genes is increased and 53 genes decreased by greater than 1.5-fold in Setdb1Δ/Δ pro-B cultures compared with their WT counterparts. These expression differences are largely recapitulated in primary pro-B cells sorted directly from bone marrows of each genotype. Consistent with observed developmental blocks in the mutant mice, ontology analysis revealed that attenuated genes are enriched for those implicated in B-cell differentiation and activation (Table S2). In sharp contrast, loss of SETDB1 in pro-B cells enhanced the expression of numerous genes normally associated with innate immunity or with nonhematopoietic lineages (Table S2). A subset of gene expression differences was verified in both cultured and primary pro-B cells using quantitative (q)RT-PCR (Fig. 1C). For example, expression of lacta-alblumin (lalba), a mammary cell-specific gene, is de-repressed in Setdb1Δ/Δ pro-B cells. Defects in the B lineage program are further evidenced by activation of several T cell-specific genes, including Prkcq, Lat, Prkch, and Thy1. The latter gene encodes a surface glycoprotein, which is expressed on primary pro-B cells from Setdb1Δ/Δ bone marrow but not their Setdb1C/C counterparts (Fig. S2C).
Fig. S2.
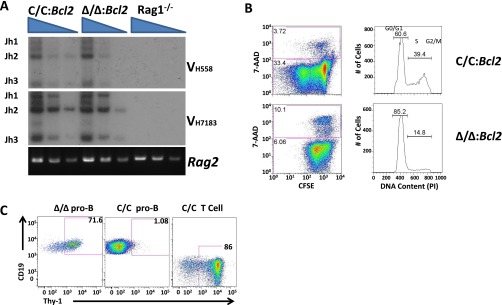
IgH recombination and proliferation of SETDB1-deficient pro-B cells. (A) VH to DHJH recombination for Igh was quantified in genomic DNA for the indicated genotypes of sorted pro-B cells (bone marrow CD19+CD43+) as described previously (28). Fivefold titrations of each sample are shown and relative positions of amplicons corresponding to rearrangements involving JH1-3 are indicated on the left. A control PCR for the Rag2 coding exon is provided in the bottom panel. (B, Left) Proliferation of Setdb1C/C and Setdb1Δ/Δ pro-B cells was measured by pulsing with the cell-permeable dye CFSE, followed by 4 d of additional culture in IL-7–containing media. Cultured cells were then stained with 7-AAD to monitor viability (7-AAD−) and analyzed by flow cytometry for CFSE dilution, which indicates proliferation. (Right) Cell cycle analysis was performed on the same cultures using propidium iodide (PI) stains. The PIlow population corresponds to cells in G0/G1, whereas PImid and PIhigh cells are in S and G2/M, respectively. (C) Surface staining of Thy1.2 and CD19 on bone marrow cells for the indicated genotypes. T cells were identified as CD3+CD19– and pro-B cells as CD19+CD43+.
Table S1.
Transcripts differentially regulated in Setdb1 Δ/Δ B cells and Setdb1 C/C pro-B cells
| Up-regulated | Down-regulated | |||
| Vmn2r96 | Clgn | Ms4a1 | Tlr1 | Myo1e |
| Lalba | Agrn | V165-d-J-C mu | Btla | Cd22 |
| Gm5111 | Prdm15 | Igk-V28 | Cd22 | Cd83 |
| Tubb3 | Cldn4 | Iglc1 | Iglv1 | Ralgps2 |
| Thy1 | Dnahc17 | Brwd1 | Cpm | Ikzf3 |
| BC005685 | Myl10 | IghV1-72 | Rasgrp1 | Hpgd |
| Gm3579 | Fads2 | Cd55 | Ms4a4c | Spic |
| Trib3 | Uaca | Bank1 | Tcf12 | Ctsh |
| Clgn | Bcat1 | Fcer2a | P2ry10 | Neurl3 |
| Stag3 | Sfmbt2 | Cd55 | H2-Eb1 | |
| Abca13 | Enah | Hdac9 | Ms4a6c | |
| Sparc | Gldc | Pgap1 | H2-DMb1 | |
| Arpp21 | Pcdh9 | Cd38 | Il4i1 | |
| Trim24 | Iqcg | Cd2 | Angptl1 | |
| St6galnac5 | Prkch | Ighm | H2-Aa | |
| Dntt | Acoxl | Fcrl1 | Cmah | |
| Gm5111 | Bcl2l11 | Scd1 | Aim1 | |
| Prkcq | Eng | Ighv1-72 | Zfp318 | |
| Akap5 | Cst7 | Tlr1 | Fcer2a | |
| Inadl | Gstt2 | H2-DMb2 | Arhgap27 | |
| Ide | Cd74 | Atp6v0a1 | ||
Supplement to Fig. 1B. Genes significantly enriched or depleted in Setdb1 Δ/Δ pro-B cells according to microarray analysis are shown below.
Table S2.
Gene ontology analysis of the dysregulated transcriptome in SETDB1-deficient pro-B cells
| GO no. | GO term | P value |
| 0006955 | Immune response | 5.42E−22 |
| 0051707 | Response to other organism | 2.56E−17 |
| 0098542 | Defense response to other organism | 1.18E−16 |
| 0045087 | Innate immune response | 8.25E−14 |
| 0006954 | Inflammatory response | 1.63E−13 |
| 0042742 | Defense response to bacterium | 3.17E−12 |
| 0006950 | Response to stress | 8.57E−12 |
| 0009615 | Response to virus | 5.80E−08 |
| 0002376 | Immune system process | 2.95E−06 |
| 0042113 | B-cell activation | 7.92E−06 |
| 0030183 | B-cell differentiation | 4.55E−04 |
RNA-seq data were used to identify the collection of genes whose expression is perturbed ≥ 1.75-fold in Setdb1Δ/Δ vs. control pro-B cells. The potentiated and attenuated genes were analyzed separately in Gorilla gene ontology (cbl-gorilla.cs.technion.ac.il/) and the top enriched GO terms are shown.
SETDB1 Regulates ERVs in Committed B-Lineage Cells.
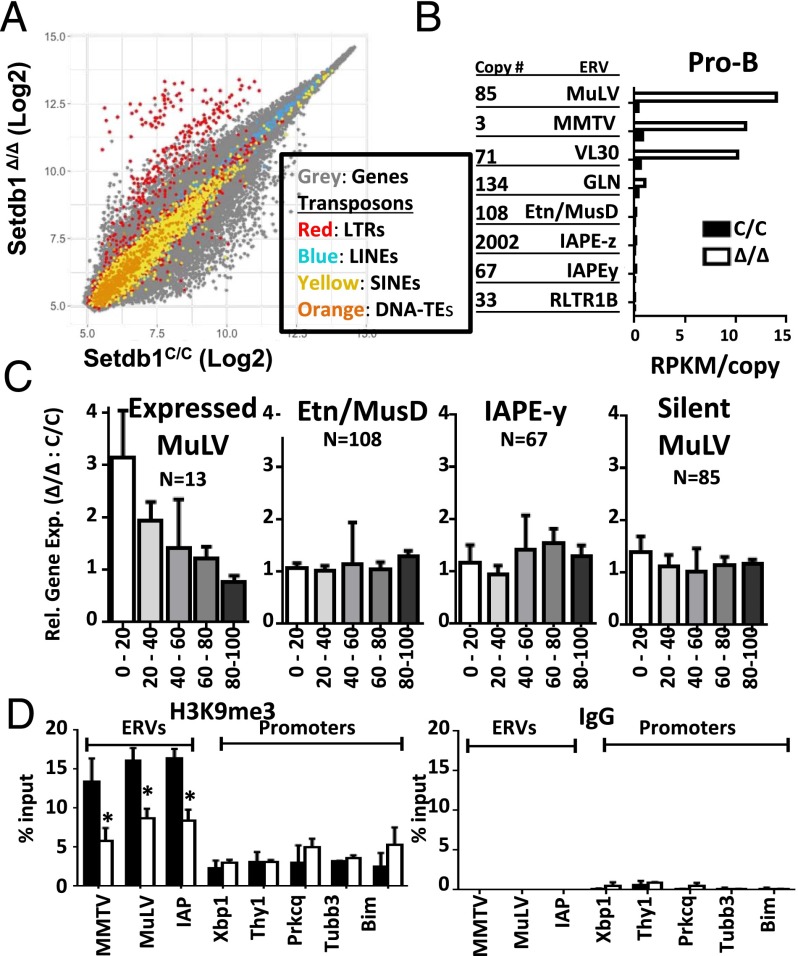
A key goal of our study is to determine whether histone methylation by SETDB1 represses ERVs in lineage-committed cells from adults. As shown in Fig. 2A, lineage-committed pro-B cells from Setdb1Δ/Δ mice de-repress a subset of LTR-containing ERVs, but not other transposable elements (e.g., LINEs and SINEs). The dysregulated ERVs belong to only three families as revealed by RNA-seq, namely MLV, MMTV, and VL30 (Fig. 2B and Dataset S1), which we confirmed by qRT-PCR (Fig. 1C). Importantly, these data discount the notion that HMTs are dispensable for ERV repression in lineage-committed cells from adult animals.
Fig. 2.
SETDB1 is a key suppressor of ERVs in B lymphocytes. (A) Comparison of expression array data for IL-7 cultures of pro-B cells from Setdb1Δ/Δ:Bcl2 and Setdb1C/C:Bcl2 bone marrows. Probes are classified as those mapping to coding genes (gray dots) or repetitive elements (colored dots). Results are presented as probe expression averages for each genotype from four independent microarray experiments. (B) Expression of LTR transposon families as measured by RNA-seq. Total reads were mapped to canonical proviral sequences for counting and normalized for copy numbers within each family of repetitive element. (C) Expression changes in genes whose transcriptional start sites are within the indicated distances from MLV, ETn, and IAPE-y proviral LTRs. MLV proviruses were divided into up-regulated (>10×) or unchanged proviruses (<2×) based on expression changes following SETDB1 deletion. Data are derived from RNA-seq analysis of IL-7 cultures corresponding to Bcl2 transgenic cells with the indicated Setdb1 genotypes. (D) Levels of H3K9me3 at ERVs and neighboring gene promoters were measured by ChIP. Control assays were performed with isotype-matched antibody (IgG). ChIP data are representative of three independent experiments and are shown as mean ± SD (*P < 0.05, Student t test).
The de-repressed ERVs likely play a role in altering gene expression programs of Setdb1Δ/Δ pro-B cells as evidenced by a significant enhancement in the expression of genes proximal to transcriptionally reactivated MLVs (Fig. 2C). In contrast, the expression of genes located proximal to ERV families that remain repressed in the mutant pro-B cells (ETn, IAPE-y) is not significantly affected. Because the Setdb1Δ/Δ and control littermates were on a mixed genetic background (C57/CBA), we cannot preclude the possibility that unmapped ERVs from the incomplete CBA genome contribute to local effects on gene transcription. As such, we focus only on definitively annotated ERVs from the complete C57 genome (Fig. S3 A and B; see Materials and Methods for detailed criteria). With a single exception (Lalba), potentiated expression of these genes could not be attributed to chimeric transcripts (Fig. S3C), suggesting that the dysregulated ERVs are functioning as enhancers in pro-B cells. Consistent with this notion, H3K9me3 is reduced on ERVs that are de-repressed, but the low levels of this modification remain unchanged on promoters of neighboring genes whose expression is augmented by SETDB1 deficiency (Fig. 2D). Together, these findings indicate that SETDB1 is essential for repressing a subset of ERVs in adult somatic cells, a critical epigenetic process for enforcing lineage-specific expression programs.
Fig. S3.
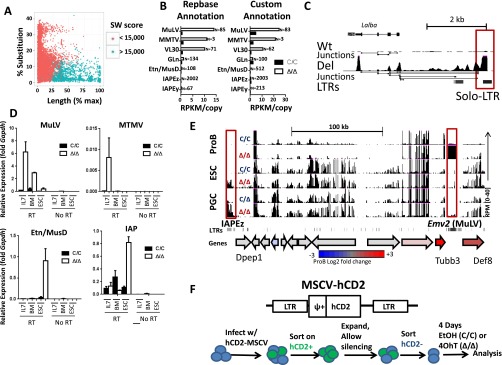
ERV expression in primary pro-B cells. (A) Validation of Smith–Watterman (SW) score cutoff used in classifications. Sequences of repeatmasker annotated ERVs were compared with deposited Repbase sequences and scored for percentage of sequence substitution or length mismatch. ERV annotations were then grouped by a SW cutoff of 15,000. (B) Expression of LTR transposon families as measured by RNA-seq. Total reads were mapped to canonical proviral sequences either annotated in the published Repeatmasker database (SW > 15,000) or a custom annotation using the Cross_Match algorithm (SW > 10,000). Total number of repeative elements were used for counting and normalized for copy numbers within each family of repetitive element. (C) Screen shot (UCSC genome browser) for RNA-seq data from pro-B cells corresponding to the indicated genotypes (0–40 reads per million), which highlights the chimeric ERV-Lalba transcript in Setdb1Δ/Δ cells. RNA-seq junctions are shown below the RPKM tracks. Solo LTR transposons are highlighted by red boxes (*P < 0.05, Student t test). (D) Relative levels of ERV transcripts in pro-B cells and ESC were quantified by qRT-PCR for the indicated genotypes. Pro-B cells were harvested from either IL-7 cultures (Bcl2-transgenic) or sorted directly from bone marrow (BM). For ESC, Setdb1 was excised using tamoxifen-cre and cells were cultured for 4 d following deletion. Control PCR reactions lacking cDNA (no RT) are shown at the right of each panel. Results are averages of three independent experiments, and data are represented as mean ± SEM. (E) Screen shot (UCSC genome browser) for RNA-seq data from pro-B, ESC, and PGCs corresponding to the indicated genotypes (0–40 reads per million). Full-length LTR transposons are highlighted by red boxes. The panels below show positions of ERV-LTRs and a cartoon depiction of coding genes within the region. The latter is color-coded for relative gene expression (microarray data) in mutant vs. WT pro-B cells (red, up-regulated in Setdb1∆/∆; gray, no change; blue, down-regulated in Setdb1∆/∆). (F) Plasmid map and flowchart for the experiment shown in Fig. 4.
ERV Repression Is Cell Type Specific.
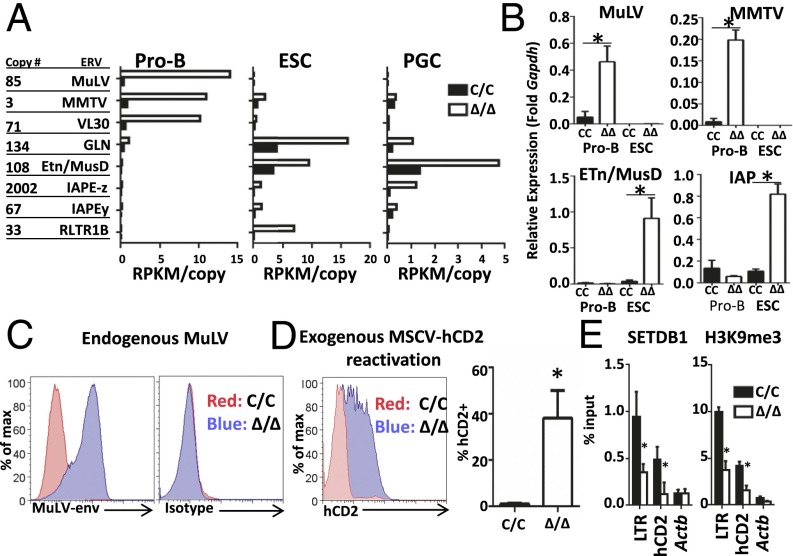
Although ERV repression clearly depends on SETDB1 in pro-B and embryo-derived cells, disruption of this silencing mechanism could have distinct consequences, which may, in turn, be linked to the transcriptional potential of an ERV family in a given cell type. Indeed, global analysis of RNA-seq data from pro-B cells, ESCs, and primordial germ cells (PGCs) revealed de-repression of different ERV families on Setdb1 deletion (Fig. 3A) (4, 15). Loss of SETDB1 induces a robust expression of MLV, MMTV, and VL30 families in pro-B cells. By comparison, these ERVs remain silent (MMTV and VL30) or are expressed at much lower levels (MLV) in SETDB1-deficient ESCs and PGCs (Fig. 3A). A distinct program of ERV activation is observed in ESCs and PGCs lacking SETDB1, which induce expression of the IAPE-z, GLn, and ETn/MusD families.
Fig. 3.
Specificity of ERV activation in SETDB1-deficient cells. (A) Expression of ERV families in ESC, PGC, and pro-B-cell cultures (IL-7) from Setdb1Δ/Δ:Bcl2 and Setdb1C/C:Bcl2 mice. RNA-seq for ESC and PGC are from published sources (4, 15). Reads were mapped to canonical proviral sequences and normalized for repetitive element copy number. (B) Quantification of proviral transcripts in ESC or pro-B-cell lines, both of which contain an ER-cre transgene. These cells were treated with either tamoxifen (∆/∆) or vehicle (C/C). Results are averaged from three independent experiments and data are represented as mean ± SEM (*P < 0.05, Student t test). (C) Surface staining of Setdb1C/C Abl pro-B cells (C/C, red) or 4 d after treatment with tamoxifen (∆/∆, blue) using an antibody specific for MLV envelope protein or an isotype control. (D) MSCV-hCD2–infected Abl pro-B cells were isolated by magnetic bead purification (hCD2+). After 10 d in culture, cells with silenced proviruses were isolated (hCD2–). Expression of hCD2 was quantified by flow cytometry 4 d after treatment with either tamoxifen (∆/∆, blue) or vehicle (C/C, red). Quantified data are presented as an average of three independent experiments (mean ± SEM). (E) ChIP assays for SETDB1 and H3K9me3 using chromatin from Abl pro-B cells with the indicated genotypes. Assays for LTR and coding sequences are shown for presilenced MSCV-hCD2 integrations. Data are presented as an average of two independent experiments (mean ± SEM; *P < 0.05, Student t test).
To independently confirm cell type-specific de-repression of ERVs, we examined cultures of ESC and transformed pro-B cells following deletion of Setdb1C/C alleles using a tamoxifen-inducible cre (ER-cre). The pro-B-cell lines were generated from Setdb1C/C:ER-Cre:Bcl2 bone marrow by transformation with a constitutively active v-Abl kinase (Abl pro-B cells). As shown in Fig. 3B, differential expression of ERV families is recapitulated in these cell culture models, as well as in primary pro-B cells sorted from Setdb1Δ/Δ mice or those grown in short-term IL-7 cultures (Fig. S3D). As an example of lineage-specific de-repression, we examined RNA-seq data for ERV up-regulation at selected gene loci. The expression of Emv2, an ecotropic MLV integrant on chromosome 8, and its neighboring genes (Tubb3 and Def8) are all potentiated significantly in Setdb1Δ/Δ pro-B cells (>4×), but not in SETDB1-deficient ESCs (Fig. S3E). In PGCs, expression of the ERV and neighboring genes is modestly enhanced following SETDB1 depletion (<2×). In contrast, an IAPE-z provirus, located 150 kb from Emv2, is activated in Setdb1Δ/Δ ESCs and PGCs but not in pro-B cells lacking this HMT.
In pro-B cells, endogenous MMTV or MLV, when inappropriately activated, can be packaged into viral particles. In certain mouse strains, viremia stemming from packaged MLV produces lymphoid malignancies due to viral insertions (7). Indeed, Abl pro-B cells express MLV envelope on their surface, but only after depletion of SETDB1 (Fig. 3C). The importance of SETDB1-mediated repression is also evident when Abl pro-B cells are infected with an expression vector for human CD2 (hCD2) driven by murine stem-cell virus (MSCV) LTRs (Fig. S3F), which are closely related to endogenous MLV elements (16). As expected, hCD2 expression is epigenetically silenced in a significant portion of the transduced Abl pro-B cells over a 10-d period (4). Following purification of cells harboring silenced hCD2 retroviruses (Fig. S3E), we deleted Setdb1 using the ER-cre driver. As shown in Fig. 3D, loss of Setdb1 reactivated these silenced viral integrations in ∼40% of cells over a 3-d period. In contrast, viral integrations remained repressed in Setdb1C/C cells, as monitored by hCD2 surface expression. Further, we observed SETDB1 binding and SETDB1-dependent H3K9 trimethylation at silenced MSCV LTRs, suggesting that the integrated retroviruses are repressed directly by this histone methyltransferase (Fig. 3E). We conclude that loss of Setdb1 impacts the suppression of endogenous and exogenous retroviruses, suggesting that the HMT is a general repressor of their expression in mammalian cells.
SETDB1 Loss Is Sufficient for Epigenetic Derepression but Not for Transcriptional Activation of ERVs.
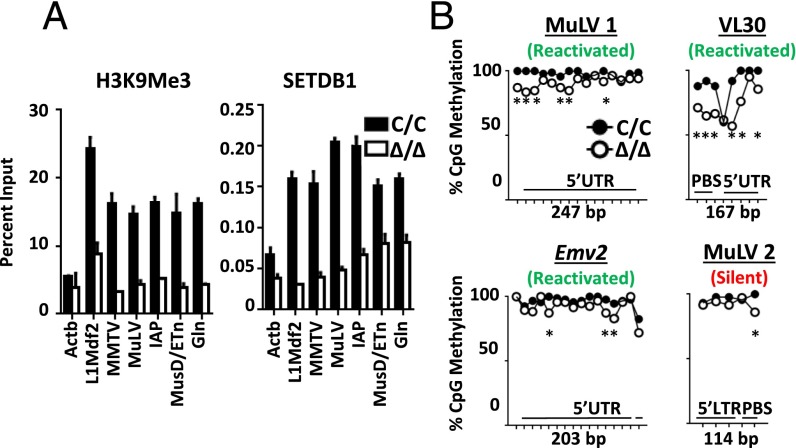
We envision two potential explanations for the observed cell type-specific profiles of ERV de-repression on loss of SETDB1, involving either epigenetic or transcription factor (TF) pathways. In this regard, we find that SETDB1 is deposited at all tested ERV families (Fig. 4A), suggesting a direct role for this HMT in epigenetic repression of these repetitive elements. However, several observations argue against a purely epigenetic basis for differential ERV activation in embryonic vs. B-lineage cells. Specifically, loss of both H3K9me3 and DNA methylation fails to fully activate MLVs in ESCs (8). Similarly, loss of SETDB1 leads to significant reductions in H3K9me3 at all tested ERV families in pro-B cells, regardless of their transcriptional activation status (Figs. 3A and 4A). The disconnect between epigenetic and transcriptional de-repression is also evident with at least some repetitive elements lacking LTRs. Epigenetic repression of a LINE family, called L1dmf2, is KAP1:SETDB1 dependent (Fig. 4A) (17), but these repetitive elements are not transcriptionally activated in SETDB1-deficient pro-B cells (Fig. 2A).
Fig. 4.
Epigenetic repression mediated by SETDB1. (A) ChIP assays for SETDB1 and H3K9me3 at LTRs for the indicated ERV families. Assays were performed in Abl pro-B cells 4 d after treatment with tamoxifen (Δ/Δ) or vehicle (C/C). Results are representative of three independent experiments, and data are shown as mean ± SD. (B) DNA methylation at the LTRs and 5′UTRs of individual proviruses that are transriptionally active (green) or remain silent (red) after Setdb1 deletion in pro-B cells. Analyzed proviruses are Emv2, a second reactivated MLV (MLV 1), a reactivated member of the VL30 family, and a transcriptionally silent MLV provirus (MLV 2). Bisulfite PCR followed by next-generation sequencing was performed on amplified products from Setdb1C/C:Bcl2 and Setdb1Δ/Δ:Bcl2 abl pro-B cells. Methylation frequencies at each CpG dinucleotide was determined for 250 randomly selected reads from each data set (*P < 0.05, Fisher’s exact test).
To more directly test the relationship between loss of SETDB1 binding and activation of ERV transcription, we designed ChIP-qPCR assays specific for individual proviruses rather than families. As shown in Fig. S4A, SETDB1 levels are significantly diminished at all tested ERV integrations in both pro-B cells and ESC following cre-mediated deletion of conditional alleles. Depletion of this HMT leads to a concomitant loss of H3K9me3 at each LTR when tested in the latter cell type. However, in both cell types, epigenetic de-repression following SETDB1 loss occurs on individual ERV integrants that become transcriptionally active or remain silent. Together, these data indicate that loss of H3K9me3 at regulatory regions within repetitive elements is insufficient for their transcriptional activation.
Fig. S4.
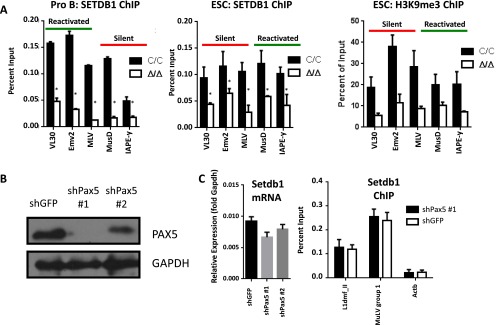
PAX5-dependent mechanisms of MuLV regulation. (A) ChIP assays for SETDB1 (Left) and H3K9me3 (Right) at LTRs for the indicated specific ERV proviruses. Assays were performed in Abl pro-B cells or ESC 4 d after treatment with tamoxifen (Δ/Δ) or vehicle (C/C). Results are representative of three independent experiments, and data are shown as mean ± SD (*P < 0.05, Student t test). (B) shRNA knockdown of Pax5 in Abl pro-B cells (Fig. 4D). Shown is a Western blot analysis using either PAX5- or GAPDH-specific antibodies. (C) SETDB1 mRNA expression (qRT-PCR) and protein binding (ChIP) following shPax5 knockdown. Results represent two independent experiments, and data are shown as mean ± SD.
A second type of epigenetic repression associated with ERV silencing, especially in differentiated cells, is DNA methylation. To test whether loss of SETDB1 differentially affects this repressive modification at transcriptionally active vs. silent ERVs, we performed bisulfite sequencing on Setdb1C/C and Δ/Δ cells. LTR regions from four ERV integrants were amplified by PCR, and the products were directly analyzed by high-throughput sequencing. The methylation status of CpG dinucleotides was assessed for 250 randomly selected reads that mapped to four specific proviral integrations: three expressed on SETDB1 deletion in pro-B cells (a VL30 provirus, Emv2, and a nonecotropic MLV), plus one silent MLV integration.
As shown in Fig. 4B, the three de-repressed ERVs exhibit partial loss of CpG methylation at some LTR sites, whereas the silent ERV retains WT levels of methylation at all but one CpG dinucleotide. Importantly, all ERVs are hypermethylated in Setdb1C/C pro-B cells, discounting the possibility that a subset of nonmethylated proviruses is up-regulated following SETDB1 depletion. Despite the modest loss in overall DNA methylation at de-repressed ERVs, all individual LTR sequences retain methylation at a large percentage of CpG dinucleotides following SETDB1 deletion (Fig. S5). In SETDB1-deficient ESCs, DNA methylation is significantly reduced at certain CpG dinucleotides in three LTRs, despite the fact that none of the tested ERVs is transcriptionally activated (Fig. 3A). We conclude that, although loss of SETDB1 can lead to decreased CpG methylation at some ERVs in both cell types, DNA methylation status does not consistently correlate with SETDB1 binding, levels of H3K9me3, or transcriptional status of a given ERV in our experimental systems.
Fig. S5.
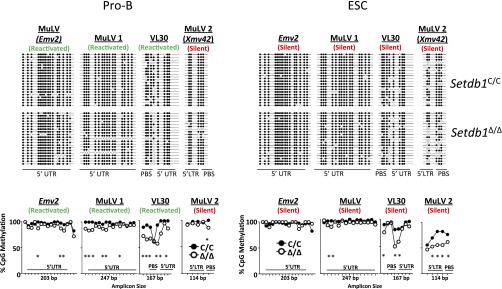
CpG methylation at ERVs. DNA methylation at the 5′LTRs and UTRs of individual proviruses transcriptionally reactivated (green) or silent (red) after Setdb1 deletion in pro-B cells. Genomic locations for each targeted provirus are found in the supplemental primer table. Bisulfite converted gDNA from Setdb1C/C and Setdb1Δ/Δ Abl pro-B cells, and ESC was amplified using oligos targeting individual proviruses, followed by next-generation sequencing. (Upper) Methylation status of individual CpG dinucleotides for 20 reads that were randomly selected by a computer algorithm from each dataset. Open circles indicate unmethylated CpGs and closed circles represent methylated sites. (Lower) Total percentage of methylation at each CpG dinucleotide (hash marks) as determined for 250 randomly selected reads for each sample (*P < 0.05, Fisher’s exact test).
ERV Activation Requires Lineage-Specific Transcription Factors.
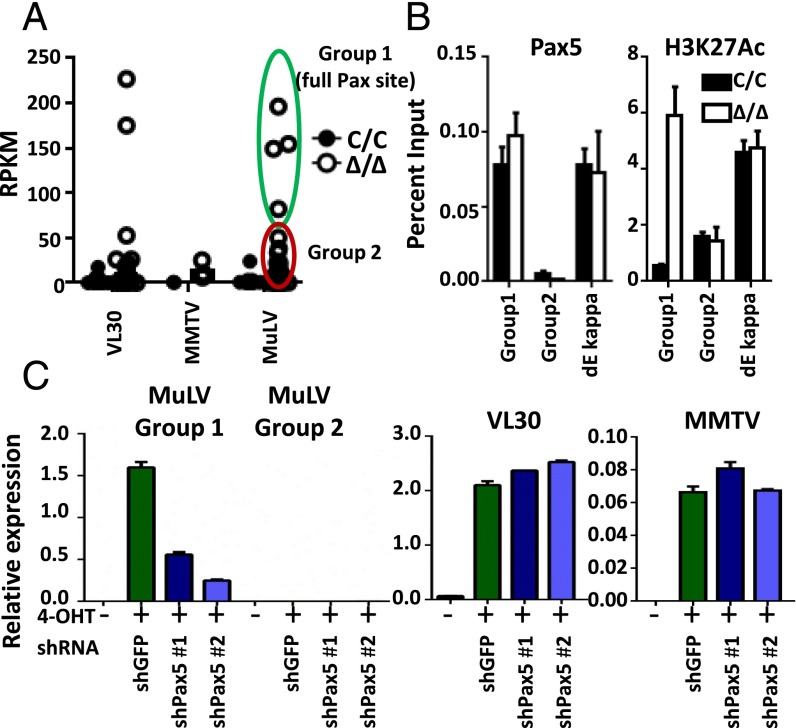
We next turned our attention to the potential role of TFs as determinants for tissue-specific de-repression of ERV transcription in Setdb1Δ/Δ cells. In this regard, we noticed that only a subset of uniquely identifiable MLVs are fully de-repressed on Setdb1 deletion in primary pro-B cells (group 1), whereas other identifiable ERVs in this family remain silent (group 2) (Fig. 5A). Indeed, the LTRs for group 1 vs. group 2 MLVs differ significantly at the DNA sequence level, with the expressed group 1 loci including the sole ecotropic MLV (Emv2) and the only infectious xenotropic MLV loci, termed Xmv43 (refer to Table S3 for MLV classification) (18). Motif analysis using the JASPAR database (19) predicted binding sites for several TFs that are critical for lymphopoiesis, including RUNX, ETS1, and PAX5 (Table S4). Importantly, an insertion in silent group 2 LTRs disrupts a predicted motif for PAX5, an essential B-lineage transcription factor (20). Regardless of SETDB1 status, PAX5 binds to group 1, but not to group 2, LTRs, as measured by ChIP-qPCR (Fig. 5B). These data suggest that, if PAX5 is the key activator of MLV expression, the presence of SETDB1 on the LTR must dominantly inhibit this process, presumably by preventing the accumulation of transcriptionally permissive chromatin. Additional ChIP-qPCR experiments support this notion, showing that the active chromatin modification H3K27Ac significantly increases at group 1 but not group 2 LTRs on SETDB1 deletion (Fig. 5B).
Fig. 5.
PAX5-dependent transcription of MLV in SETDB1-deficient pro-B cells. (A) Expression of individual VL30, MMTV, and MLV integrations in IL-7 cultured pro-B cells. Uniquely mapped reads from RNA-seq data were processed and presented as reads per million per kilobase (RPKM). (B) ChIP assay for PAX5 and H3K27Ac at LTRs for the indicated ERV families. Assays were performed in Abl pro-B cells 4 d after treatment with tamoxifen (Δ/Δ) or vehicle (C/C). An active PAX5-bound enhancer element (dE kappa) was assayed as a control. Results are representative of three independent experiments and data are shown as mean ± SD. (C) Proviral transcripts were quantified by RT-PCR in Abl pro-B cells expressing the indicated shRNAs, which were then treated with tamoxifen (4-OHT, ∆/∆) or vehicle (C/C). Values were normalized to Gapdh transcript levels. Results are representative of two independent experiments, and data are presented as mean ± SD.
Table S3.
Expression of MuLV, MMTV, and VL30 proviruses
| Chr | Start | Stop | Repbase name | Locus name | PBS | Fold up-regulation |
| MMTV | ||||||
| chr12 | 94122308 | 94129552 | MMTV-int | lys | 21.7 | |
| chr6 | 68193707 | 68200951 | MMTV-int | lys | 30.6 | |
| chr4 | 46589344 | 46596588 | MMTV-int | lys | 10.5 | |
| Expressed VL30 | ||||||
| chr11 | 86625743 | 86629378 | MMVL30-int | gly | 19.1 | |
| chr6 | 18793363 | 18796295 | MMVL30-int | gly | 17.1 | |
| MuLV | ||||||
| chr8 | 125952122 | 125957906 | MuLV-int | Emv2 (Ecotropic) | Pro Θ | 877 |
| chr1 | 170942048 | 170949650 | MuLV-int | Xmv43, Bxv1 (Clade C) | Pro Θ | 594 |
| chr11 | 88752193 | 88754431 | MuLV-int | Xmv42* | Gln2 | 18 |
| chr1 | 171481679 | 171484731 | MuLV-int | Xmv41 (Clade C) | Pro Θ | 573 |
| chr14 | 54530988 | 54533067 | RLTR4_MM-int | Xmv19 (Clade A) | Gln1 | 2.4 |
| chr19 | 60925881 | 60933459 | RLTR4_MM-int | Xmv18 (Clade A) | Gln1 | 20 |
| chr5 | 24215843 | 24217959 | RLTR4_MM-int | Xmv17 (Clade A) | Gln1 | 0.1 |
| chr9 | 41906061 | 41911691 | MuLV-int | Xmv16 (Clade B) | (Thr) | 8.6 |
| chr9 | 62439748 | 62447319 | RLTR4_MM-int | Xmv15 (Clade A) | Gln2 | 20.0 |
| chr13 | 67885437 | 67893025 | MuLV-int | Xmv13 (Clade B) | Gln2 | 4.2 |
| chr8 | 43312303 | 43319890 | RLTR4_MM-int | Xmv12 (Clade A) | Gln1 | 20 |
| chr2 | 156360884 | 156363103 | RLTR4_MM-int | Xmv10 (Clade B) | Gln1 | 0.1 |
| chr4 | 147219404 | 147226973 | RLTR4_MM-int | Xmv09 (Clade A) | Gln2 | 7.6 |
| chr4 | 146503672 | 146511250 | MuLV-int | Xmv08 (Clade B) | Gln1 | 8.3 |
| chr10 | 50422801 | 50426892 | RLTR4_MM-int | Pmv8 | Gln1 | 0.6 |
| chr2 | 57215109 | 57222695 | RLTR4_MM-int | Pmv7 | Gln1 | 0.6 |
| chr10 | 41437345 | 41444924 | RLTR4_MM-int | Pmv6 | Gln2 | 0.8 |
| chr5 | 44135057 | 44142644 | RLTR4_MM-int | Pmv5 | Gln2 | 0.6 |
| chr7 | 7070608 | 7078195 | RLTR4_MM-int | Pmv4 | Gln2 | 0.7 |
| chr1 | 182257817 | 182265403 | RLTR4_MM-int | Pmv24 | Gln2 | 0.9 |
| chr4 | 101863854 | 101871441 | RLTR4_MM-int | Pmv23 | Gln2 | 0.8 |
| chr11 | 8920995 | 8928580 | RLTR4_MM-int | Pmv22 | Gln1 | 0.8 |
| chr1 | 191934310 | 191941896 | RLTR4_MM-int | Pmv21 | Gln2 | 0.7 |
| chr18 | 82694248 | 82701733 | RLTR4_MM-int | Pmv20 | Gln2 | 1.2 |
| chr11 | 6750119 | 6757694 | RLTR4_MM-int | Pmv2 | Gln1 | 0.8 |
| chr4 | 108146732 | 108154273 | RLTR4_MM-int | Pmv19 | Gln1 | 0.7 |
| chr7 | 29615904 | 29621835 | RLTR4_MM-int | Pmv18 | Gln1 | 0.7 |
| chr15 | 76564012 | 76566305 | RLTR4_MM-int | Pmv17 | Gln1 | 0.3 |
| chr16 | 93698154 | 93705740 | RLTR4_MM-int | Pmv16 | Gln2 | 0.6 |
| chr7 | 30689337 | 30696923 | RLTR4_MM-int | Pmv15 | Gln1 | 0.6 |
| chr10 | 41437345 | 41444924 | RLTR4_MM-int | Pmv13 | Gln2 | 0.8 |
| chr5 | 144670536 | 144678122 | RLTR4_MM-int | Pmv12 | Gln1 | 0.6 |
| chr5 | 76931213 | 76938800 | RLTR4_MM-int | Pmv11 | Gln2 | 0.7 |
| chr8 | 119890262 | 119894347 | RLTR4_MM-int | Pmv10 | Gln1 | 0.6 |
| chrX | 15474745 | 15482331 | RLTR4_MM-int | Pmv1 | Gln2 | 0.7 |
| chr3 | 152323882 | 152331440 | RLTR4_MM-int | Mpmv9 | Gln1 | 1.4 |
| chr11 | 103084404 | 103091963 | RLTR4_MM-int | Mpmv8 | Gln1 | 1.4 |
| chr5 | 43208682 | 43216240 | RLTR4_MM-int | Mpmv7 | Gln2 | 1.1 |
| chr1 | 131643315 | 131650874 | RLTR4_MM-int | Mpmv6 | Gln1 | 1.1 |
| chr10 | 5718455 | 5726011 | RLTR4_MM-int | Mpmv5 | Gln2 | 1.1 |
| chr11 | 86883057 | 86890615 | RLTR4_MM-int | Mpmv4 | Gln2 | 1.2 |
| chr2 | 16021236 | 16028795 | RLTR4_MM-int | Mpmv3 | Gln2 | 1.2 |
| chr11 | 76549551 | 76557109 | RLTR4_MM-int | Mpmv2 | Gln1 | 1.3 |
| chr5 | 25231440 | 25238425 | RLTR4_MM-int | Mpmv13 | Gln2 | 1.1 |
| chr10 | 22735021 | 22742579 | RLTR4_MM-int | Mpmv12 | Gln2 | 1.2 |
| chr12 | 69547582 | 69555105 | RLTR4_MM-int | Mpmv11 | Gln1 | 1.2 |
| chr3 | 67096821 | 67099452 | RLTR4_MM-int | Mpmv10 | Thr | 1.3 |
| chr7 | 64127303 | 64134861 | RLTR4_MM-int | Mpmv1 | Thr | 1.2 |
RNA-seq data were used to determine RPKM values for LTR-containing endogenous retroviruses, as annotated in the Repeatmasker database for the C57B/6 genome. Total RPKM values were then normalized as fold up-regulation (Setdb1Δ/Δ/Setdb1C/C). To analyze full-length, properly annotated ERVs, only proviruses with a Smith–Watterman score of at least 15,000 were analyzed. For MuLV proviruses, repeatmasker annotations were compared with a precompiled list of ERV locus names, Xmv clades, and primer binding site (PBS) sequences from Jern et al. (18). Chromosome positions were converted to build GRCm38/mm9. Bold MuLV proviruses are up-regulated more than 25-fold. Mpmv, modified polytropic; Pmv, polytropic; Xmv, xenotropic.
Xmv42 is not assigned to a clade, because it is a product of recombination between two different MLVs. Θ contains ZFP809 recognition site (PBS-pro).
Table S4.
LTR sequences from reactivated and silent MLV proviruses
 |
Sequence comparison of the LTR region of group 1 and group 2 MuLV proviruses. Potential transcription factor binding sites were determined by JASPAR analysis (ETS,:blue; RUNX, purple; PAX, red). LTR regions outside of these highlighted sequences are nearly identical. ETS: ACAGGATAT, Jaspar ID:MA0098.2; RUNX: TGTGGT, Jaspar ID:MA0002.1; PAX5: TGGTCATGCA, Jaspar ID:MA0014.1.
To directly test whether PAX5 is required for de-repression of group 1 MLVs in Setdb1Δ/Δ Abl pro-B cells, we knocked down this TF using a shRNA strategy. As shown in Fig. 5C, PAX5 depletion using two independent shRNA vectors (Fig. S4B) reverses de-repression of the group 1 MLVs in mutant pro-B cells, whereas a control shRNA specific for GFP has no effect. SETDB1 occupancy on group 1 LTRs is unaffected by PAX5 depletion, precluding a role for this transcription factor in recruiting the HMT (Fig. S4C). In contrast to group 1 MLVs, de-repression of VL30s or MMTVs, which lack predicted PAX5 motifs in their LTRs, is unaffected by any of the shRNAs. Unlike distinctions between the MLV groups, LTRs for the two de-repressed VL30 integrants do not share obvious sequence features, nor are they readily distinguishable from family members that remain silent on SETDB1 deletion. We conclude that nearly all ERVs are de-repressed epigenetically in differentiated pro-B cells when SETDB1 is depleted. However, only specific sets of proviruses are activated transcriptionally, depending on whether the regulatory architecture of their LTRs is compatible with the expression profile of TFs in a given cell type.
Discussion
We show that loss of SETDB1 is incompatible with B-cell development and survival, phenotypes similar to those observed for ESCs or other cell types (4, 14). Rescue of this viability defect with ectopic BCL2 expression allowed us to probe SETDB1 function in a committed cell lineage from adult animals. We find that SETDB1 is required for epigenetic repression of ERVs (cell type independent), but that transcriptional de-repression occurs only when there is a functional match between LTRs and TF expression (cell type and LTR dependent). The latter aspect of this process likely explains why disruption of SETDB1 in embryo-derived cells leads to the expression of distinct ERV families compared with SETDB1-deficient pro-B cells (4, 21). In the latter cell type, PAX5 activates MLV integrants that harbor a functional binding site for this factor in their LTRs. We predict that the regulatory architecture of each LTR is a key determinant for whether it will become activated in a given cell type on SETDB1 disruption. This requirement may also explain why ERVs remain transcriptionally silent in SETDB1-deficient fibroblasts, despite their loss of H3K9me3, supporting the prevalent notion that ERV repression in differentiated cells is SETDB1 independent (4). Based on our findings, we predict that ERVs remain transcriptionally silent in some differentiated cells because they do not express the requisite complement of TFs for activation of LTR function.
SETDB1 is recruited to LTRs via its interaction with KAP1 and ZFPs, including ZFP809 (22). It remains likely that additional ZFPs target SETDB1 to a variety of sequences in LTRs, such as the exogenous MSCV vector used in this study. Indeed, many of the ERVs reactivated in Setdb1Δ /Δ pro-B cells lack the ZFP809 binding sequence (Table S3). Notwithstanding, once SETDB1 is recruited to LTRs, it functions as a critical epigenetic modifier for repression of ERV expression. In our study, we find that SETDB1-mediated repression is dominant over PAX5 when both are bound to LTRs, likely because HMT function can prevent the accumulation of transcriptionally permissive histone modifications at these MLV regulatory elements. The function of SETDB1 as an epigenetic repressor is further evidenced by its requirement for maintaining maximal levels of both H3K9me3 and DNA methylation at LTRs. Although we found that CpG methylation levels within LTRs are compromised only modestly in pro-B cells and ESC lacking SETDB1, we must emphasize that loss of the HMT potently blocks proliferation in both cell types. As such, it remains possible that complete ERV demethylation would occur if these cells continued to proliferate.
The epigenetic arm of SETDB1-mediated repression is also important for host defense, extinguishing the expression of exogenous retroviruses following infection, as further shown in this study. Indeed, certain retroviruses use epigenetic silencing to establish latency and escape the host immune response (23). Because LTRs in these latent viruses retain a competent regulatory architecture, any disruption to their continued epigenetic silencing would permit transcriptional reactivation and drive a new round of infection. An exciting possibility to explore in future studies is whether retroviruses can take advantage of transient disruptions to HMT-dependent repressive pathways, which may be caused by certain physiologic or pathophysiologic conditions that lead to viral reactivation.
Materials and Methods
Mice.
The Setdb1C/C (4), Mb1-cre (10), Bcl2-transgenic (24), Igh-transgenic (25), P53−/−, and ER-cre (26) mouse strains have been described previously. Setdb1C/C mice were made from CBA/B6 hybrids and then backcrossed onto a C57B/6 background. To generate Setdb1∆/∆ B cells in vivo, one Mb1-cre allele was bred into the Setdb1C/C strain. To control for strain-specific insertional polymorphisms among ERVs, littermate controls were used for all experiments. All animal studies were reviewed and approved by the Washington University Animal Review Board.
Cell Lines and Culturing.
For Abl pro-B cells, the Setdb1C/C, Bcl2-transgenic, and ER-cre strains were bred to generate mice with a Setdb1C/C:Bcl2:ER-cre genotype. Bone marrow from these animals was infected with a v-Abl–containing MSCV retrovirus, which specifically transforms pro-B cells (27). ESCs with the Setdb1C/C:ER-cre genotype have been described previously (4). To inactivate Setdb1 in the ER-cre cell lines, tamoxifen (4-OhT, 1 µM) was added for 24 h and washed out, and the cells were placed in fresh media for an additional 4 d. Control cells were treated with vehicle (EtOH). For primary cell cultures, B-lineage cells were isolated using MACS microbeads (α-CD19) from bone marrow of Setdb1C/C:Bcl2 or Setdb1∆/∆:Bcl2 animals (Miltenyi Biotech; 130-052-201) and cultured in 5 ng/µL of IL-7 (Invitrogen; PMC0075) for 4 d.
Molecular Analyses.
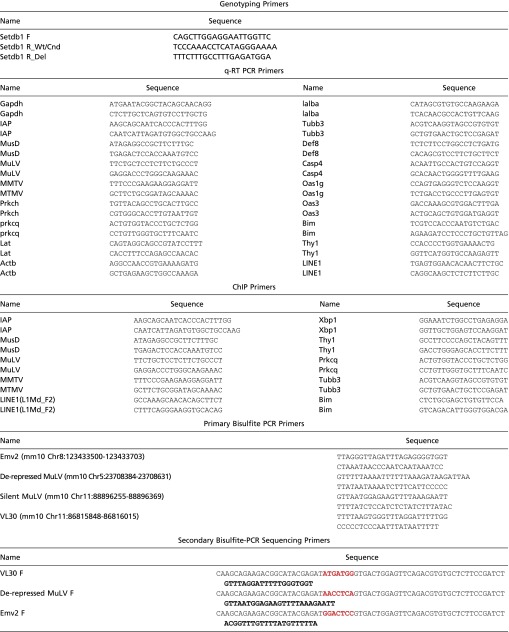
Immunoblotting of SETDB1 and histone modifications were performed as previously described (28). The following antibodies were used: SETDB1 (Cell applications 10377), H3K9me3 (abcam 8998), Pax5 (eBiosciences 14-9918-80), and Histone 3 (abcam 1791). Semiquantative PCR for Igh rearrangements was described previously (28). For qRT-PCR analysis, RNA was purified using Trireagent (Ambion 15596026), treated with DNase (Promega M6101), and processed for cDNA (NEB M0253L). PCR primers are provided in Table S5. ChIP assays were done as described previously (28) using antibodies specific for H3K9me3 (abcam 8998) or SETDB1 (ProteinTech 11-231-AP).
Table S5.
Primers used in present study
|
For microarray experiments, RNA was purified (QIAGEN RNeasy), amplified (Nugen Ovation Pico SL), and labeled (Nugen Encore Biotin) from two independent samples corresponding to the following genotypes: Setdb1C/C or Setdb1Δ/Δ pro-B cells (IgM–CD19+CD43+); Bcl2-tg:Setdb1C/C and Bcl2-tg:Setdb1Δ/Δ pro-B cells cultured in IL-7 for 4 d. Labeled cDNA from each was hybridized to Affymatrix Mouse Gene 1.0 Arrays. For analysis of coding genes, probes were quantified using Affymetrix Expression Console software (v1.2.0.20) and Partek Genomic Suite software, version 3.0 (Partek) using default settings and probe-level RMA analysis. For repetitive elements, analyses were done as described previously (29).
RNA-seq was performed on pro-B cells cultured in IL-7 for 4 d before RNA isolation (QIAGEN RNeasy). Purified RNA was depleted of rRNA (Ribo-Zero; Epicentre) and labeled with indexing adaptors (TruSeq RNA Kits; Illumina). Libraries corresponding to two pooled samples were sequenced using an Illumina HiSeq2000 instrument (101-bp paired-end). Unique reads were aligned to the reference build (GTCm38/mm10) using TopHat and Bowtie2 (30). RPKM values were obtained using RSeQC (31). Total number of reads per ERV family was determined as described (32). Briefly, reads were mapped to conical internal regions (-int annotations) of ERV sequences in the Repeatmasker database or from a custom alignment of Repbase LTRs to the C57B/6 genome using Cross Match (33). To analyze full-length, properly annotated ERVs, only proviruses with a Smith–Watterman score of at least 15,000 (Repeatmasker) or 10,000 (Cross Match) were used. Total read numbers per ERV were then normalized to input read numbers, as well as ERV copy numbers from each analysis.
Bisulfite-seq.
For bisulfite-PCR experiments, genomic DNA from Setdb1c/c and Setdb1Δ/Δ ESC or pro-B-cell lines was converted using an EpiTect Bisulfite kit (Qiagen). Converted DNA was amplified using nested PCR oligos designed to recognize the LTR regions of four distinct ERV integrants (Table S5), with the second primer containing an index and adaptor for sequencing on an Illumina Miseq sequencer (125-bp paired-end). Bisulfite-converted reads were mapped using NovoAlign alignment suite (Novocraft). Methylation status of 250 mapped reads (>98% sequence match) selected by a custom randomization algorithm was determined using QUMA (34).
Cellular Analyses.
Antibodies for cell surface markers were purchased from eBiosciences with the following exception: 83-A25 (αMLV-env) was kindly provided from Leonard Evans (Rocky Mountain Laboratories, Hamilton, MT). For isotype controls, an antibody recognizing the macrophage-specific protein MAC1 was used (eBiosciences 11-0112-81). For carboxyfluorescein succinimidyl ester (CFSE) loading experiments, CD19+ B-lineage cells were isolated from bone marrow using MACs microbeads (130-052-201), pulsed with 10 µM CSFE per the manufacturer’s instructions (CellTrace CFSE; Life Technologies), and grown in 5 ng/mL IL-7 for 4 d. DNA content analysis was performed on these cultured cells as described previously (35).
shRNA-Mediated Knockdowns.
Cloning of hairpin-MSCV-shRNA vectors containing shRNA sequences, production of retroviruses, and infection of pro-B cells has been described previously (35). The shPax5 targeting sequences were as follows: shPax5 1, 5′-CCAGCACTACTCTGACATCTTA-3′; shPax5, 2, 5′-ATACAATGATTCTTGGAGGTTA-3′. Infected hCD2+ Abl pro-B cells were purified using magnetic selection (Miltenyi Biotec 130-091-114) and processed for transcript or Western blotting analysis.
Supplementary Material
Acknowledgments
We thank Drs. Barry Sleckman, Jeff Bernardsky, and Deepta Bhattacharya for antibodies and cytokines, and the Genome Technology Access Center in the Department of Genetics at Washington University School of Medicine for help with genomic analyses. The Genome Technology Access Center is partially supported by National Cancer Institute Cancer Center Support Grant P30 CA91842 (to the Siteman Cancer Center) and by Institute of Clinical and Translational Sciences (ICTS/CTSA) Grant UL1TR000448 from the National Center for Research Resources. This work was supported by National Institutes of Health (NIH) Grants AI 079732, AI 118852 (to E.M.O.), and AI 097244 (to T.E.); Ministry of Education, Culture, Sports, Science and Technology of Japan Grant 20062005 (to Y.S.); and NIH Training Grant T32 AI 7163-34.
Footnotes
The authors declare no conflict of interest.
This article is a PNAS Direct Submission. J.V.M. is a guest editor invited by the Editorial Board.
Data deposition: The data reported in this paper have been deposited in the Gene Expression Omnibus (GEO) database, www.ncbi.nlm.nih.gov/geo (accession no. GSE69504).
This article contains supporting information online at www.pnas.org/lookup/suppl/doi:10.1073/pnas.1422187112/-/DCSupplemental.
References
- 1.Grewal SIS, Jia S. Heterochromatin revisited. Nat Rev Genet. 2007;8(1):35–46. doi: 10.1038/nrg2008. [DOI] [PubMed] [Google Scholar]
- 2.Peters AHFM, et al. Loss of the Suv39h histone methyltransferases impairs mammalian heterochromatin and genome stability. Cell. 2001;107(3):323–337. doi: 10.1016/s0092-8674(01)00542-6. [DOI] [PubMed] [Google Scholar]
- 3.Bulut-Karslioglu A, et al. Suv39h-dependent H3K9me3 marks intact retrotransposons and silences LINE elements in mouse embryonic stem cells. Mol Cell. 2014;55(2):277–290. doi: 10.1016/j.molcel.2014.05.029. [DOI] [PubMed] [Google Scholar]
- 4.Matsui T, et al. Proviral silencing in embryonic stem cells requires the histone methyltransferase ESET. Nature. 2010;464(7290):927–931. doi: 10.1038/nature08858. [DOI] [PubMed] [Google Scholar]
- 5.Waterston RH, et al. Mouse Genome Sequencing Consortium Initial sequencing and comparative analysis of the mouse genome. Nature. 2002;420(6915):520–562. doi: 10.1038/nature01262. [DOI] [PubMed] [Google Scholar]
- 6.Huang CRL, Burns KH, Boeke JD. Active transposition in genomes. Annu Rev Genet. 2012;46:651–675. doi: 10.1146/annurev-genet-110711-155616. [DOI] [PMC free article] [PubMed] [Google Scholar]
- 7.Coffin JM, Hughes SH, Varmus HE. 1997. Retrotransposons, endogenous retroviruses and the evolution of retroviruses. Retroviruses, eds Coffin JM, Hughes SH, Varmus HE (Cold Spring Harbor Laboratory Press, Cold Spring Harbor, NY), pp 343–435. [PubMed]
- 8.Karimi MM, et al. DNA methylation and SETDB1/H3K9me3 regulate predominantly distinct sets of genes, retroelements, and chimeric transcripts in mESCs. Cell Stem Cell. 2011;8(6):676–687. doi: 10.1016/j.stem.2011.04.004. [DOI] [PMC free article] [PubMed] [Google Scholar]
- 9.Rowe HM, et al. KAP1 controls endogenous retroviruses in embryonic stem cells. Nature. 2010;463(7278):237–240. doi: 10.1038/nature08674. [DOI] [PubMed] [Google Scholar]
- 10.Hobeika E, et al. Testing gene function early in the B cell lineage in mb1-cre mice. Proc Natl Acad Sci USA. 2006;103(37):13789–13794. doi: 10.1073/pnas.0605944103. [DOI] [PMC free article] [PubMed] [Google Scholar]
- 11.Santoni de Sio FR, et al. KAP1 regulates gene networks controlling mouse B-lymphoid cell differentiation and function. Blood. 2012;119(20):4675–4685. doi: 10.1182/blood-2011-12-401117. [DOI] [PMC free article] [PubMed] [Google Scholar]
- 12.Osipovich O, Oltz EM. Regulation of antigen receptor gene assembly by genetic-epigenetic crosstalk. Semin Immunol. 2010;22(6):313–322. doi: 10.1016/j.smim.2010.07.001. [DOI] [PMC free article] [PubMed] [Google Scholar]
- 13.Sarraf SA, Stancheva I. Methyl-CpG binding protein MBD1 couples histone H3 methylation at lysine 9 by SETDB1 to DNA replication and chromatin assembly. Mol Cell. 2004;15(4):595–605. doi: 10.1016/j.molcel.2004.06.043. [DOI] [PubMed] [Google Scholar]
- 14.An J, et al. The histone methyltransferase ESET is required for the survival of spermatogonial stem/progenitor cells in mice. Cell Death Dis. 2014;5:e1196. doi: 10.1038/cddis.2014.171. [DOI] [PMC free article] [PubMed] [Google Scholar]
- 15.Liu S, et al. Setdb1 is required for germline development and silencing of H3K9me3-marked endogenous retroviruses in primordial germ cells. Genes Dev. 2014;28(18):2041–2055. doi: 10.1101/gad.244848.114. [DOI] [PMC free article] [PubMed] [Google Scholar]
- 16.Hawley RG, Lieu FH, Fong AZ, Hawley TS. Versatile retroviral vectors for potential use in gene therapy. Gene Ther. 1994;1(2):136–138. [PubMed] [Google Scholar]
- 17.Castro-Diaz N, et al. Evolutionally dynamic L1 regulation in embryonic stem cells. Genes Dev. 2014;28(13):1397–1409. doi: 10.1101/gad.241661.114. [DOI] [PMC free article] [PubMed] [Google Scholar]
- 18.Jern P, Stoye JP, Coffin JM. Role of APOBEC3 in genetic diversity among endogenous murine leukemia viruses. PLoS Genet. 2007;3(10):2014–2022. doi: 10.1371/journal.pgen.0030183. [DOI] [PMC free article] [PubMed] [Google Scholar]
- 19.Matys V, et al. TRANSFAC: Transcriptional regulation, from patterns to profiles. Nucleic Acids Res. 2003;31(1):374–378. doi: 10.1093/nar/gkg108. [DOI] [PMC free article] [PubMed] [Google Scholar]
- 20.Mikkola I, Heavey B, Horcher M, Busslinger M. Reversion of B cell commitment upon loss of Pax5 expression. Science. 2002;297(5578):110–113. doi: 10.1126/science.1067518. [DOI] [PubMed] [Google Scholar]
- 21.Tan S-L, et al. Essential roles of the histone methyltransferase ESET in the epigenetic control of neural progenitor cells during development. Development. 2012;139(20):3806–3816. doi: 10.1242/dev.082198. [DOI] [PubMed] [Google Scholar]
- 22.Wolf D, Goff SP. Embryonic stem cells use ZFP809 to silence retroviral DNAs. Nature. 2009;458(7242):1201–1204. doi: 10.1038/nature07844. [DOI] [PMC free article] [PubMed] [Google Scholar]
- 23.Williams SA, et al. NF-kappaB p50 promotes HIV latency through HDAC recruitment and repression of transcriptional initiation. EMBO J. 2006;25(1):139–149. doi: 10.1038/sj.emboj.7600900. [DOI] [PMC free article] [PubMed] [Google Scholar]
- 24.Strasser A, et al. Enforced BCL2 expression in B-lymphoid cells prolongs antibody responses and elicits autoimmune disease. Proc Natl Acad Sci USA. 1991;88(19):8661–8665. doi: 10.1073/pnas.88.19.8661. [DOI] [PMC free article] [PubMed] [Google Scholar]
- 25.Mandik-Nayak L, Racz J, Sleckman BP, Allen PM. Autoreactive marginal zone B cells are spontaneously activated but lymph node B cells require T cell help. J Exp Med. 2006;203(8):1985–1998. doi: 10.1084/jem.20060701. [DOI] [PMC free article] [PubMed] [Google Scholar]
- 26.Feil R, et al. Ligand-activated site-specific recombination in mice. Proc Natl Acad Sci USA. 1996;93(20):10887–10890. doi: 10.1073/pnas.93.20.10887. [DOI] [PMC free article] [PubMed] [Google Scholar]
- 27.Rosenberg N, Baltimore D, Scher CD. In vitro transformation of lymphoid cells by Abelson murine leukemia virus. Proc Natl Acad Sci USA. 1975;72(5):1932–1936. doi: 10.1073/pnas.72.5.1932. [DOI] [PMC free article] [PubMed] [Google Scholar]
- 28.Thomas LR, et al. Functional analysis of histone methyltransferase g9a in B and T lymphocytes. J Immunol. 2008;181(1):485–493. doi: 10.4049/jimmunol.181.1.485. [DOI] [PMC free article] [PubMed] [Google Scholar]
- 29.Reichmann J, et al. Microarray analysis of LTR retrotransposon silencing identifies Hdac1 as a regulator of retrotransposon expression in mouse embryonic stem cells. PLOS Comput Biol. 2012;8(4):e1002486. doi: 10.1371/journal.pcbi.1002486. [DOI] [PMC free article] [PubMed] [Google Scholar]
- 30.Trapnell C, Pachter L, Salzberg SL. TopHat: Discovering splice junctions with RNA-Seq. Bioinformatics. 2009;25(9):1105–1111. doi: 10.1093/bioinformatics/btp120. [DOI] [PMC free article] [PubMed] [Google Scholar]
- 31.Wang L, Wang S, Li W. RSeQC: Quality control of RNA-seq experiments. Bioinformatics. 2012;28(16):2184–2185. doi: 10.1093/bioinformatics/bts356. [DOI] [PubMed] [Google Scholar]
- 32.Day DS, Luquette LJ, Park PJ, Kharchenko PV. Estimating enrichment of repetitive elements from high-throughput sequence data. Genome Biol. 2010;11(6):R69. doi: 10.1186/gb-2010-11-6-r69. [DOI] [PMC free article] [PubMed] [Google Scholar]
- 33.Ewing B, Green P. Base-calling of automated sequencer traces using phred. II. Error probabilities. Genome Res. 1998;8(3):186–194. [PubMed] [Google Scholar]
- 34.Kumaki Y, Oda M, Okano M. QUMA: Quantification tool for methylation analysis. Nucleic Acids Res. 2008;36(Web Server issue):W170-5. doi: 10.1093/nar/gkn294. [DOI] [PMC free article] [PubMed] [Google Scholar]
- 35.Bednarski JJ, et al. RAG-induced DNA double-strand breaks signal through Pim2 to promote pre-B cell survival and limit proliferation. J Exp Med. 2012;209(1):11–17. doi: 10.1084/jem.20112078. [DOI] [PMC free article] [PubMed] [Google Scholar]
Associated Data
This section collects any data citations, data availability statements, or supplementary materials included in this article.


