Significance
Magnetic fields exist throughout the universe. Their energy density is comparable to the energy density of the fluid motions of the plasma in which they are embedded, making magnetic fields essential players in the dynamics of the luminous matter in the universe. The origin and the amplification of these magnetic fields to their observed strengths are far from being understood. The standard model for the origin of these galactic and intergalactic magnetic fields is through the amplification of seed fields via turbulent processes to the level consistent with current observations. For this process to be effective, the amplification needs to reach a strongly nonlinear phase. Experimental evidence of the initial nonlinear amplification of magnetic fields is presented in this paper.
Keywords: galaxy clusters, laboratory analogues, lasers, magnetic fields, turbulence
Abstract
The visible matter in the universe is turbulent and magnetized. Turbulence in galaxy clusters is produced by mergers and by jets of the central galaxies and believed responsible for the amplification of magnetic fields. We report on experiments looking at the collision of two laser-produced plasma clouds, mimicking, in the laboratory, a cluster merger event. By measuring the spectrum of the density fluctuations, we infer developed, Kolmogorov-like turbulence. From spectral line broadening, we estimate a level of turbulence consistent with turbulent heating balancing radiative cooling, as it likely does in galaxy clusters. We show that the magnetic field is amplified by turbulent motions, reaching a nonlinear regime that is a precursor to turbulent dynamo. Thus, our experiment provides a promising platform for understanding the structure of turbulence and the amplification of magnetic fields in the universe.
In the early universe, matter was nearly homogenously distributed; today, as a result of gravitational instabilities, it forms a web-like structure consisting of filaments and galaxy clusters (1). The continued mergers of galaxies, filaments, and galaxy clusters inject turbulence into the intergalactic medium via shocks (2, 3). At the same time, the existence of diffuse synchrotron emission at radio wavelengths and Faraday rotation measurements indicate the presence of magnetic fields in galaxy clusters with strengths up to tens of microgausses (4, 5). The standard model for the origin of these intergalactic magnetic fields is amplification of seed fields via the turbulent dynamo mechanism to the present-day observed values (6–10), but other possibilities involving plasma kinetic instabilities (11–14), return currents (15, 16), or primordial mechanisms (17, 18) have also been invoked.
We have carried out experiments involving the collision of two plasma jets—reminiscent of cluster merger events—to produce a laboratory-scale replica of a turbulent intracluster plasma, although obviously our plasma is not confined in a dark matter potential well, as it is in clusters. In the intracluster medium, large-scale turbulent motions are influenced by density stratification and gravity. However, at smaller spatial scales, the time periods for buoyancy-driven motions are much longer than those of the turbulent motions, so the fluctuations at these scales are universal, and thus similar to the turbulence we can create in our laboratory experiments. The scale invariance of hydrodynamic equations (19, 20) implies, if we assume that a distance of 1 cm in the laboratory corresponds to 100 kiloparsecs in the astrophysical case, that 1 µs becomes 0.5 Gy and a density of cm−3 is equivalent to 0.01 cm−3 in the galaxy cluster.
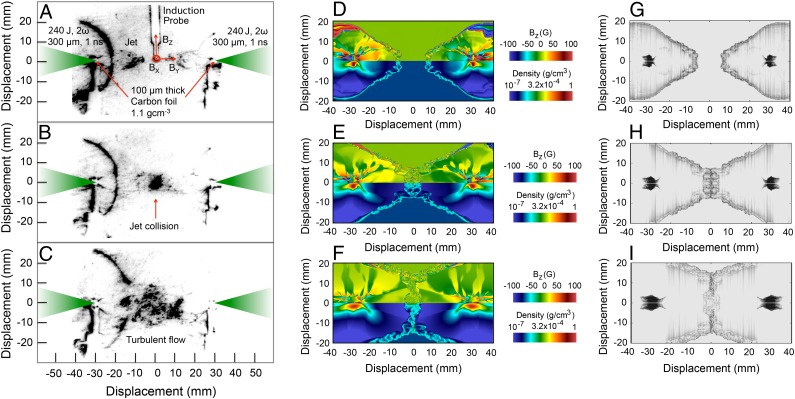
Our experiments were conducted using the Vulcan laser of the Central Laser Facility at the Rutherford Appleton Laboratory. We have focused multiple laser beams (with 240 J total energy and 1-ns pulse duration) onto a carbon foil to launch a plasma jet into an ambient argon gas-filled chamber (at a pressure of 1 mbar). A full description of the experimental setup is given in Fig. 1. Ablation of target material by the laser drives a shock into the carbon foil, which then produces a collimated jet from the back surface of the target (i.e., the side opposite to that illuminated by the laser). The target material ablated by the laser is slowed by the ambient medium, creating a wrap-around shock, visible in Fig. 1. Schlieren measurements were taken to characterize the outflows at various times. The fastest moving material occurs on axis (see Fig. 2) with km/s (, where is the sound speed) at 3 cm from the target, while material on the edges of the jet moves more slowly as a result of Kelvin–Helmholtz shearing instabilities. Experiments were also performed using two sets of laser beams, each set illuminating a carbon foil, producing two jets that collide. The collision drives strong turbulence in a region that grows from a size cm at µs to cm at µs, at which time the turbulence reaches a more relaxed state.
Fig. 1.
Colliding jet configuration for the generation of turbulence. Two carbon foils (100 μm thick, with density 1.13 g/cm3) are separated by 60 mm in a mbar argon gas-filled chamber. Each target is ablated by three frequency-doubled (527-nm-wavelength) laser beams with a laser spot diameter of 300 μm. The total laser illumination onto each foil is J in a 1-ns pulse length. An induction coil ( 200-MHz bandwidth, with four twisted pair coils wound around the axis of a mm2 plastic core) is placed at equal distance between the foil targets. Additional details are given in ref. 10. (A) Schlieren image (using a 532-nm-wavelength probe and 5-ns CCD gate width) of the jet formations at ns after the laser shot. (B) The jets collide at ns, and (C) turbulence develops by ns. (D) Magnetic field (Top) and mass density (Bottom) from a FLASH simulation of the two jets at ns. (E) Same as D but at ns. (F) same as D but at ns. (g) Schlieren synthetic image obtained by postprocessing the FLASH results at ns using Spect3D (34). (H) Same as G but at ns. (I) same as G but at ns. The measured and simulated Schlieren images are similar at ns and 800 ns, but differ at ns. The difference is likely due to a slight angle between the directions the two jets are moving, which allows part of the jets to continue beyond the initial interaction region. This produces a much larger turbulent region in the experiment than in the simulation, where the 2D cylindrical geometry prevents us from accommodating this situation. Since the FLASH simulations are 2D cylindrical, the plane that most closely corresponds to the experimental data is the one that is perpendicular to the page and connects the two target foils. This plane does not contain the induction coil probe.
Fig. 2.
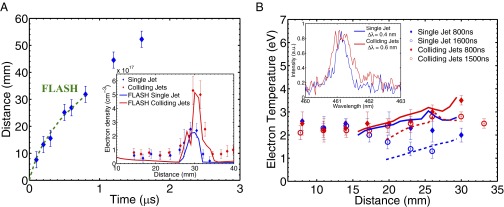
Characterization of jet propagation and collision. (A) Measurement of the jet leading edge vs. time from Schlieren data (blue symbols) and FLASH simulations (dashed green line). The FLASH simulation was calibrated to match the position of the leading edge of the jet at 800 ns for the measured value of the total laser energy for that data point. (Inset) The electron density profile obtained by interferometry at ns compared with FLASH predictions. The density has been averaged over a volume of 5 mm radius from the axis connecting the two target foils. (B) Spatially resolved electron temperature profile of a single jet (blue symbols) and colliding jets (red symbols) at ns obtained from the measured argon spectral lines (see Supporting Information for details). Solid lines (blue, single jet; red, colliding jets) correspond to the predicted temperature values from FLASH simulations at ns, averaged over the same volume as the electron density. Dashed lines are the results from the same FLASH simulations at ns. (Inset) An example of the argon spectral line at ns and 3 cm from the carbon foil target (averaged over 0.1 cm).
The turbulent velocity fluctuations on the system scale L can be estimated from Fig. 2B. At the collision point, the observed argon emission lines are broadened by 0.2 nm. Half of this broadening is attributed to the increased density, and to a lesser extent to the higher temperatures (thermal broadening is small due to the large ion mass) (Supporting Information). The broadening due to turbulent motions is then 0.1 nm, corresponding to a turbulent velocity km/s. Thus, , suggesting that the collision effectively randomizes the directed velocities of the two jets. Taking the measured values of jet velocity, density, and temperature in the collision region, and assuming an ionization state for argon, we estimate the interjet electron–ion ( cm) and ion–ion ( cm) mean free paths to be significantly smaller than the size of the jets. This confirms that the two jets strongly interact via Coulomb collisions and the contact surface between the two jets becomes quickly unstable. The Reynolds number calculated with respect to the scale L is thus ( cm2/s is the kinematic viscosity of the plasma).
For our plasma conditions, the radiative cooling rate per ion is eV/ns, where is the argon mass, cm2/g is the Planck opacity (see Supporting Information), and is the Stefan–Boltzmann constant. This implies that during one jet crossing time, ns, the plasma should have cooled to near 1 eV, as in the case of a single-jet expansion (detailed calculations are provided in Supporting Information). Fig. 2 instead shows that in the collision region the temperature remains 2 eV over a few , suggesting that much of the cooling must be offset by heating. Turbulent motions are eventually dissipated into heat. This heating rate per ion can be approximated to be eV/ns. Thus, , consistent with turbulence playing an important role in achieving a stable temperature profile, with near balance between turbulent heating and radiative cooling.
We performed simulations of the experiments using the FLASH code (21, 22) (see Supporting Information). The results of the FLASH simulations are consistent with the measured properties of the jet, including its morphology and the physical conditions in the interaction region (Figs. 1 and 2). The simulations indicate enhanced vorticity as the two jets collide, and reproduce the increase in the electron density and the moderate rise in the temperature after the collision.
In some respects, our experimental conditions are qualitatively similar to those found in galaxy clusters, where heating driven by turbulent motions in the intracluster plasma reduces radiative losses and decreases the net cooling rate (23). On the other hand, while, in the inertial range, energy is transferred from one scale to another at a rate given by , which has the same form in both clusters and laboratory experiments, the actual mechanism for energy dissipation into heat can be different. This is dominated by collisional, isotropic viscosity in the laboratory, whereas in clusters, at a minimum, one must take into account that viscosity is anisotropic due to magnetic fields, and, furthermore, kinetic processes may play an important role (8). Thus, the similarity between the laboratory “replica” and the astrophysical reality can only hold at scales larger than the viscous one.
During hierarchical structure formation, clusters form from accretion of filaments, galaxies, galaxy groups, and cluster mergers. In clusters of galaxies, turbulent velocities can be inferred from the density perturbations, which, in turn, are obtained using the measured X-ray radiation intensities (23–25). The turbulence in clusters is mainly subsonic at small scales (and near sonic at large scales), so density fluctuations (injected at large scales) behave like a passive scalar. Therefore, the density and velocity spectra are expected to be the same (26). The fact that turbulence is moderately supersonic in our experiment, while subsonic in clusters, is likely to lead to only a modest change in the power spectra (and at small enough scales, motions will, in any event, become subsonic). Indeed, spectroscopic observations of supersonic motions in molecular clouds (27) suggest a velocity power spectrum close to the classical Kolmogorov law (where k is the wavenumber) that holds for incompressible fluids. Numerical simulations of supersonic turbulence show a spectrum somewhat steeper than Kolmogorov’s, to , depending on the details of the driving mechanism (28). These differences are smaller that the uncertainties in our power spectrum measurements.
We have extracted the power spectrum of the electron density fluctuations from our data. The result is shown in Fig. 3A, using the wavelet method discussed in ref. 25, which was used there for the analysis of X-ray maps of the Coma cluster. The spectrum is consistent with a Kolmogorov-like power law, as expected from the theoretical work we discuss above, suggesting that we do indeed see fully developed turbulence. A similar spectrum was obtained in galaxy clusters (24, 25).
Fig. 3.
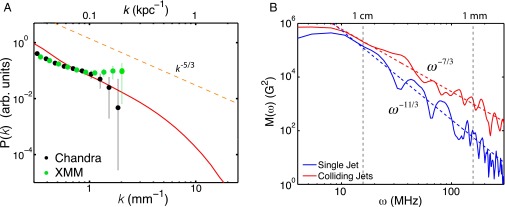
Power spectra of turbulence. (A) Plot of the density fluctuation power spectrum , where is the discrete Fourier transform of the space-dependent electron density and is its average value. In Schlieren imaging, the measured signal intensity is proportional to , where n is the electron density, x,y are the image plane spatial coordinates, and z is the depth (35). Therefore, under the assumption that turbulence is statistically homogeneous across the jet interaction region, the discrete Fourier transform of the central region of the jet collision in Fig. 1C directly gives . The power spectrum is arbitrarily normalized so that at the largest scale. The solid red curve corresponds to the experimental data, while the black and green symbols correspond to the inferred density spectrum in the Coma cluster obtained from CHANDRA and XMM satellite observations, respectively (25). (B) Plot of the magnetic energy spectrum , where is the discrete Fourier transform of the total magnetic field for the cases both with a single jet (blue solid line) and with colliding jets (red solid line). The slope of the spectrum in the case of colliding jets is shallower than in the case of a single jet (where it is consistent with the Golitsyn spectrum, assuming conversion from frequencies to wavenumbers according to Taylor hypothesis, ). This gradual shallowing of the spectrum with increasing Rm is a signature of the dynamo precursor regime (31). The measured frequency spectrum, , can be argued to correspond to wavenumber spectrum, , in the case of colliding jets, where Taylor's hypothesis is inapplicable (see Supporting Information).
While and turbulent motions are excited over a large range of scales, the magnetic Reynolds number is ( cm2/s is the resistivity), so the resistive scale lies well above the viscous scale, and close to the system scale, L. Since Rm is not very large in the experiment, the full magnetohydrodynamic (MHD) scaling between the cluster and the laboratory is only marginally valid (20). At such Rm, turbulent dynamo, believed to be the mechanism whereby strong fields are generated in galaxy clusters (7, 8), does not operate, but the magnetic fields can be amplified via stochastic tangling of an imposed field by turbulent motions (29, 30). At small Rm ( 1), the amplified field grows proportionally to Rm and has the Golitsyn (29) power law, which arises in Kolmogorov turbulence when the stochastic tangling of the magnetic field is balanced by Ohmic diffusion. As Rm gets larger, the scaling of the amplified field gets closer to , and its spectrum becomes shallower (31). Eventually, there is a transition to the turbulent dynamo regime, expected at Rm .
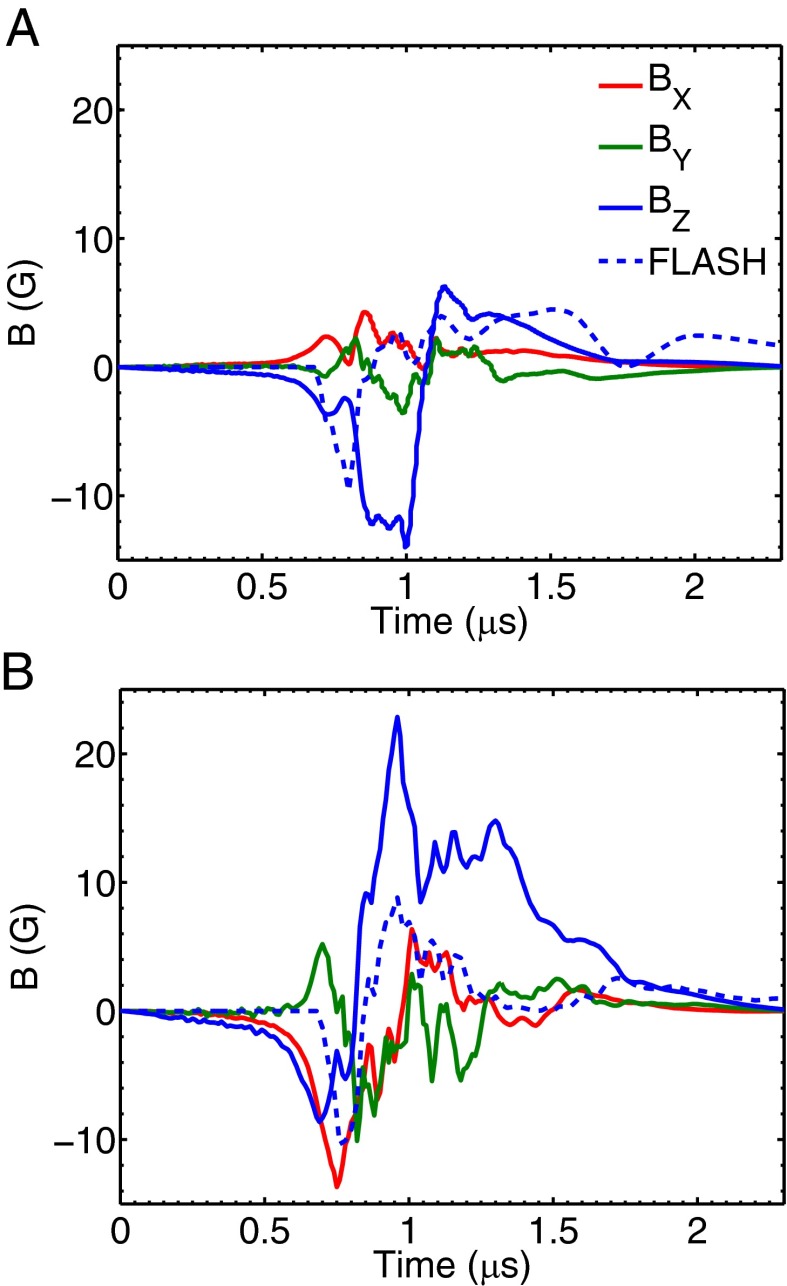
In our experiment, magnetic fields are generated, before the collision, via the Biermann battery mechanism (32, 33), which is sustained by the shearing instability between the jet and the ambient medium. It is this field that is then tangled and amplified by turbulent motions. Fig. 4 shows that the magnetic field is larger by a factor of 2–3 in the case of collision of the two jets compared with the unperturbed single jet. The FLASH simulation reproduces the morphology and time behavior of the magnetic field, including the time at which the field changes sign. We expect the simulation to underpredict the peak magnetic field in the colliding jets case since turbulent amplification is not properly captured in 2D geometry.
Fig. 4.
Time evolution of the magnetic field. (A) The magnetic field components measured at 3 cm from the carbon foil in the case of a single jet (see Fig. 1 for the axis coordinates). (B) Magnetic field components measured in the case of jet collision. The time resolution of the magnetic field traces is 10 ns. These have been extracted from the recorded induction coil voltages. Details are given in ref. 10. The initial ( ns) high-frequency noise due to the laser–plasma interaction with the target has been filtered. The dashed lines in both panels correspond to the average azimuthal magnetic field obtained from the FLASH simulations in a volume of radius 1 mm and length 3 mm centered at the midpoint between the two target foils. Due to cylindrical symmetry of the simulation domain, the measured component that is closest to the calculated one is .
Most importantly, the amplified magnetic field detected in the experiment is larger than the Biermann battery-produced field. This suggests that amplification has reached the nonlinear regime, with the amplified field roughly proportional to Rm1/2. This conclusion is further supported by measurement of the magnetic energy spectrum , shown in Fig. 3B. Translated into wavenumber spectrum, this spectrum is (see Supporting Information), substantially shallower than the low-Rm Golitsyn spectrum (29), which we observe in the case of no jet collision, so both less turbulence and lower Rm (10). The emergence of progressively shallower magnetic spectra is a sign of nonlinear field amplification, which is a precursor to turbulent dynamo (31).
Despite important differences, the laboratory simulation of an intracluster plasma that we have created offers an important tool for modeling the amplification of magnetic fields by turbulent astrophysical plasmas.
Materials and Methods
Radiation MHD Simulations.
We have performed 2D cylindrical MHD simulations of the experiments using FLASH (21, 22, 36, 37), a publicly available (flash.uchicago.edu), open source, modular, multiphysics, finite volume, Eulerian, shock-capturing code. To model the full range of physical processes involved in the experiments, our simulations include an unsplit staggered mesh MHD solver (38), extended to three temperatures and cylindrical geometry (22, 37), explicit Spitzer resistivity, and implicit thermal conduction and heat exchange, as well as multigroup radiation diffusion with multimaterial tabulated opacities and equations of state. The laser energy deposition is accurately modeled using a 3D in 2D ray trace laser package, whereas the Biermann battery source is added to the MHD equations (39).
We initialize the simulations with two carbon foil targets having density 1.13 g/cm3, radius 250 µm, and thickness 100 µm located at [0,0 cm] and [0,6 cm] (i.e., separated by 6 cm) in a cylindrical () computational domain, which is filled with argon gas at 1 mbar and at room temperature. Each target is illuminated by a laser whose energy is taken to be the measured value (i.e., J) for a duration of , with a spot size of 300 µm. We used the measured shock position of the single jet at different times for a range of different laser energies to calibrate the fraction of the laser energy that is deposited in the target. We find that a fraction 57% is consistent with all of the measured shock positions within uncertainties, and we therefore use this fraction in our simulations.
We use eight levels of refinement and blocks of cells, obtaining an equivalent resolution of µm per cell ( zones). The reconstruction is carried out with a piecewise linear method (PLM), using a minmod limiter; the Godunov fluxes are recovered with a Harten–Lax–van Leer Contact Riemann solver (40). Outflow (zero gradient) boundary conditions are used except for the z axis where axial symmetry is enforced. We performed several simulations of the described setup for a single jet and for two colliding jets and followed their evolution for 2.5 µs. The agreement of the FLASH MHD simulations with the experimental results is good: The simulations quantitatively reproduce the flow characteristics, such as the jet morphology; the position of the face of the jet with time; the electron number density and temperature in the interaction region; and the morphology and time behavior of the magnetic field, including the time at which the field changes sign. The simulations underpredict the magnetic field strength since its turbulent amplification is not properly captured in a 2D geometry. The Biermann battery mechanism has only a minor effect on the magnetic field in the interaction region of the colliding jets experiment (see Fig. S1).
Fig. S1.
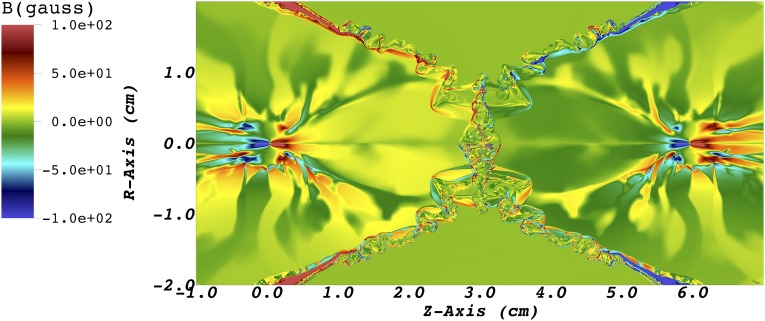
Effect of the Biermann battery mechanism on the magnetic field in the interaction region of the colliding jets experiment. The top half of the image shows the magnetic field strength at t = 1 µs in a FLASH simulation of the colliding jets experiment in which the Biermann effect was turned off at t = 716 ns (i.e., just before the two jets collide). The bottom half of the image shows the same, except the Biermann effect was on throughout the simulation. Comparison of the two images shows that the morphology and the overall value of the magnetic field are similar in both cases, demonstrating that the Biermann battery mechanism has only a small effect on the magnetic field in the interaction region.
Two important characteristics of the experiments are the strength of the turbulent mixing produced by the collision of the jets and the persistence of the turbulent mixing. These characteristics are important for converting much of the kinetic energy in the jets into turbulence, which amplifies the seed magnetic fields in the jets.
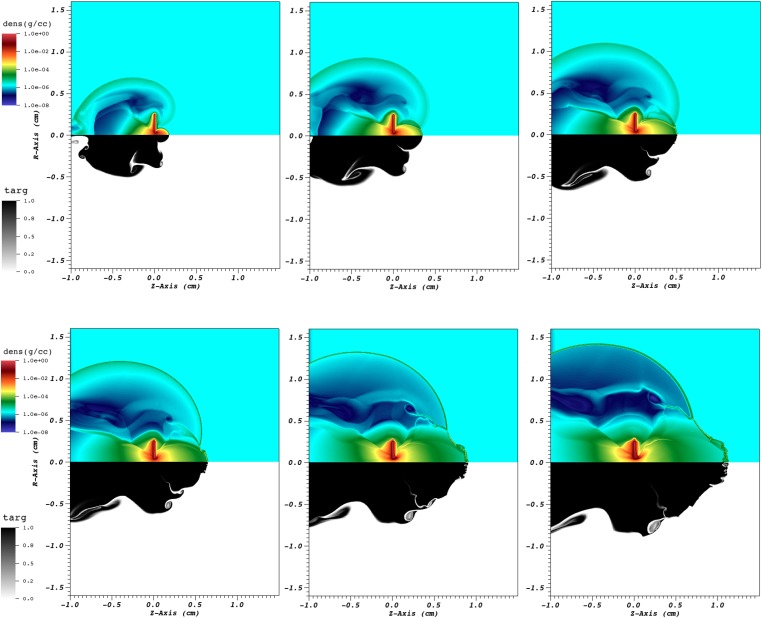
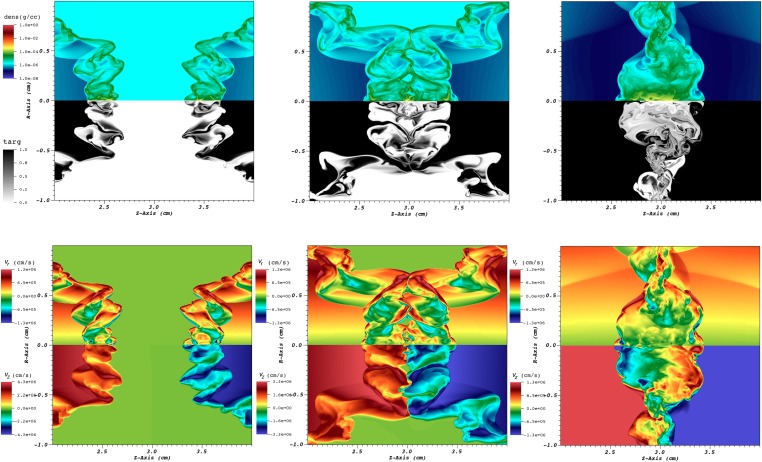
The FLASH simulations show that these characteristics result from the setup chosen for the experiment. Specifically, for the chosen setup, the carbon plasma produced by ablation of the target by the laser has just enough time to engulf the carbon foil target, wrap around it, and launch a shock in the argon gas before the jets are able to get ahead of it. As a result, the shock pinches the carbon jets. This pinching effect produces ripples in the faces of both jets that cause the fronts to become unstable (see Fig. S2). It also causes the faces of both jets to have a shallow cup-like shape (so that, viewed in cross section, the faces of both jets have shallow, double-horned shapes).
Fig. S2.
Pinching of the jets by the wrap-around shock in the argon gas. The six panels show close-up images of the shock produced by the carbon ablated by the laser, and the carbon jet at (left to right, top to bottom) 20 ns, 40 ns, 60 ns, 80 ns, 120 ns, and 160 ns showing the logarithm of the density (dens, top) and the target (targ) material fraction (bottom). The images show that the carbon plasma produced by ablation of the target by the laser has just enough time to engulf the carbon foil target, wrap around it, and launch a shock in the argon gas before the jets are able to get ahead of it. As a result, the shock pinches the carbon jets. This pinching effect produces ripples in the faces of both jets that cause the fronts to become unstable.
When the two jets subsequently collide, the parts of the jet fronts that first do so are the rims of the shallow cup. (Viewed in cross section, it is the two shallow horns of each jet that meet first.) As a result, the argon gas between the faces of the two jets is trapped and mixes violently with the carbon in the jets (see Fig. S3).
Fig. S3.
Trapping and violent turbulent mixing of the argon gas and the carbon in the jets when the two jets collide. (Upper) Close-up images of the interaction region at 600, 800, and 1,500 ns, showing the logarithm of the density (top) and the target material fraction (bottom). (Lower) Close-up images of the interaction region at the same three times, showing the radial velocity perpendicular to the axes of the jets (top) and the velocity parallel to the axes of the jets (bottom). The images show that the mixing between the argon gas and the jets is thorough and persists for µs.
As the two jets continue to collide, part of the carbon in the rims of the faces of the two jets does flow outward, producing the expected disk-like flow, but at low velocity. The reason is that the remainder of the rims of the faces of both jets flows inward, further trapping the argon plasma. The resulting interaction region expands, to some extent, longitudinally (i.e., along the axes of the two jets) as the density of the plasma in the jets that arrives in the region decreases, but it cannot escape laterally (i.e., perpendicular to the axes of the two jets). The result is violent, turbulent mixing of the argon gas and the carbon in the jets that persists for µs.
Cooling Rates and Emission Spectra Calculations.
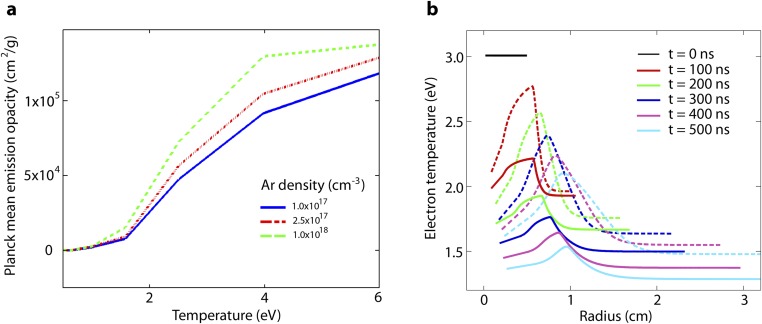
The calculation of the Planck mean opacity () for argon was performed with the PROPACEOS (PRism OPACity and Equation Of State) code (www.prism-cs.com). This includes extensive collisional–radiative free–free, free–bound and bound–bound transitions. PROPACEOS provides results that are very similar to the SESAME (41) equation of state tables, and both models are based on the same theoretical assumptions. Typical values for are given in Fig. S4. Since the cooling function depends nontrivially on both density and temperature (42), we have run a model calculation with the 1D radiation hydrodynamic code HELIOS (43) in radial geometry. The simulation was initialized with argon contained in a sphere of 0.5 cm radius and 3 eV temperature and at a density of g/cm3. The plasma is assumed to expand outward with a radial velocity of 14 km/s (see Fig. 1). The results of the simulation, using the PROPACEOS equation of state table, are shown in Fig. S4. We see that the temperature quickly drops to below 1.5 eV, and, after a jet crossing time ( 400 ns), it reaches values that are close to 1.2 eV. Fig. S4 shows the same calculation but with the radiation package in HELIOS turned off, resulting in much higher temperature profiles. It is thus clear that radiation is a major contributor to the energy loss in this plasma. The same conclusion can also be drawn from a FLASH simulation of the colliding jets experiment in which multigroup radiation diffusion (and therefore radiative cooling) was turned off at ns (i.e., just before the two jets collide) and a simulation in which it was on throughout (see Fig. S5).
Fig. S4.
Radiative cooling of the plasma. (A) Calculation of the Planck mean emission opacity () for argon as a function of typical values of density and temperature expected in the experiment. (B) 1D radiation hydrodynamic simulation with the code HELIOS showing the rapid cooling of an argon plasma sphere initialized with radius of 0.5 cm, eV, mass density of g/cm3, and outward radial velocity of 14 km/s. Results from a calculation performed with multigroup radiation diffusion turned on are shown with solid lines. Results from a similar calculation but without radiation diffusion are shown with dashed lines.
Fig. S5.
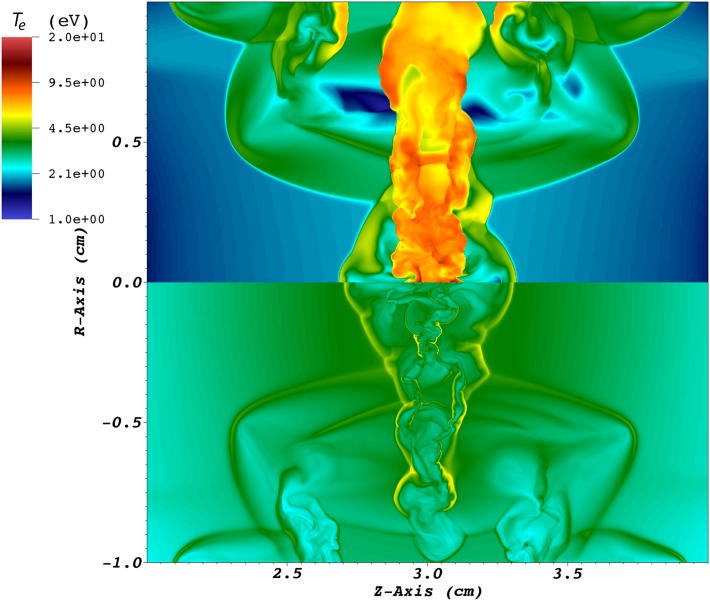
Effect of radiative cooling in the interaction region of the colliding jets experiment. The top half of the image shows in the interaction region at t = 1 µs in a FLASH simulation of the colliding jets experiment in which multigroup radiation diffusion (and therefore radiative cooling) was turned off at ns (i.e., just before the two jets collide). The bottom half of the image shows the same, except multigroup radiation diffusion was on throughout. Comparison of the two images shows is a factor of 3 larger in the first case, demonstrating that radiative cooling is very important in the interaction region.
As discussed in the main text, the plasma temperature is inferred from the measurements of argon spectral lines. The spectroscopy diagnostic images a field of view that spans the horizontal midplane from the carbon foil position to the induction coil tip (see Fig. 1) onto a 50-µm slit. The spectrometer is coupled to a CCD camera with 20-ns gate width. The ratio of different emission lines has been fitted using the collisional–radiative code PrismSPECT (34) with nonlocal thermodynamic equilibrium transition rates (see Fig. 2 and Fig. S6). Line ratio of emission spectra is independent of the electron density for optically thin plasmas when collisional deexcitation of atomic level dominates over spontaneous radiative decay (44). This occurs when the electron density cm−3, where is the electron temperature (in electron volts) and is the transition energy (in electron volts). For our plasma and optical transitions in argon, we get the condition cm−3, which is well satisfied in the regime of the experiment.
Fig. S6.
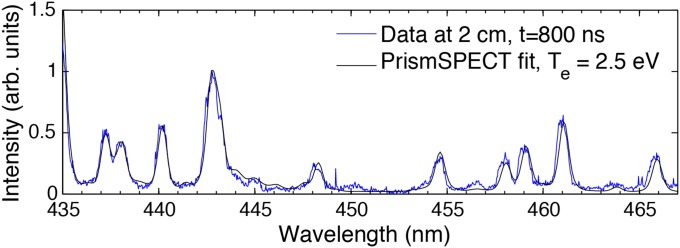
Measurement of spectral lines. Argon spectral lines at ns and 2 cm from the carbon foil target (averaged over 0.1 cm) for a single-jet experiment. Spectral fit performed with the code PrismSPECT is also shown.
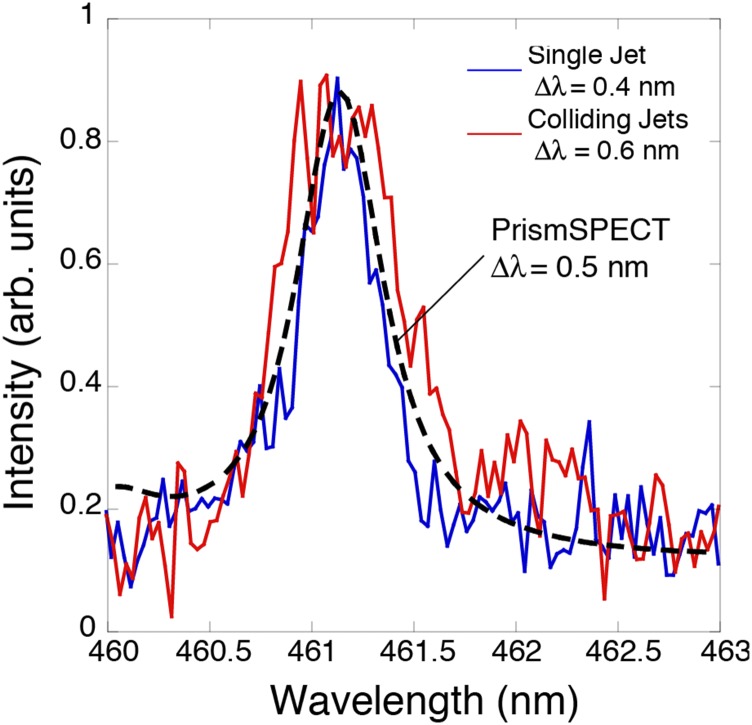
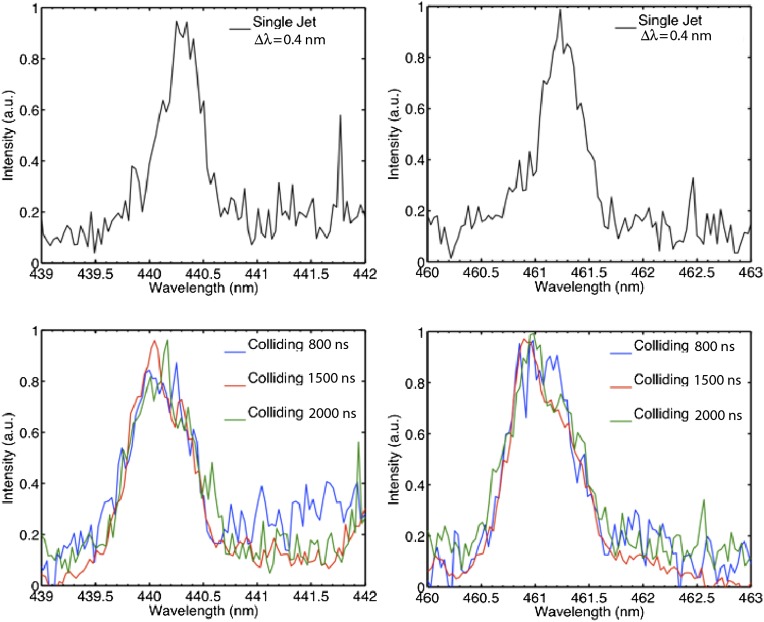
A detail of the argon line at 461 nm at 3 cm from the target is shown in Fig. S7. As discussed in the main text, in the colliding jet case, the line is broadened by 0.2 nm compared with the single-jet propagation. A fraction of the line broadening can be attributed to the increase in density and, to a minor extent, to the higher temperature. To assess this contribution, we calculated the expected line profile using PrismSPECT for a plasma with ion density of cm−3 (corresponding to the peak electron density for given in Fig. 2A, Inset) and an electron temperature of 3.5 eV. The result of this calculation is reported in Fig. S7, and the predicted width of the argon line is 0.5 nm. The further increase in line broadening observed in Fig. S7 for the colliding jet case is thus 0.1 nm, which must be attributed to turbulent motions in the collection volume. While the Mach number of the turbulence is large (4) and the turbulence is damped, the creation of turbulence in the experiment is not impulsive, but is driven as the two plasma clouds (which are 0.5 cm in extent) interact. This interaction of the two plasma clouds continuously drives the turbulence over a time period µs, as is shown by the fact that the widths of the Ar spectral lines remain broad during this time period (see Fig. S8).
Fig. S7.
Turbulent line broadening. The measured argon spectral line at 461 nm at 3 cm from the carbon foil target for colliding jets (solid red line) and a single jet (solid blue line). A PrismSPECT calculation for an ion density of cm−3 and an electron temperature of 3.5 eV is also shown (dashed black line).
Fig. S8.
Time evolution of spectral line widths. The measured argon spectral line at 440 nm (Left) and 461 nm (Right) at 3 cm from the carbon foil target for a single jet (Upper) and colliding jets at various times after the interaction (Lower).
We also notice that the Planck opacity scales with temperature as (20, 45) , with and , obtained by fitting the PROPACEOS equation of state table in the temperature and density range of interest for the experiment (see also Fig. S4). This implies a cooling function of the form , with , appropriate in the radiation diffusion approximation. Following the linear analysis of Malagoli et al. (46), the flow remains stable against cooling if , which is satisfied in our experiments. Thus, cooling instabilities are not expected to play any significant role in the formation of density clumps.
Relation Between Frequency and Wavenumber Power Spectra.
The data reported in Fig. 3B show , the magnetic field energy spectrum as a function of frequency. If the turbulent velocity fluctuations are much smaller than the mean flow velocity, , then Taylor’s hypothesis applies (47), and . This relation, when applied to the single-jet experiment, where the flow moves at the speed of the jet, gives the law for the magnetic field power spectrum. This hypothesis is clearly invalid for the case of the colliding jets. The induction probe sits at the collision center where the mean flow is at rest, and turbulent velocity fluctuations are intense.
Let’s assume the magnetic field scales as , where b is some real number. The magnetic field energy spectrum as a function of wavenumber is thus . Our experiment shows that in the colliding jets case, Kolmogorov-like turbulence is produced, as indicated in Fig. 3A. In Kolmogorov’s theory of turbulence, the velocity at scale is , so . Now, suppose the magnetic field is passively advected by the flow (i.e., there is no back reaction of the field on the fluid). This is certainly the case in the experiment where the magnetic energy is a small fraction of the inferred kinetic energy density of the turbulent motions. This then implies that and . We are measuring (see Fig. 3); hence and the power spectrum of the magnetic field is , measurably shallower than the Golitsyn’s , as expected in the dynamo precursor regime (31).
The MHD Approximation.
By design, the plasma flows in the experiment are collisional, so that the interaction of the plasma jets produces strong turbulence. As we have shown in the main text, the ion–ion mean free path is cm, which is much smaller than the characteristic size of the experiment. Such a small ion–ion mean free path ensures that kinetic processes are not important for the conditions of the experiment. Indeed, magnetic field generation by the Weibel instability is expected to become important when the ion skin depth is shorter than the mean free path. The characteristic scale for the electromagnetic instability is (48, 49) , where is the ion plasma frequency and is a coefficient that indicates that the instability requires a certain number of ion skin depths to fully develop (50). For our experimental conditions, we have cm, hence Weibel growth is strongly suppressed by collisions.
The calculated Debye length is cm, and the inferred length scale for the development of electrostatic instabilities is (48) cm, which is larger than the ion–ion mean free path, and thus electrostatic modes are suppressed by collisions.
The plasma coupling parameter is defined as (51)
| [S1] |
where Z is the ion charge, is the ion temperature (assumed to be equal to the electron temperature), and is the mean ion separation. This represents the ratio of the average Coulomb energy per ion to the mean kinetic energy. Up to a numerical factor of the order of unity, , where is the number of particles contained in the Debye sphere. An ideal (weakly coupled) plasma is a plasma for which Γ is small (or is large). Since Γ acts as an expansion parameter in the thermodynamic equations, an ideal plasma exhibits statistical properties that are similar to those of an ideal gas (51).
With regards to the experiments and numerical simulations discussed here, the assumption of ideal plasma properties is implicitly adopted in the estimates of the dimensionless parameters (e.g., the Reynolds number) and collision frequencies, as well as thermal conductivities and opacities. It is thus important to verify such assumptions. Taking, at peak compression, , eV, and cm−3, we get Γ ≈ 0.2. For values , deviations from the ideal gas internal energy are of the order of %. Similar considerations hold for other thermodynamic and statistical properties (51). These errors are smaller than those arising from measurement uncertainties and shot-to-shot variations. Moreover, in less dense plasma regions, we expect the coupling parameter to be even smaller, and thus the ideal plasma approximation is well satisfied in our experiment.
Supplementary Material
Acknowledgments
We thank the Vulcan technical team at the Central Laser Facility of the Rutherford Appleton Laboratory for their support during the experiments. The research leading to these results has received funding from the European Research Council (ERC) under the European Community’s Seventh Framework Programme (FP7/2007-2013)/ERC Grant Agreements 256973 and 247039, and the US Department of Energy under Contract B591485 to Lawrence Livermore National Laboratory and Field Work Proposal 57789 to Argonne National Laboratory. This work was supported in part by National Institutes of Health through resources provided by the Computation Institute and the Biological Sciences Division of the University of Chicago and Argonne National Laboratory, under Grant S10 RR029030-01. Partial support from the Science and Technology Facilities Council and the Engineering and Physical Sciences Research Council of the United Kingdom (Grant EP/G007187/1) is also acknowledged. The work of R.P.D, C.K., M.M., and W.W. was supported by the US Department of Energy under Grant DE-NA0001840.
Footnotes
The authors declare no conflict of interest.
This article is a PNAS Direct Submission.
This article contains supporting information online at www.pnas.org/lookup/suppl/doi:10.1073/pnas.1502079112/-/DCSupplemental.
References
- 1.Miniati F, et al. Properties of cosmic shock waves in large-scale structure formation. Astrophys J. 2000;542:608–621. [Google Scholar]
- 2.Norman ML, Bryan GL. 1999. Cluster Turbulence, Lecture Notes in Physics, eds Röser HJ, Meisenheimer K (Springer, Berlin), Vol 530.
- 3.Miniati F. The Matryoshka run: A Eulerian refinement strategy to study the statistics of turbulence in virialized cosmic structures. Astrophys J. 2014;782(1):21. [Google Scholar]
- 4.Govoni F, Feretti L. Magnetic fields in clusters of galaxies. Int J Mod Phys D. 2004;13:1549–1594. [Google Scholar]
- 5.Bernet ML, Miniati F, Lilly SJ, Kronberg PP, Dessauges-Zavadsky M. Strong magnetic fields in normal galaxies at high redshift. Nature. 2008;454(7202):302–304. doi: 10.1038/nature07105. [DOI] [PubMed] [Google Scholar]
- 6.Parker EN. Hydromagnetic dynamo models. Astrophys J. 1955;122:293–314. [Google Scholar]
- 7.Zweibel EG, Heiles C. Magnetic fields in galaxies and beyond. Nature. 1997;385:131–136. [Google Scholar]
- 8.Schekochihin AA, Cowley SC. Turbulence, magnetic fields, and plasma physics in clusters of galaxies. Phys Plasmas. 2006;13:056501. [Google Scholar]
- 9.Ryu D, Kang H, Cho J, Das S. Turbulence and magnetic fields in the large-scale structure of the universe. Science. 2008;320(5878):909–912. doi: 10.1126/science.1154923. [DOI] [PubMed] [Google Scholar]
- 10.Meinecke J, et al. Turbulent amplification of magnetic fields in laboratory laser-produced shock waves. Nat Phys. 2014;10:520–524. [Google Scholar]
- 11.Schlickeiser R, Shukla PK. Cosmological magnetic field generation by the Weibel instability. Astrophys J. 2003;599:L57–L60. [Google Scholar]
- 12.Medvedev MV, Silva LO, Kamionkowski M. Cluster magnetic fields from large-scale Structure and galaxy cluster shocks. Astrophys J. 2006;642:L1–L4. [Google Scholar]
- 13.Huntington CM, et al. Observation of magnetic field generation via the Weibel instability in interpenetrating plasma flows. Nat Phys. 2015;11:173–176. [Google Scholar]
- 14.Park HS, et al. Collisionless shock experiments with lasers and observation of Weibel instabilities. Phys Plasmas. 2015;22(5):056311. [Google Scholar]
- 15.Langer M, Aghanim N, Puget J. Magnetic fields from reionisation. Astron Astrophys. 2005;443:367–372. [Google Scholar]
- 16.Miniati F, Bell AR. Resistive magnetic fields at cosmic dawn. Astrophys J. 2011;729:73. [Google Scholar]
- 17.Harrison ER. Generation of magnetic fields in the radiation era. Mon Not R Astron Soc. 1970;147:279–286. [Google Scholar]
- 18.Durrer R, Neronov A. Cosmological magnetic fields: Their generation, evolution and observation. Astron Astrophys Rev. 2013;21:62. [Google Scholar]
- 19.Ryutov D, et al. Similarity criteria for the laboratory simulation of supernova hydrodynamics. Astrophys J. 1999;518:821–832. [Google Scholar]
- 20.Cross JE, Reville B, Gregori G. Scaling of magneto-quantum-radiative hydrodynamic equations: From laser-produced plasmas to astrophysics. Astrophys J. 2014;795:59. [Google Scholar]
- 21.Tzeferacos P, et al. Magnetohydrodynamic simulations of shock-generated magnetic field experiments. High Energy Density Phys. 2012;8:322–328. [Google Scholar]
- 22.Tzeferacos P, et al. 2014. FLASH MHD simulations of experiments that study shock-generated magnetic fields. High Energy Density Phys, 10.1016/j.hedp.2014.11.003.
- 23.Zhuravleva I, et al. Turbulent heating in the X-ray brightest galaxy clusters. Nature. 2014;515(7525):85–87. doi: 10.1038/nature13830. [DOI] [PubMed] [Google Scholar]
- 24.Schuecker P, Finoguenov A, Miniati F, Böhringer H, Briel U. Probing turbulence in the Coma galaxy cluster. Astron Astrophys. 2004;426:387–397. [Google Scholar]
- 25.Churazov E, et al. X-ray surface brightness and gas density fluctuations in the Coma cluster. Mon Not R Astron Soc. 2012;421:1123–1135. [Google Scholar]
- 26.Zhuravleva I, et al. The relation between gas density and velocity power spectra in galaxy clusters: Qualitative treatment and cosmological simulations. Astrophys J. 2014;788:L13. [Google Scholar]
- 27.Larson RB. Turbulence and star formation in molecular clouds. Mon Not R Astron Soc. 1981;194:809–826. [Google Scholar]
- 28.Federrath C. On the universality of supersonic turbulence. Mon Not R Astron Soc. 2013;436:1245–1257. [Google Scholar]
- 29.Golitsyn GS. Fluctuations of the magnetic field and current density in a turbulent flow of a weakly conducting fluid. Sov Phys Dokl. 1960;5:536–539. [Google Scholar]
- 30.Moffatt HK. The amplification of a weak applied magnetic field by turbulence in fluids of moderate conductivity. J Fluid Mech. 1961;11:625–635. [Google Scholar]
- 31.Schekochihin AA, et al. Fluctuation dynamo and turbulent induction at low magnetic Prandtl numbers. New J Phys. 2007;9:300. doi: 10.1103/PhysRevLett.98.208501. [DOI] [PubMed] [Google Scholar]
- 32.Biermann L. Über den ursprung der magnetfelder auf sternen und im interstellaren raum. Z Naturforsch A. 1950;5:65–71. [Google Scholar]
- 33.Gregori G, et al. Generation of scaled protogalactic seed magnetic fields in laser-produced shock waves. Nature. 2012;481(7382):480–483. doi: 10.1038/nature10747. [DOI] [PubMed] [Google Scholar]
- 34.MacFarlane J, Golovkin I, Wang P, Woodruff P, Pereyra N. Spect3d—A multi-dimensional collisional-radiative code for generating diagnostic signatures based on hydrodynamics and PIC simulation output. High Energy Density Phys. 2007;3:181–190. [Google Scholar]
- 35.Settles GS. Schlieren and Shadowgraph Techniques. Springer; Berlin: 2001. [Google Scholar]
- 36.Fryxell B, et al. FLASH: An adaptive mesh hydrodynamics code for modeling astrophysical thermonuclear flashes. Astrophys J. 2000;131:S273–S334. [Google Scholar]
- 37.Dubey A, et al. Extensible component-based architecture for FLASH, a massively parallel, multiphysics simulation code. Parallel Comput. 2009;35(10-11):512–522. [Google Scholar]
- 38.Lee D. A solution accurate, efficient and stable unsplit staggered mesh scheme for three dimensional magnetohydrodynamics. J Comput Phys. 2013;243:269–292. [Google Scholar]
- 39.Fatenejad M, et al. Modeling HEDLA magnetic field generation experiments on laser facilities. High Energy Density Phys. 2013;9:172–177. [Google Scholar]
- 40.Li S. An HLLC Riemann solver for magneto-hydrodynamics. J Comput Phys. 2005;203:344–357. [Google Scholar]
- 41.Kerley S. Equation of state and phase diagram of dense hydrogen. Phys Earth Planet Inter. 1972;6:78–82. [Google Scholar]
- 42.Zel’dovich YB, Raizer YP. Physics of Shock Waves and High Temperature Hydrodynamic Phenomena. Academic; New York: 1966. [Google Scholar]
- 43.MacFarlane J, Golovkin I, Woodruff P. HELIOS-CR—A 1-D radiation-magnetohydrodynamics code with inline atomic kinetics modeling. J Quant Spectrosc Radiat Transfer. 2006;99:381–397. [Google Scholar]
- 44.McWhirter RWP. Review paper A5. Data needs, priorities and accuracies for plasma spectroscopy. Phys Rep. 1978;37(2):165–209. [Google Scholar]
- 45.Tsakiris GD, Eidmann K. An approximate method for calculating Planck and Rosseland mean opacities in hot, dense plasmas. J Quant Spectrosc Radiat Transfer. 1987;8:353–368. [Google Scholar]
- 46.Malagoli A, Rosner R, Bodo G. On the thermal instability of galactic and cluster halos. Astrophys J. 1987;319:632–636. [Google Scholar]
- 47.Taylor GI. The spectrum of turbulence. Proc R Soc Lond A Math Phys Sci. 1938;164:467–490. [Google Scholar]
- 48.Park H-S, et al. Studying astrophysical collisionless shocks with counterstreaming plasmas from high power lasers. High Energy Density Phys. 2012;8:38–45. [Google Scholar]
- 49.Drake RP, Gregori G. Design considerations for unmagnetized collisionless-shock measurements in homologous flows. Astrophys J. 2012;479:171. [Google Scholar]
- 50.Kato TN, Takabe H. Nonrelativistic collisionless shocks in unmagnetized electron-ion plasmas. Astrophys J. 2008;681:L93–L96. [Google Scholar]
- 51.Ichimaru S. Statistical Plasma Physics. Westview; Boulder, CO: 2004. [Google Scholar]


