

Significance
G protein-coupled receptors (GPCRs) are a major pharmaceutical target. Traditionally, they were thought to lead a binary existence, adopting either an off (inactive) or on (active) state. However, recent evidence suggests GPCRs can adopt multiple conformations and these might explain biased signaling—the phenomena where different drugs binding to the same orthosteric site on the receptor can cause activation of different signaling pathways, such as β-arrestin signaling. We show a previously unidentified structure is induced in the marijuana receptor CB1 by an unusual allosteric ligand that blocks G-protein signaling but increases agonist binding and elicits biased signaling. We propose that a common structural state may exist for β-arrestin biased signaling, one that can also be attained by allosteric ligand binding.
Keywords: GPCR, CB1, protein dynamics, allosteric, biased signaling
Abstract
G protein-coupled receptors (GPCRs) are surprisingly flexible molecules that can do much more than simply turn on G proteins. Some even exhibit biased signaling, wherein the same receptor preferentially activates different G-protein or arrestin signaling pathways depending on the type of ligand bound. Why this behavior occurs is still unclear, but it can happen with both traditional ligands and ligands that bind allosterically outside the orthosteric receptor binding pocket. Here, we looked for structural mechanisms underlying these phenomena in the marijuana receptor CB1. Our work focused on the allosteric ligand Org 27569, which has an unusual effect on CB1—it simultaneously increases agonist binding, decreases G-protein activation, and induces biased signaling. Using classical pharmacological binding studies, we find that Org 27569 binds to a unique allosteric site on CB1 and show that it can act alone (without need for agonist cobinding). Through mutagenesis studies, we find that the ability of Org 27569 to bind is related to how much receptor is in an active conformation that can couple with G protein. Using these data, we estimated the energy differences between the inactive and active states. Finally, site-directed fluorescence labeling studies show the CB1 structure stabilized by Org 27569 is different and unique from that stabilized by antagonist or agonist. Specifically, transmembrane helix 6 (TM6) movements associated with G-protein activation are blocked, but at the same time, helix 8/TM7 movements are enhanced, suggesting a possible mechanism for the ability of Org 27569 to induce biased signaling.
Classically, our understanding of G protein-coupled receptor (GPCR) signaling presumed that the receptor formed one unique, active receptor structure in response to agonist binding. We now know that this paradigm is too simple. A growing body of evidence shows that GPCRs can adopt different active conformations depending on the type of signal (ligand) bound, making it unlikely that only one GPCR structure is present at any given moment (1, 2). These different ligand-dependent conformations could explain why a wide range of activities can be observed for some GPCRs, such as coupling to multiple different G-protein types or signaling through non–G-protein signaling partners, such as the protein arrestin (3). This phenomenon—diverse ligands bound to the same receptor selectively eliciting different signaling pathways—is referred to as functional selectivity or biased signaling.
What are these different receptor conformations, and why might they result in biased signaling? One possibility is that they involve different orientations of transmembrane helix 5 (TM5) and TM6 in the cytoplasmic face. An outward movement of TM6 is critical for G-protein activation, because it exposes a hydrophobic binding site and enables formation of the ternary complex of receptor, ligand, and G protein (4–9). Newer evidence suggests that there is likely some plasticity in TM6 movement during activation, with differences in either the magnitude or probability of the movement explaining varying degrees of G-protein signaling (3, 10, 11).
Some types of biased signaling may also arise when TM7 and its attached helix 8 (H8) adopt different conformations in the cytoplasmic face, because movements in this region have been detected during receptor activation (12–14). However, H8/TM7 movement does not seem to be required for G-protein activation (15), and this region does not contact the G protein in the recent ternary complex structure (7). For these reasons, H8/TM7 movements may not be directly involved in G-protein binding but rather, may play a role in the binding of arrestin and/or kinase, thus triggering arrestin-centric signaling pathways (14, 16).
The mechanism(s) through which allosteric molecules alter GPCR structure is also an unresolved question and an area of increasing interest (17–19) for which novel approaches are being developed (20) because of the potential that these ligands offer for new treatment paradigms (21). Allosteric ligands for several GPCRs have now been identified, including ligands for the cannabinoid, muscarinic, and μ-opioid.
To gain more information about the structural changes accompanying both biased signaling and allosteric modulation of GPCRs, we have been studying the effects of an unusual allosteric ligand on CB1, the marijuana GPCR. The use of this ligand, called Org 27569, provides a unique way to detect previously unidentified GPCR conformations for several reasons. First, because it binds allosterically, Org 27569 likely uses a different mechanism to act on CB1. It also enables well-characterized radioactively labeled orthosteric CB1 ligands to be used. Second, Org 27569 exhibits a number of unusual effects—it increases agonist binding to the receptor while simultaneously inhibiting G-protein activation (10, 22), and inducing biased signaling (23–25). Thus, it is hard to imagine how these different effects could occur unless the CB1–Org 27569 bound state adopts a unique and different conformation. A cartoon representation of CB1 and the putative Org 27569 binding site is shown in Fig. 1.
Fig. 1.

A 2D cartoon model of CB1 showing the approximate location of orthosteric and allosteric binding sites and the various mutations used. The traditional (orthosteric) ligand binding site is depicted as a dashed white oval, and the (proposed) allosteric ligand Org 27569 binding site is depicted as a dashed purple circle (50). Key point mutations in CB1 include a CAM (I348Y6.40; green) or CIM (Y294A5.58; red). These mutations presumably cause their effect by altering interactions with a highly conserved Arg (R) in TM3 (black square). Radioligand binding studies used CB1-Gαi, a full-length human CB1 receptor fused to the G-protein Gαi (tan). SDFL studies used a minimal cysteine receptor (θ) with a truncated N terminus (Δ87) and a truncated C terminus (Δ417) to which the 1D4 epitope tag (black boxes) is attached to enable purification and unique reactive cysteines introduced at either TM6 (A342C6.34; blue) or H8/TM7 (L404C8.50; orange) to enable labeling with the fluorophore bimane (Inset). The different C-terminal modifications following residue 417 are indicated as X, where the sequence is either X1 (for CB1-Gαi) or X2 (for θ).
Recently, we reported that, although Org 27569 stabilizes CB1 interactions with the agonist, it simultaneously blocks the TM6 movements required for G-protein activation discussed above (10), thus explaining the negative effect of Org 27569 on G-protein signaling. These conclusions were based on site-directed fluorescence labeling (SDFL) studies of purified CB1 that showed that, although Org 27569 induces CB1 to adopt a high-affinity agonist binding conformation, it is not the high-affinity agonist binding conformation traditionally associated with the formation of the ternary complex with G protein (4).
Here, we set out to characterize the conformation and energetics underlying this unique Org 27569 trapped state and identify a mechanism for the unusual effects discussed above using a combination of classical pharmacology, mathematical modeling, and SDFL studies. One goal was to determine if Org 27569 could act on the receptor in the absence of an orthosteric ligand. Another goal was to explore the linkage between Org 27569 binding and TM6 movements in CB1 by asking the question: because Org 27569 binding blocks TM6 movement, does impairing TM6 movement inhibit Org 27569 binding? We did this by creating and testing two different CB1 mutants: one constitutively active mutant (CAM) and one constitutively inactive mutant (CIM). In these mutants, TM6 movement was either enhanced (CAM) or impaired (CIM). Radioligand binding studies were then performed on these mutants in the presence of Org 27569 to test the above hypothesis and assess the energetics underlying Org 27569 binding. [All radioligand binding and efficacy measurements, unless otherwise stated, were done in the absence of sodium, a well-known negative allosteric modulator of GPCR activity, to enhance basal activity and reduce allosteric variables. This fact could contribute to the relatively high R*/R ratios that we observe for WT CB1 along with the use of G-protein chimeras in our measurements (because G proteins can allosterically modulate receptor affinity).]
Finally, we used SDFL to probe the structural differences between active, inactive, and Org 27569-bound CB1, with the goal of identifying other structural changes in the receptor that might explain the mechanism of allosteric modulation and biased signaling, specifically focusing on movements at TM6 as well as H8/TM7. Our results are intriguing—they show that Org 27569 binding stabilizes a different receptor conformation, one that may be related to its ability to induce biased signaling.
Results
Allosteric Ligand Org 27569 Simultaneously Enhances Agonist Binding While Inhibiting CB1 Signaling, and It Can Inactivate Receptor Signaling by Itself in the Absence of Agonist.
As shown in Fig. 2A and noted previously (22), the allosteric ligand Org 27569 can enhance binding of the agonist CP 55940 to CB1 in membranes but does not stimulate antagonist SR141716A binding. Additional analysis suggests that this inhibition of antagonist binding is not competitive but rather, occurs through an allosteric mechanism (Fig. S1). To test if Org 27569 can bind and act on CB1 by itself in the absence of other ligands, in Fig. 2B, we measured its effect on CB1 constitutive activity (that is, the activation of G proteins by CB1 in the absence of agonist).
Fig. 2.

The allosteric ligand Org 27569 enhances agonist binding while simultaneously inactivating CB1, and it can also inactivate receptor signaling, even in the absence of agonist. (A) Specific equilibrium binding of either radioactive agonist (0.4 nM 3H CP 55940; purple circles) or antagonist (0.2 nM 3H SR141716A; red triangles) was determined in the presence of increasing concentrations of the allosteric ligand Org 27569. The KdOrg values are 1.23 ± 0.32 μM with respect to agonist and 32 + 18 μM with respect to antagonist when fit to the allosteric ternary complex model. Org 27569 increases binding of the agonist, whereas it has little effect on the antagonist binding until much higher concentrations are used. (B) Dose–response curves measuring the inhibition of GTPγS binding to WT CB1-Gαi by the following compounds: antagonist (SR141716A; red triangles), the allosteric inverse agonist Org 27569 (gray squares), and Org 27569 in the presence of 1 μM agonist CP 55940 (purple circles). The EC50 values are 7.0 ± 0.8 nM for SR141716A, 31 ± 5 μM for Org 27569, and 1.9 ± 0.3 μM for CP 55940/Org 27569. Each symbol represents the mean ± SEM for at least two independent experiments performed in duplicate.
Fig. S1.
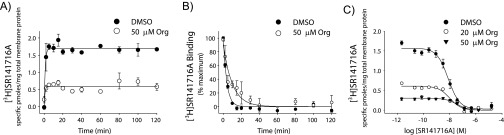
Evidence that Org 27569 inhibits antagonist SR141716A binding through an allosteric mechanism and not by directly competing with the antagonist binding site. (A) Time course of antagonist association in the presence or absence of allosteric ligand Org 27569. The kon(obs) values are 1.0 ± 0.3 and 1.3 ± 1.0 min−1 for vehicle and with 50 μM Org 27569, respectively. These results suggest that we are at equilibrium in our experiments using the [3H]SR141716A antagonist (0.57 ± 0.11 nM), because no major changes in the fraction bound are observed for up to 2 h. The small differences in the observed rates of association are not statistically significant and are likely caused by noise in the limited number of early data points during the rapid rise to equilibrium. Nonspecific binding for specified times was determined in the presence of 5 μM SR147116A. (B) Dissociation binding study using the isotopic dilution method shows that the dissociation of the antagonist SR141716A (koff = 0.26 ± 0.02 min−1) is slowed by the presence of 50 μM Org 27569 [koff(obs) = 0.099 ± 0.02 min−1]. Such a result indicates that an allosteric mechanism is responsible for inhibition of Org 27569 binding. (C) Heterologous antagonist competition experiments measuring the ability of Org 27569 to inhibit antagonist SR141716A binding carried out in the presence of vehicle (DMSO) or 20 or 50 μM Org 27569. The resulting Kd values are 6.8 ± 1.2, 6.7 ± 1.6, and 35 ± 19 μM for vehicle and 20 and 50 μM Org 27569, respectively. The greater errors in the latter results are, in part, caused by difficulties in fitting the much smaller difference that makes up the binding curve in the presence of 50 μM Org 27569. The absence of a significant change in the Kd for antagonist binding in the presence of Org 27569 compared with vehicle suggests that Org 27569 is not competitive for orthosteric antagonist binding. Each symbol represents the mean ± SEM for the transiently expressed CB1-Gαi fusion protein in COS-1 cells. Experiments were performed at least two times in duplicate.
Similar to the antagonist SR141716A, Org 27569 lowers basal G-protein activation in membranes expressing a CB1-Gαi fusion protein (measured as GTPγS binding), although it does so with less potency (EC50 of 31 ± 5 μM vs. 7.0 ± 0.8 nM). Interestingly, the ability of Org 27569 to inhibit CB1 activity is enhanced if agonist CP 55940 is present (EC50 = 1.9 ± 0.3 μM) (Fig. 2B), which would be expected for an allosteric ligand with positive cooperativity with respect to agonist binding. Sodium, a well-known allosteric antagonist for many GPCRs, including CB1 (26, 27), also further enhances this observed potency (Fig. S2).
Fig. S2.

Sodium significantly enhances the potency for which the allosteric ligand Org 27569 exhibits negative efficacy. Dose–response curves for allosteric ligand Org 27569 inhibition of agonist (CP 55940; 1 μM) stimulated GTPγS binding to the WT CB1-Gαi fusion protein carried out in the presence or absence of 100 mM sodium chloride (black and white circles, respectively). EC50 values are 0.7 ± 0.1 and 1.9 ± 0.3 μM with and without sodium, respectively [t(6) = 4.3; P < 0.05]. Each symbol represents the mean ± SEM for the transiently expressed CB1-Gαi fusion protein in COS-1 cells. Experiments were performed two times in duplicate.
Org 27569 Affinity for CB1 Is Different for CB1 Mutants with Altered TM6 Movements and Thus, Altered R⇌R* Equilibrium.
We hypothesized that Org 27569 may act by shifting the equilibrium between active (R*) and inactive (R) CB1 receptors, because it can suppress the basal activity of CB1 by itself (Fig. 2B). To test this hypothesis, we measured the effect of Org 27569 on CAMs and CIMs. These mutants were created by introducing mutations in the receptor that stabilize or destabilize the TM6 movement that accompanies active-state formation. The mutants targeted a key residue involved in stabilizing TM6 in the active-state structure: the arginine (R) found in the highly conserved Asp-Arg-Tyr (DRY) motif in TM3 (R3.50). To create the active mutant (CAM), we introduced a tyrosine at I3486.40 to interact with R2143.50 and stabilize TM6 in an outward, active-state conformation (28–30). The inactive receptor (CIM) was created by mutating the highly conserved Y2945.58 in TM5 to an alanine (A), thus removing its stabilizing interactions with R2143.50 (31–34).
The CB1 CAM and CIM receptors exhibited the anticipated reduction or enhancement in basal G-protein activation (Fig. S3). Importantly, their traditional (orthosteric) ligand binding pocket was not significantly perturbed, because they did not show large alterations in their agonist binding affinities [Kd = 5.6 ± 0.9 nM for WT CB1-Gαi, 7.7 ± 1.6 nM for the CIM (Y294A5.58)-Gαi, and 3.9 ± 0.3 nM for the CAM (I348Y6.40)-Gαi]. Their expression was also largely unaffected, which was confirmed by homologous radioligand binding and comparative Western blot analysis (Fig. S3).
Fig. S3.

The R⇌R* equilibrium in CB1 can be altered by introducing a constitutively activating or inactivating mutation (CAM or CIM). (A) Comparison of ligand-induced changes in GTPγS stimulation for WT CB1- Gαi as well as a CB1 CIM (Y294A5.58)-Gαi and a CB1 CAM (I348Y6.40)-Gαi. As expected, the CIM exhibits lower basal activity than WT, whereas the CAM has increased basal activity. Experiments were performed in the absence of any ligand (basal) or the presence of antagonist (SR1716A; 2.5 μM) or agonist (CP 55940; 2.5 μM). Nonspecific binding was determined in the presence of 5 μM cold GTPγS. (B) Homologous competition binding studies of the WT, CIM, and CAM all showed similar affinities for the agonist [3H]CP 55940. Fitting these data with a one-site binding model yielded a Kd = 5.6 ± 0.9 nM for WT CB1-Gαi, 7.7 ± 1.6 nM for the CIM (Y294A5.58)-Gαi, and 3.9 ± 0.3 nM for the CAM (I348Y6.40)-Gαi. (Inset) All three mutants exhibit roughly similar expression levels, which are indicated by immunoblot staining using an anti-Gαi antibody (integration of the CB1-Gαi band indicates relative intensities with respect to WT of 1.05 for the CIM and 0.62 for the CAM). The upper band corresponds to the CB1-G protein fusion protein, and the lower band corresponds to endogenous Gαi proteins present in the COS-1 cells. Experiments were carried out on COS-1 cell membranes containing transiently expressed WT and mutant CB1-Gαi fusion protein.
Org 27569 Favors a Receptor with an Inactive Conformation and Disfavors an Active Species.
Although the WT, CAM, and CIM CB1 receptors showed similar expression levels and agonist binding properties, their behavior in response to Org 27569 was dramatically different. Org 27569 no longer enhanced agonist binding for the active (CAM) receptor, whereas its potency (ability to enhance agonist binding) was increased ∼10-fold for the inactive (CIM) receptor (KdOrg = 1.23 ± 0.32 μM vs. 127 ± 86 nM). Remarkably, Org 27569 potency was so enhanced for the CIM that, at higher concentrations, it seemed to reduce agonist binding (Fig. 3A, dashed red line). Presumably, this behavior occurs because high concentrations of Org 27569 slows radiolabeled agonist dissociation so much that equilibrium was not achieved during the experiment (18). The ability of Org 27569 to inhibit CB1 function (agonist-stimulated GTPγS binding) also showed a similar trend, exhibiting the following rank order of potency: CIM > WT > CAM. This result again suggests that Org 27569 favors a receptor with an inactive TM6 conformation and disfavors an active species (Fig. 3B).
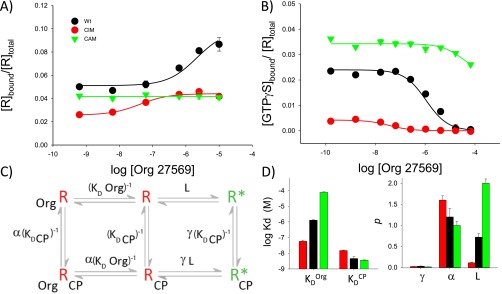
Fig. 3.

The affinity for the allosteric ligand Org 27569 is affected by activating and inactivating mutations that alter the R⇌R* equilibrium, and these values can be used to assess energetic differences between receptor states. (A) Org 27569 affects agonist [3H]CP 55940 binding differently for WT and activating (CAM) and inactivating (CIM) CB1-Gαi fusion proteins. Org 27569 does not enhance agonist binding for the CAM-Gαi (green) compared with the WT-Gαi (black). In contrast, the CIM-Gαi (red) shows such enhanced potency that nonequilibrium conditions appear to occur (agonist binding appears inhibited) at higher concentrations (dashed red line). (B) Org 27569 affects agonist-stimulated G-protein activation differently for WT, CAM, and CIM CB1-Gαi fusion proteins, which is indicated by its effect on GTPγS binding in the presence of 1 μM agonist (CP 55940). (C) Simultaneously fitting the data in A and B using global analysis and an extended allosteric ternary complex model (Fig. S4 and Table S1) suggests significant changes in the relative KdOrg values (CIM KdOrg = 58 ± 6 nM vs. WT KdOrg = 1.29 ± 0.1 μM vs. CAM KdOrg = 77 ± 6 μM). Using these values, the ΔΔG values (free energy difference of Org 27569 binding for the CAM and CIM vs. WT) are ∼2.5 kcal/mol greater for the CAM and ∼1.9 kcal/mol less for the CIM. These values are consistent with the loss or gain of a hydrogen bond interaction between a Tyr and the Arg at 3.50 thought to stabilize or destabilize the active receptor state. The graphs suggest the relative distribution of receptor in each state and were determined from the isomerization constant L (the ratio of active R* to inactive R states) (Table S1) determined from the above analysis. Note the greater amount of R* for the CAM and smaller amount of R* for the CIM.
Differences in Org 27569 Affinity for the CB1 Active and Inactive Mutants Can Be Used to Assess Differences in Free Energy Between the R and R* States.
To assess the relative affinity differences of Org 27569 for the WT, CIM, and CAM receptors, we first fit the ligand binding dose–response data (Fig. 3A) to a simple allosteric ternary complex model, which is described in SI Experimental Procedures. The results show that Org 27569 affinity is greatest for the CIM and least for the CAM, although the lack of enhanced agonist binding for the latter yielded a poor fit (CIM KdOrg = 127 ± 86 nM, WT KdOrg = 1.23 ± 0.32 μM, and CAM KdOrg = 17 ± 72 μM).
We next carried out more detailed modeling to assess the affinity of Org 27569 for each receptor and other parameters of the system. In brief, this process involved using global analysis to simultaneously fit both sets of data (Fig. 3 A and B) to an extended allosteric ternary complex model (SI Experimental Procedures and Fig. S4). The goal was to find shared parameters that best described both the receptor ligand binding data and the active receptor population (the latter was estimated by assuming that bound GTPγS reflects the amount of active receptor because of the 1:1 receptor:G-protein stoichiometry in the CB1-Gαi fusion proteins). Interestingly, only two parameters show striking differences between the WT and mutant receptors in this analysis—the affinities for the allosteric ligand (KdOrg) and L, the ratio of active to inactive receptor forms ([R*]/[R]) (Fig. S4 and Table S1).
Fig. S4.
Relative Org 27569 affinities (KdOrg), relative populations of active (R*) and inactive (R) receptors, and energy differences between the different CB1 mutant receptors estimated by simultaneously fitting the ligand binding and G-protein activation data shown in Fig. 3 using global analysis and an extended allosteric ternary complex model. (A) Org 27569 alters agonist [3H]CP 55940 binding differently for WT, CAM, and CIM CB1-Gαi fusion proteins. (B) Org 27569 affects agonist-stimulated (1 μM; CP55940) G-protein activation differently for the WT, CAM, and CIM CB1-Gαi fusion proteins. To enable global analysis (described below), the ligand binding and the activation data in Fig. 3 were transformed using the results from Fig. S3B to express the y axis as the fraction of (A) the bound receptors or (B) the active receptors vs. the total moles of receptor present (above). The latter values were estimated using the moles of GTPγS as a proxy to assess the active receptor population (because the CB1-Gαi fusion proteins used in these studies have an inherent 1:1 stoichiometry of receptor to G protein). (C) An extended allosteric ternary complex model was used to analyze these data (Scheme S4). This model includes various factors that will determine how much of the receptor is in either an active (R*) or inactive (R) state. In the absence of ligands, the ratio is simply determined by the isomerization constant (L). In the presence of ligands, the relative amounts of R* or R will also be determined by the type of ligand, how tightly it binds the receptor, and how efficiently these interactions affect the receptor. Thus, the terms that take these effects into account are the intrinsic efficacy of the agonist (γ) and its binding affinity (K−1 or KdCP) and the allosteric ligands cooperativity with the agonist (α) and its binding affinity (M−1 or KdOrg). For each of the receptor types (WT, CAM, or CIM), parameters were determined by simultaneously analyzing the data above for ligand binding and G-protein activation with Eqs. S2 and S3, respectively, to determine what values, when used together, would provide a best fit to the model. Fits with the best R2 values (coefficient of determination) were used for subsequent analysis (below) and are reported in Table S1. (D) Graph of the parameter values obtained from fitting the model to the data (Table S1). Note that only the KdOrg and L values are markedly different when this model is used to simultaneously fit both sets of data.
Table S1.
Parameter values obtained from fitting the data shown in Fig. S4, which measured the effects of Org 27569 on agonist binding and G-protein activation
| Parameters | Mutant | ||
| WT | CIM (Y294A5.58) | CAM (I348Y6.40) | |
| KdOrg | 1.29 ± 0.1 μM | 58 ± 6 nM | 77 ± 6 μM |
| KdCP | 4.6 ± 1.5 nM | 15 ± 1 nM | 3.6 ± 0.2 nM |
| γ | 0.030 ± 0.004 | 0.024 ± 0.002 | 0.015 ± 0.001 |
| α | 1.2 ± 0.2 | 1.6 ± 0.1 | 1.0 ± 0.1 |
| L | 0.72 ± 0.08 | 0.11 ± 0.01 | 2.0 ± 0.1 |
| ΔG (kcal/mol) | −8.2 ± 0.6 | −10.0 ± 1.0 | −5.7 ± 0.5 |
| R2 | 0.998 | 0.999 | 0.996 |
The data were globally fit using an extended allosteric ternary complex (Fig. S4C and Scheme S4) and the equations described in SI Experimental Procedures. The values reflect KdOrg (the equilibrium dissociation constant for Org 27569), KdCP (the equilibrium dissociation constant for the agonist CP 55940), γ (the intrinsic efficacy of the agonist CP 55940), α (the cooperativity between Org 27569 and CP 55940), L (the receptor isomerization constant; i.e., the ratio of R* to R), and ΔG (the free energy for Org 27569 binding). The R2 values reflect the coefficients of determination for the fits.
Together, these results suggest that Org 27569 favors an inactive receptor species, because they show the Kd for Org 27569 increases for the active (CAM) receptor and decreases for the inactive (CIM) receptor (CIM KdOrg = 58 ± 6 nM, WT KdOrg = 1.29 ± 0.1 μM, and CAM KdOrg = 77 ± 6 μM). The resulting isomerization constants (L values) derived for each receptor indicate that the CAM produces more receptor in the active R* form (compared with WT) and that the CIM produces less (for the CIM, L = 0.11 ± 0.01; for the WT, L = 0.72 ± 0.08; and for the CAM, L = 2.0 ± 0.1).
Finally, as described in SI Experimental Procedures, we estimated the difference in free energy between the CAM and CIM receptors relative to WT using their difference in the free energy for Org 27569 binding as a proxy. For the inactive (CIM) receptor, this analysis yielded ΔΔG = −1.9 ± 1.2 kcal/mol, and for the active (CAM) receptor, ΔΔG = 2.5 ± 0.8 kcal/mol. These results and the relative distribution of inactive R to active R* (calculated from L, the isomerization constant) are shown in Fig. 3C and Table S1.
SDFL Studies Confirm That the Binding of Org 27569 to CB1 Creates a Unique State: One That Blocks Agonist-Induced TM6 Movement but Enhances Conformational Changes at H8/TM7.
Although informative, the above experiments and analysis contain several assumptions and are based on agonist binding and the ability to activate G protein. However, they cannot discern if more than one type of G protein-inactive state (such as R, R′, and R″) is present. Thus, we next used SDFL to determine if Org 27569 inactivates CB1 by trapping a unique, inactive receptor conformation or instead, acts by stabilizing the same inactive conformation trapped by traditional CB1 antagonists, like SR141716A.
Previously, using SDFL, we discovered that Org 27569 blocks TM6 movement (10). However, in that work, we could not unequivocally determine if the Org 27569 bound structure was the same or different from the antagonist bound form. Here, to see if Org 27569 causes changes in other parts of the receptor, we used SDFL to look for movements at H8, the membrane-associated amphipathic helix located directly above TM7 in GPCRs. H8 has been proposed to undergo conformational changes that potentially play a role in biased signaling for orthosteric ligands (2, 14, 16, 35). Because the allosteric ligand Org 27569 is reported to induce arrestin signaling (23–25), we hypothesized that it might also induce changes in this region of the receptor.
We reconfirmed our previous observation (10) that agonists cause fluorescence changes in a bimane probe on TM6 (at site 342) and that these changes are blocked by both the antagonist SR141716A and the allosteric ligand Org 27568 (Fig. 4 A and B). We next tested the effect of these ligands on CB1 with a bimane probe attached on H8 (at site 404). To our initial surprise, the results were very different—the agonist caused an ∼20% decrease in bimane fluorescence for the probe at H8 (Fig. 4D). Moreover, adding Org 27569 did not block this change but rather, causes an ∼20% additional decrease in fluorescence. Both of these effects are in stark contrast to the lack of changes observed in the presence of antagonist SR141716A (Fig. 4E).
Fig. 4.

SDFL studies indicate that the allosteric ligand Org 27569 captures a unique receptor conformation: one that lacks TM6 movement but has enhanced conformational changes around H8/TM7. A bimane fluorescent probe on TM6 (at site 342) or H8 (site 404) detects different conformational changes in CB1 on agonist and allosteric ligand binding. The order of ligand addition is indicated by the number and compound. (A) For the probe at TM6, agonist (CP 55940; 10 μM; green) causes an ∼25% increase in bimane fluorescence compared with the apo state (Fo; gray). This change is reversed by the subsequent addition of allosteric ligand Org 27569 (20 μM; purple). (B) Antagonist (SR141716A; 10 μM; red) causes no change. (C) Dose–response plots in the presence or absence of Org 27569 (5 μM) confirm the results shown in A and our previous studies (10). (D) For the bimane probe at H8, agonist (CP 55940; 20 µM; 30 min incubation, green) causes an ∼20% decrease in fluorescence intensity compared with the apo state (Fo; gray). Addition of Org 27569 (20 μM, 15 min incubation, purple) to the CP 55940-treated sample does not block the fluorescence change but rather, causes an additional 20% decrease in intensity. Each spectrum is normalized to the apo state (gray). (E) In contrast, antagonist (SR141716A; 10 μM; red) causes no fluorescence change. (F) Dose–response plots of the experiments in D. Both the potency and magnitude of this agonist-induced decrease in bimane fluorescence for the probe at H8 are enhanced in the presence of Org 27959 (10 μM).
Importantly, the fluorescence changes at both sites are reproducible and occur in a dose-dependent fashion (Fig. 4 C and F). As discussed below, these results show that Org 27569 binding produces a distinct receptor conformation that is significantly different from the other ligand-bound receptor states.
SI Experimental Procedures
Buffers.
The definitions for buffers are 0.137 M NaCl, 2.7 mM KCl, 1.5 mM KH2PO4, and 8 mM Na2HPO4; 5 mM Tris·HCl, 2 mM EDTA, and PIC (protease inhibitor cocktail), pH 7.5 (hypotonic buffer); 20 mM Tris·HCl, 1 mM EDTA, and 5 mM MgCl2, pH 7.4 (TME); TME and 1 mg/mL BSA (Wash Buffer); TME and 5 mg/mL BSA (Binding Buffer); and 50 mM Tris, pH 7.5, 200 mM NaCl, 5 mM MgCl2, 20% (wt/vol) glycerol, 0.12% CHAPS, 0.02% n-Dodecyl-β-d-Maltopyranoside, and 0.02% Cholesteryl Hemissuccinate (Purification Buffer).
Cloning and Mutagenesis.
Site-directed mutants were constructed using overlap extension PCR to generate mutants in the following CB1 gene constructs: shCB1-Gαi, shCB1, and θ (10, 48, 49). The mutant-θ is a nonreactive, minimal cysteine construct that contains only 2 of the original 13 cysteines (Cys-257 and Cys-264). Use of the θ-mutant enables the introduction of uniquely reactive cysteine residues for fluorescence labeling studies, and its N- and C-terminal deletions facilitate purification as described previously (10).
Transfection.
Mutant CB1 constructs were expressed in COS-1 cells as previously described (10, 38). Briefly, 15-cm plates were incubated with 0.1 mg PEI (polyethylenimine) MW (molecular weight) 25,000 (Polysciences) and 35 μg plasmid DNA for ∼60 h. Mutants used for purification and subsequent SDFL studies were grown in the presence of 100 nM SR141716A.
Radioligand Binding.
Competitive inhibition binding and agonist-stimulated GTPγS incorporation for CB1 mutants in membranes were measured using a Brandell M48 Cell Harvester as previously described (48, 49). Of note, ligand binding studies were conducted with the receptor preincubated with radioligand before the addition of the cold drug to be tested. [35S]GTPγS was purchased from PerkinElmer Life Sciences, and CB1 radioligands CP 55940 and SR141716A were a gift from the NIDA (National Institute of Drug Abuse) Drug Supply Program. Experiments were done at least two times in either quadruplicate or duplicate, and all binding was done in the absence of sodium unless otherwise indicated.
The homologous competition binding data (Fig. S3B) were fit to a one-site binding model, and Kd and Bmax values were estimated using a previously described method (49).
Formulation of the Model and Analysis of Allosteric Binding and Activation Data.
In either the presence or absence of ligand, a two-state model (Scheme S1) can be used to describe the transition of the inactive receptor (R) to an active receptor (R*) (30). In the absence of ligand (A), the relative distribution of R* to R states is governed by the isomerization constant (L). The orthosteric ligand (A) can promote the transition to the R* state governed by its association constant (K) and its intrinsic efficacy (γ).
Schemes S1–S3.
Similarly, an allosteric ternary complex model (Scheme S2) can be used to describe how allosteric ligands bind in the presence or absence of a traditional (orthosteric) ligand (22). In this model, the receptor (R) can bind either an orthosteric ligand (A) and/or an allosteric ligand (B). The affinities for A and B toward the receptor are determined by their affinity constants, K and M, respectively, and α is the cooperativity factor for their interaction.
Such an allosteric ternary complex model was initially used to analyze the data in Figs. 2A and 3A (allosteric modulation of the radioligand binding data), which we have described previously (10). Initial values of KdOrg (KB) were determined from least squares fitting of Eq. S1 below, and the concentration of allosteric ligand is [B]. KA and KB are the dissociation constants for the orthosteric and allosteric ligands, respectively, and α is the binding cooperativity factor between the orthosteric and allosteric ligands. The radioactive orthosteric ligand concentration used in the binding assays is [A]:
| [S1] |
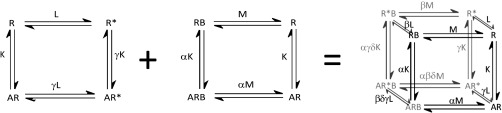
The two models discussed above (Schemes S1 and S2) can be combined to create a model describing the allosteric modulation of orthosteric ligand binding and receptor transition into the active state. Such an allosteric two-state model (Scheme S3) has been previously described by Hall (37).
In this model, R is the inactive receptor that transitions to the active state (R*), where the receptor isomerization constant L defines the ratio of these two states. The orthosteric ligand (A) can promote the transition to the R* state governed by its association constant (K) and its intrinsic efficacy (γ). The allosteric ligand (B) can bind to the receptor governed by its association constant (M) and the cooperativity between A and B (α). The allosteric ligand can modify the transition to the activated receptor state governed by its intrinsic efficacy (β) and activation cooperativity between A and B (δ).
The model in Scheme S3 can be further simplified in the following way. The CB1 allosteric ligand Org 27569 is said to have negative intrinsic efficacy (denoted as β), because it inhibits active (R*) receptor signaling (Fig. 2B) (10, 22). If we assume that Org 27569 does not bind to the activated receptor state (R*), an assumption supported by our ligand binding to the CB1 CAM (Fig. 3A), then we can assume that the β-term approaches zero. In such a case, all concentrations of species in the allosteric two-state model (Scheme S3) that are determined by the β-term are eliminated, and Scheme S3 reduces to the extended allosteric ternary complex model (Scheme S4).
Schemes S4.

We used this extended allosteric ternary complex model to analyze both the allosteric enhancement of agonist binding and the inhibition of agonist-stimulated GTPγS incorporation data shown in Fig. 3 and Fig. S4.
In this model, R is the inactive receptor that transitions to the active state (R*), and its relative concentration is defined by L (the receptor isomerization constant). The orthosteric ligand (A) can promote the transition to the R* state governed by its association constant (K) and its intrinsic efficacy (γ). In contrast, the allosteric ligand (B) favors an inactive state governed by its association constant (M) and the cooperativity between A and B (α).
The mathematical expression for this model is shown below (Eqs. S2 and S3):
| [S2] |
and
| [S3] |
The models in Scheme S4 and Eqs. S2 and S3 were used to globally fit both the stimulation of agonist binding and the inhibition of agonist-stimulated GTPγS incorporation by the allosteric ligand for each CB1 mutant shown in Fig. 3 and Fig. S4 as briefly described below.
To enable the global analysis, the ligand binding and the activation data in Fig. 3 were first transformed using the results from Fig. S3B to express the y axis as the fraction of the bound receptors (Fig. S4A) or the active receptors (Fig. S4B) vs. the total moles of receptor present (above). The latter values were estimated using moles GTPγS as a proxy to assess the active receptor population (because the CB1-Gαi fusion proteins used in these studies have an inherent 1:1 stoichiometry of receptor to G protein).
Thus, to reiterate, for each of the receptor types (WT, CAM, and CIM), the parameters in Scheme S4 were determined by simultaneously analyzing the data above for ligand binding and G-protein activation with Eqs. S2 and S3, respectively. The goal was to determine what values, when used together, would provide a best fit to the model. Results of these fits and the coefficient of determination (R2) derived from the means of the data and model are reported in Table S1. Error estimates for all parameters were derived from global least squares fits of bootstrapped data.
The change in free energy of binding compared with WT was calculated from Eq. S4 using the KdOrg values (allosteric ligand dissociation values) for WT and each mutant obtained from fitting the above extended allosteric ternary complex model to the data. R is the universal gas constant, and T is the temperature in Kelvin:
| [S4] |
Dissociation kinetic assays (Fig. S1B) were performed with CB1 receptor antagonist [3H]SR141716A (∼0.5 nM) in binding buffer using a total assay volume of 500 μL. The isotopic dilution method was used to measure the dissociation rate constant for [3H]SR141716A (22). Briefly, this first involved incubating the CB1-expressing COS-1 membranes (25 μg) for 60 min at 30 °C and then, at the respective time points, adding 1 μM unlabeled ligand (final concentration) in the presence or absence of 50 μM Org 27569. Subsequent filtration and radioactive counting were carried out as previously described (48, 49). Rate constants were determined by fitting a two-parameter exponential decay to the data.
Association experiments (Fig. S1A) were performed by adding CB1 receptor antagonist [3H]SR141716A (∼0.5 nM) in binding buffer to CB1-expressing membranes (25 μg) at the respective time points. Subsequent filtration and radioactive counting were carried out as described above. Rate constants were determined by fitting a monoexponential rise to maximum to the data.
CB1 Purification.
Immunoaffinity purification and bimane labeling of CB1 mutants for SDFL measurements were carried out using previously described procedures (10, 48).
Fluorescence Measurements.
Experiments were conducted as previously described. In brief, steady-state measurements were performed using a PTI fluorescence spectrometer. Emission spectra were measured by excitation at 380 nm, and emission was collected from 400 to 650 nm. Slit widths were 2 nm for excitation and 12 nm for emission. Fluorescence spectra were buffer-subtracted and corrected for dilution.
Discussion
Our goal was to gain new structural insights into the mechanism and energetics underlying allosteric modulation of GPCR activation, attenuation, and biased signaling. We focused on studying how an allosteric ligand for CB1 (Org 27569) can induce positive cooperativity for agonist binding but simultaneously, reduce signaling by the agonist bound receptor and how these effects might be related to the reported biased signaling that this compound can induce in CB1 (23–25).
Initial evidence that Org 27569 and the antagonist SR141716A trap different receptor conformations is seen in the radioligand binding studies (Fig. 2). They show that Org 27569 does not need agonist to bind CB1 and inhibit R* formation (Fig. 2B), although cobinding with agonist does enhance Org 27569 potency. In contrast, Org 27569 impairs antagonist SR141716A binding (Fig. 2A), presumably through an allosteric mechanism (Fig. S1).
Additional evidence that Org 27569 traps a unique receptor conformation is clear in the functional studies of two different CB1 mutants (Fig. 3). In these mutants, TM6 movement was altered to produce either an active (CAM) receptor (mutant I348Y6.40) or an inactive (CIM) receptor (mutant Y294A5.58) using substitutions well-established to impart these properties in other GPCRs (28, 31–33, 36). Importantly, these mutations are outside the orthosteric ligand binding pocket and cause no significant change in receptor expression levels or agonist affinity (Fig. S3). Thus, dose–response experiments between these mutants could be directly compared to assess the effect of Org 27569.
These experiments show that the ability of Org 27569 to act on CB1 is directly linked to the TM6 movement that is associated with G-protein activation. When TM6 movements are impaired (as in the CIM), Org 27569 potency is greatly enhanced. When TM6 movements are enhanced (as in the CAM), Org 27569 potency is greatly reduced in regards to both stimulation of agonist binding and inhibition of G-protein activation (Fig. 3).
Our additional analysis of these data using a simplified version of the allosteric ternary two-state model (37) revealed several insights (Fig. S4 and Schemes S1–S4). First, the results suggest that some level of conformational selection might also be involved in Org 27569 binding, because Org 27569 affinity is inversely proportional to the amount of active R* CB1 present. Together, these data provide additional evidence that Org 27569 prefers an inactive receptor state that lacks TM6 movement. Second, the ΔΔG for Org 27569 binding to these mutants relative to WT (estimated from the differences in Kd for Org 27569) shows an ∼2.5 kcal/mol increase for the CAM and ∼1.9 kcal/mol decrease for the CIM.
Coincidently, these energy values are consistent with a loss or gain of a hydrogen bond between tyrosine and the arginine at position 3.50—interactions previously proposed to either stabilize (CAM) or destabilize (CIM) the active receptor state because of their effect on TM6 movements (28, 31–33, 36). We note, however, that these interpretations are only suggestive. The activation pathway likely results in the formation/breaking of many other interactions, resulting from not only movements of TM6 but also, rearrangements in TM5 and TM7 and alteration of water-mediated interhelical interactions. Thus, the effect of these mutations could be because of altering one or more steps on this activation pathway and not simply the breaking or making of one hydrogen bond. Interestingly, although not directly comparable, these energy differences are of a similar magnitude as the activation energy barrier for TM6 movement previously measured for the corresponding CAM mutation in rhodopsin (38).
Another important caveat regarding our pharmacological studies–although they provide a good first approximation for assessing the receptor behavior with regards to agonist binding and G-protein activation, our modified allosteric ternary complex model cannot discern if more than one type of G protein-inactive state (such as R, R′, and R″) is present. Thus, it cannot discriminate a truly inactive (R) species from one that seems inactive in the above measurements but exhibits biased arrestin signaling (because of a different inactive receptor conformation, R′).
To address this issue, we next turned to SDFL studies to look for possible differences in inactive-state conformations that the above pharmacological analysis could not identify.
SDFL Studies Confirm That Org 27569 Traps the Receptor in a Different Inactive Conformation than the Traditional Orthosteric Antagonist SR141716A.
The SDFL results directly rule out the possibility that Org 27569 acts by simply shifting the equilibrium toward the traditional, inactive conformation. They show that Org 27569 binding produces a unique, inactive-like receptor state, which is different from the antagonist bound, inactive state. Moreover, the SDFL data show something interesting—agonist induces fluorescence changes for a probe on either TM6 or H8/TM7, whereas the antagonist does not. In contrast, the allosteric ligand enhances the fluorescence changes for the probe at H8/TM7, whereas it blocks agonist-induced changes at TM6 (Fig. 4) (10).
These observations yield two important new insights. First, they show that Org 27569 affects movements at H8/TM7 in a different way than it affects movements at TM6. Second, they show that H8/TM7 can move independently of TM6. The latter observation is especially intriguing, because we find that agonist-induced changes at TM6 occur more slowly (10) than they do at H8/TM7 (Fig. S5). This observation may suggest that H8/TM7 movements occur before TM6 on receptor activation. Interestingly, analysis of molecular dynamics simulations of the β2-adrenoreceptor suggests that H8/TM7 and TM6 can move independently and that two inactive receptor states with differential H8/TM7 movements can occur (2).
Fig. S5.

The agonist-induced change in fluorescence occurs faster for a bimane probe on H8 than on TM6. (A) Agonist CP 55940 induced fluorescence change of a bimane probe attached to CB1 residue 342 (blue) or 404 (orange) as a function of time. F/Fo is the fluorescence normalized to the initial fluorescence (Fo). The change in bimane fluorescence was fit with either an exponential rise to maximum or an exponential decay function. (B) To enable direct comparison, the fluorescence changes in A were normalized (from zero to one), and the changes at site 404 were converted to a positive increase [(F/Fo − 1)/(Ffinal − 1)]. These data show that, under saturating amounts of agonist (10 and 20 µM CP 55940, respectively), the fluorescence change for a bimane probe at site 342 (blue) is slower than that for the same probe at site 404 (orange), suggesting that H8 can move before TM6. The relative change in bimane fluorescence was fit by a monoexponential rise to maximum [y = a(1 − e−kt)]. For 342, this analysis yields a rate constant of 0.09 ± 0.01 min−1 (t1/2 is 6.5 ± 0.7 min), and for 404, the rate constant is 0.28 ± 0.03 min−1 (t1/2 is 2.5 ± 0.3 min).
In Fig. 5, we highlight the differences between the effects caused by binding of an antagonist, the allosteric ligand Org 27569, or an agonist on the structure of the CB1 cytoplasmic face in cartoon form. The model is consistent with our SDFL results from the bimane probe on TM6 (site 342) (Fig. 5, blue circle) and H8 (site 404) (Fig. 5, orange circle) as well as previous biophysical and crystallographic studies of other GPCRs (10, 39). The model shows no changes in the antagonist bound state (R) (Fig. 5, red). In contrast, the Org 27569 bound intermediate state (R′) (Fig. 5, purple) exhibits enhanced changes around the H8/TM7 area but restricted TM6 movement. Finally, the active agonist bound state (R*) (Fig. 5, green) exhibits changes both at TM6 and around H8/TM7.
Fig. 5.

Cartoon model proposing the structural differences in CB1 trapped by antagonist, the allosteric ligand Org 27569, and agonist along with their corresponding energy landscape diagrams. The sites probed in the SDFL studies are indicated on TM6 (site 342; blue circles) and H8 (site 404; orange circles). (A) Cartoon models depicting dynamic snapshots of the cytoplasmic face of CB1 in response to antagonist, allosteric ligand, or agonist. The antagonist bound state (R; red) shows no significant changes in either TM6 or H8/TM7. In contrast, the Org 27569 bound state (R′; purple) exhibits enhanced changes around the H8/TM7 area but restricted TM6 movement. The active, agonist bound state (R*; green) exhibits both enhanced movements of TM6 and changes around the H8/TM7 area. (B) Representative free energy landscapes for the different ligand-stabilized conformational states in A depicting differences in the receptor energy profile as it progress from fully inactive (antagonist bound) toward a more active receptor.
As discussed previously (40, 41), these different types of receptor conformations can also be conceptualized in terms of free energy landscapes. As shown in Fig. 5B, the different ligand-stabilized conformational states shown in Fig. 5A can be thought to correspond to differences in the energy profiles as the receptor progresses from a fully inactive (antagonist bound) toward a more active receptor. Note that the final ternary complex state (agonist–receptor–G protein) is not depicted.
Altering the Conformational Equilibrium at TM6 and H8/TM7 May Be a General Mechanism Involved in β-Arrestin Biased Signaling Induced by both Orthosteric and Allosteric Ligands.
A current hypothesis proposes that biased ligands produce their differential response because they favor conformational changes in one region of the receptor over another. Both NMR studies of the β2-adrenoreceptor and fluorescent studies in the V2 vasopressin receptor suggest that TM7 movements are more predominant for β-arrestin–biased ligands, whereas TM6 movements are more predominant for G protein-mediated signaling (14, 16). Likewise, a crystallographic model of the arrestin biasing ligand ergotamine bound to the LSD receptor (5-hydroxytrapamine receptor type 2B) also shows active-like rearrangements of TM7 (42).
Similarly, our evidence that Org 27569 traps CB1 in a G protein-inactive intermediate state (R′) could explain why Org 27569 acts as classical antagonist in regards to G-protein activation, while at the same time, eliciting varying degrees of MAPK signaling (23, 43), presumably by acting as an arrestin-biased allosteric agonist (23, 24). The reduced TM6 movement would inhibit productive G-protein coupling, whereas the enhanced H8/TM7 movements could change the accessibility of the C-terminal tail, enabling the receptor to preferentially engage with β-arrestin. Together, these combined effects on TM6 and H8/TM7 movements could skew the system toward more biased signaling and β-arrestin activation.
We also speculate that β-arrestin signaling, caused by the low-affinity “hanging arrestin” binding described by Lefkowitz and coworkers (44) in the recent EM structures of β-arrestin bound receptor, may be precipitated by changes in H8/TM7 but not TM6 movements. Consistent with this idea, we note that Org 27569 blocks agonist-induced CB1 internalization (45) (presumably because high-affinity β-arrestin binding cannot occur when TM6 movements are blocked) but that biased signaling still persists.
How might this process occur? Arrestin recruitment and MAPK signaling by the G-protein inactive receptor could be triggered by interactions of an arrestin signaling complex with a distinct receptor phosphorylation pattern that may occur for the Org 27569 bound receptor, analogous to the effect of carvedilol on the β2-adrenoreceptor (46). Such a distinct phosphorylation pattern could be instigated by GRK5 (or GRK6), which has recently been shown to phosphorylate inverse agonist bound β2-adrenoreceptor and even rhodopsin (47).
Finally, we note that alterations of the conformational equilibrium at TM6 and H8/TM7 regions of the receptor may exist as a general mechanism used in the biased signaling of GPCRs and occur for biased allosteric ligands as well as biased orthosteric ligands (14, 16). Thus, the approach that we describe here, especially the use of SDFL to look for independent ligand-induced conformational changes at TM6 vs. H8/TM7, could be generally useful for discovering new biased ligands for GPCRs.
Experimental Procedures
Buffers, Cloning, Mutagenesis, Transfection, and Purification of CB1 Mutants.
Site-directed mutants were constructed in the appropriate CB1 gene constructs: shCB1-Gαi, shCB1, or θ (10, 48). The mutant-θ is a nonreactive, minimal cysteine construct that enables fluorescence labeling for SDFL studies and has N- and C-terminal deletions to facilitate purification (10). Transfection was carried out transiently in COS-1 cells (10, 38). Mutants used for SDFL studies were grown in the presence of 100 nM SR141716A. Immunoaffinity purification and bimane labeling of the CB1 mutants were carried out as described (10, 48). SI Experimental Procedures has more details.
Radioligand Binding and Modeling of Binding Data.
Competitive inhibition binding and agonist-stimulated GTPγS incorporation for CB1 mutants in membranes were carried out as described (48, 49). Experiments were done at least two times in either quadruplicate or duplicate. All binding experiments were done in the absence of sodium, unless otherwise indicated. Modeling was performed using an extension of methods used in our previous work (10, 48) as described in SI Experimental Procedures.
Fluorescence Measurements.
Experiments were performed using a Photon Technology International fluorescence spectrometer, and fluorescence spectra were buffer-subtracted and corrected for dilution as previously described (10).
Supplementary Material
Acknowledgments
We thank Dr. Brian Kobilka, Dr. John Williams, and members of the laboratory of D.L.F. (Christopher Schafer and Amber Jones Brunette) for discussions and critical reading of the manuscript. This work was funded, in part, by NIH Training Grant T32 DA007267 (to J.F.F.) and NIH Grants R01 EY015436, R01 GM097433, and S10 RR025684 (to D.L.F.).
Footnotes
The authors declare no conflict of interest.
This article is a PNAS Direct Submission.
This article contains supporting information online at www.pnas.org/lookup/suppl/doi:10.1073/pnas.1500895112/-/DCSupplemental.
References
- 1.Ghanouni P, et al. Functionally different agonists induce distinct conformations in the G protein coupling domain of the beta 2 adrenergic receptor. J Biol Chem. 2001;276(27):24433–24436. doi: 10.1074/jbc.C100162200. [DOI] [PubMed] [Google Scholar]
- 2.Nygaard R, et al. The dynamic process of β(2)-adrenergic receptor activation. Cell. 2013;152(3):532–542. doi: 10.1016/j.cell.2013.01.008. [DOI] [PMC free article] [PubMed] [Google Scholar]
- 3.Kobilka BK, Deupi X. Conformational complexity of G-protein-coupled receptors. Trends Pharmacol Sci. 2007;28(8):397–406. doi: 10.1016/j.tips.2007.06.003. [DOI] [PubMed] [Google Scholar]
- 4.De Lean A, Stadel JM, Lefkowitz RJ. A ternary complex model explains the agonist-specific binding properties of the adenylate cyclase-coupled beta-adrenergic receptor. J Biol Chem. 1980;255(15):7108–7117. [PubMed] [Google Scholar]
- 5.Farrens DL, Altenbach C, Yang K, Hubbell WL, Khorana HG. Requirement of rigid-body motion of transmembrane helices for light activation of rhodopsin. Science. 1996;274(5288):768–770. doi: 10.1126/science.274.5288.768. [DOI] [PubMed] [Google Scholar]
- 6.Janz JM, Farrens DL. Rhodopsin activation exposes a key hydrophobic binding site for the transducin alpha-subunit C terminus. J Biol Chem. 2004;279(28):29767–29773. doi: 10.1074/jbc.M402567200. [DOI] [PubMed] [Google Scholar]
- 7.Rasmussen SG, et al. Crystal structure of the β2 adrenergic receptor-Gs protein complex. Nature. 2011;477(7366):549–555. doi: 10.1038/nature10361. [DOI] [PMC free article] [PubMed] [Google Scholar]
- 8.Scheerer P, et al. Crystal structure of opsin in its G-protein-interacting conformation. Nature. 2008;455(7212):497–502. doi: 10.1038/nature07330. [DOI] [PubMed] [Google Scholar]
- 9.Chung KY, et al. Conformational changes in the G protein Gs induced by the β2 adrenergic receptor. Nature. 2011;477(7366):611–615. doi: 10.1038/nature10488. [DOI] [PMC free article] [PubMed] [Google Scholar]
- 10.Fay JF, Farrens DL. A key agonist-induced conformational change in the cannabinoid receptor CB1 is blocked by the allosteric ligand Org 27569. J Biol Chem. 2012;287(40):33873–33882. doi: 10.1074/jbc.M112.352328. [DOI] [PMC free article] [PubMed] [Google Scholar]
- 11.Tsukamoto H, Farrens DL, Koyanagi M, Terakita A. The magnitude of the light-induced conformational change in different rhodopsins correlates with their ability to activate G proteins. J Biol Chem. 2009;284(31):20676–20683. doi: 10.1074/jbc.M109.016212. [DOI] [PMC free article] [PubMed] [Google Scholar]
- 12.Krishna AG, Menon ST, Terry TJ, Sakmar TP. Evidence that helix 8 of rhodopsin acts as a membrane-dependent conformational switch. Biochemistry. 2002;41(26):8298–8309. doi: 10.1021/bi025534m. [DOI] [PubMed] [Google Scholar]
- 13.Altenbach C, Kusnetzow AK, Ernst OP, Hofmann KP, Hubbell WL. High-resolution distance mapping in rhodopsin reveals the pattern of helix movement due to activation. Proc Natl Acad Sci USA. 2008;105(21):7439–7444. doi: 10.1073/pnas.0802515105. [DOI] [PMC free article] [PubMed] [Google Scholar]
- 14.Liu JJ, Horst R, Katritch V, Stevens RC, Wüthrich K. Biased signaling pathways in β2-adrenergic receptor characterized by 19F-NMR. Science. 2012;335(6072):1106–1110. doi: 10.1126/science.1215802. [DOI] [PMC free article] [PubMed] [Google Scholar]
- 15.Struthers M, Yu H, Oprian DD. G protein-coupled receptor activation: Analysis of a highly constrained, “straitjacketed” rhodopsin. Biochemistry. 2000;39(27):7938–7942. doi: 10.1021/bi000771f. [DOI] [PubMed] [Google Scholar]
- 16.Rahmeh R, et al. Structural insights into biased G protein-coupled receptor signaling revealed by fluorescence spectroscopy. Proc Natl Acad Sci USA. 2012;109(17):6733–6738. doi: 10.1073/pnas.1201093109. [DOI] [PMC free article] [PubMed] [Google Scholar]
- 17.Luttrell LM, Kenakin TP. Refining efficacy: Allosterism and bias in G protein-coupled receptor signaling. Methods Mol Biol. 2011;756:3–35. doi: 10.1007/978-1-61779-160-4_1. [DOI] [PubMed] [Google Scholar]
- 18.May LT, Leach K, Sexton PM, Christopoulos A. Allosteric modulation of G protein-coupled receptors. Annu Rev Pharmacol Toxicol. 2007;47:1–51. doi: 10.1146/annurev.pharmtox.47.120505.105159. [DOI] [PubMed] [Google Scholar]
- 19.Schwartz TW, Holst B. Allosteric enhancers, allosteric agonists and ago-allosteric modulators: Where do they bind and how do they act? Trends Pharmacol Sci. 2007;28(8):366–373. doi: 10.1016/j.tips.2007.06.008. [DOI] [PubMed] [Google Scholar]
- 20.Grunbeck A, et al. Genetically encoded photo-cross-linkers map the binding site of an allosteric drug on a G protein-coupled receptor. ACS Chem Biol. 2012;7(6):967–972. doi: 10.1021/cb300059z. [DOI] [PubMed] [Google Scholar]
- 21.Wootten D, Christopoulos A, Sexton PM. Emerging paradigms in GPCR allostery: Implications for drug discovery. Nat Rev Drug Discov. 2013;12(8):630–644. doi: 10.1038/nrd4052. [DOI] [PubMed] [Google Scholar]
- 22.Price MR, et al. Allosteric modulation of the cannabinoid CB1 receptor. Mol Pharmacol. 2005;68(5):1484–1495. doi: 10.1124/mol.105.016162. [DOI] [PubMed] [Google Scholar]
- 23.Ahn KH, Mahmoud MM, Kendall DA. Allosteric modulator ORG27569 induces CB1 cannabinoid receptor high affinity agonist binding state, receptor internalization, and Gi protein-independent ERK1/2 kinase activation. J Biol Chem. 2012;287(15):12070–12082. doi: 10.1074/jbc.M111.316463. [DOI] [PMC free article] [PubMed] [Google Scholar]
- 24.Ahn KH, Mahmoud MM, Shim JY, Kendall DA. Distinct roles of β-arrestin 1 and β-arrestin 2 in ORG27569-induced biased signaling and internalization of the cannabinoid receptor 1 (CB1) J Biol Chem. 2013;288(14):9790–9800. doi: 10.1074/jbc.M112.438804. [DOI] [PMC free article] [PubMed] [Google Scholar]
- 25.Flores-Otero J, et al. Ligand-specific endocytic dwell times control functional selectivity of the cannabinoid receptor 1. Nat Commun. 2014;5:4589. doi: 10.1038/ncomms5589. [DOI] [PMC free article] [PubMed] [Google Scholar]
- 26.Katritch V, et al. Allosteric sodium in class A GPCR signaling. Trends Biochem Sci. 2014;39(5):233–244. doi: 10.1016/j.tibs.2014.03.002. [DOI] [PMC free article] [PubMed] [Google Scholar]
- 27.Griffin G, Wray EJ, Martin BR, Abood ME. Cannabinoid agonists and antagonists discriminated by receptor binding in rat cerebellum. Br J Pharmacol. 1999;128(3):684–688. doi: 10.1038/sj.bjp.0702806. [DOI] [PMC free article] [PubMed] [Google Scholar]
- 28.Deupi X, et al. Stabilized G protein binding site in the structure of constitutively active metarhodopsin-II. Proc Natl Acad Sci USA. 2012;109(1):119–124. doi: 10.1073/pnas.1114089108. [DOI] [PMC free article] [PubMed] [Google Scholar]
- 29.Han M, Smith SO, Sakmar TP. Constitutive activation of opsin by mutation of methionine 257 on transmembrane helix 6. Biochemistry. 1998;37(22):8253–8261. doi: 10.1021/bi980147r. [DOI] [PubMed] [Google Scholar]
- 30.Schafer CT, Farrens DL. Conformational selection and equilibrium governs the ability of retinals to bind opsin. J Biol Chem. 2015;290(7):4304–4318. doi: 10.1074/jbc.M114.603134. [DOI] [PMC free article] [PubMed] [Google Scholar]
- 31.Warne T, Serrano-Vega MJ, Tate CG, Schertler GF. Development and crystallization of a minimal thermostabilised G protein-coupled receptor. Protein Expr Purif. 2009;65(2):204–213. doi: 10.1016/j.pep.2009.01.014. [DOI] [PubMed] [Google Scholar]
- 32.Li B, et al. Random mutagenesis of the M3 muscarinic acetylcholine receptor expressed in yeast: Identification of second-site mutations that restore function to a coupling-deficient mutant M3 receptor. J Biol Chem. 2005;280(7):5664–5675. doi: 10.1074/jbc.M411623200. [DOI] [PubMed] [Google Scholar]
- 33.Goncalves JA, et al. Highly conserved tyrosine stabilizes the active state of rhodopsin. Proc Natl Acad Sci USA. 2010;107(46):19861–19866. doi: 10.1073/pnas.1009405107. [DOI] [PMC free article] [PubMed] [Google Scholar]
- 34.Niesen MJ, Bhattacharya S, Grisshammer R, Tate CG, Vaidehi N. Thermostabilization of the β1-adrenergic receptor correlates with increased entropy of the inactive state. J Phys Chem B. 2013;117(24):7283–7291. doi: 10.1021/jp403207c. [DOI] [PMC free article] [PubMed] [Google Scholar]
- 35.Kirchberg K, et al. Conformational dynamics of helix 8 in the GPCR rhodopsin controls arrestin activation in the desensitization process. Proc Natl Acad Sci USA. 2011;108(46):18690–18695. doi: 10.1073/pnas.1015461108. [DOI] [PMC free article] [PubMed] [Google Scholar]
- 36.Kruse AC, et al. Activation and allosteric modulation of a muscarinic acetylcholine receptor. Nature. 2013;504(7478):101–106. doi: 10.1038/nature12735. [DOI] [PMC free article] [PubMed] [Google Scholar]
- 37.Hall DA. Modeling the functional effects of allosteric modulators at pharmacological receptors: An extension of the two-state model of receptor activation. Mol Pharmacol. 2000;58(6):1412–1423. doi: 10.1124/mol.58.6.1412. [DOI] [PubMed] [Google Scholar]
- 38.Tsukamoto H, Farrens DL. A constitutively activating mutation alters the dynamics and energetics of a key conformational change in a ligand-free G protein-coupled receptor. J Biol Chem. 2013;288(39):28207–28216. doi: 10.1074/jbc.M113.472464. [DOI] [PMC free article] [PubMed] [Google Scholar]
- 39.Katritch V, Cherezov V, Stevens RC. Diversity and modularity of G protein-coupled receptor structures. Trends Pharmacol Sci. 2012;33(1):17–27. doi: 10.1016/j.tips.2011.09.003. [DOI] [PMC free article] [PubMed] [Google Scholar]
- 40.Deupi X, Kobilka BK. Energy landscapes as a tool to integrate GPCR structure, dynamics, and function. Physiology (Bethesda) 2010;25(5):293–303. doi: 10.1152/physiol.00002.2010. [DOI] [PMC free article] [PubMed] [Google Scholar]
- 41.Okada T, Ernst OP, Palczewski K, Hofmann KP. Activation of rhodopsin: New insights from structural and biochemical studies. Trends Biochem Sci. 2001;26(5):318–324. doi: 10.1016/s0968-0004(01)01799-6. [DOI] [PubMed] [Google Scholar]
- 42.Wacker D, et al. Structural features for functional selectivity at serotonin receptors. Science. 2013;340(6132):615–619. doi: 10.1126/science.1232808. [DOI] [PMC free article] [PubMed] [Google Scholar]
- 43.Baillie GL, et al. CB(1) receptor allosteric modulators display both agonist and signaling pathway specificity. Mol Pharmacol. 2013;83(2):322–338. doi: 10.1124/mol.112.080879. [DOI] [PMC free article] [PubMed] [Google Scholar]
- 44.Shukla AK, et al. Visualization of arrestin recruitment by a G-protein-coupled receptor. Nature. 2014;512(7513):218–222. doi: 10.1038/nature13430. [DOI] [PMC free article] [PubMed] [Google Scholar]
- 45.Cawston EE, et al. Real-time characterization of cannabinoid receptor 1 (CB1 ) allosteric modulators reveals novel mechanism of action. Br J Pharmacol. 2013;170(4):893–907. doi: 10.1111/bph.12329. [DOI] [PMC free article] [PubMed] [Google Scholar]
- 46.Nobles KN, et al. Distinct phosphorylation sites on the β(2)-adrenergic receptor establish a barcode that encodes differential functions of β-arrestin. Sci Signal. 2011;4(185):ra51. doi: 10.1126/scisignal.2001707. [DOI] [PMC free article] [PubMed] [Google Scholar]
- 47.Li L, et al. G protein-coupled receptor kinases of the GRK4 protein subfamily phosphorylate inactive G protein-coupled receptors (GPCRs) J Biol Chem. 2015;290(17):10775–10790. doi: 10.1074/jbc.M115.644773. [DOI] [PMC free article] [PubMed] [Google Scholar]
- 48.Fay JF, Farrens DL. The membrane proximal region of the cannabinoid receptor CB1 N-terminus can allosterically modulate ligand affinity. Biochemistry. 2013;52(46):8286–8294. doi: 10.1021/bi400842k. [DOI] [PMC free article] [PubMed] [Google Scholar]
- 49.Fay JF, Dunham TD, Farrens DL. Cysteine residues in the human cannabinoid receptor: Only C257 and C264 are required for a functional receptor, and steric bulk at C386 impairs antagonist SR141716A binding. Biochemistry. 2005;44(24):8757–8769. doi: 10.1021/bi0472651. [DOI] [PubMed] [Google Scholar]
- 50.Shore DM, et al. Allosteric modulation of a cannabinoid G protein-coupled receptor: Binding site elucidation and relationship to G protein signaling. J Biol Chem. 2014;289(9):5828–5845. doi: 10.1074/jbc.M113.478495. [DOI] [PMC free article] [PubMed] [Google Scholar]