

Significance
Structural transitions in proteins are characterized by the coefficient for intrachain diffusion, D, which determines the transition kinetics and reveals microscopic properties of the interactions governing folding. D has been measured for unfolded proteins and for native folding, but never for misfolding and aggregation, despite the importance of kinetics for driving these processes. We used single-molecule force spectroscopy to observe the misfolding of individual prion protein (PrP) molecules into stable, nonnative dimers. By reconstructing the energy landscape for dimer misfolding, we compared D for misfolding of PrP to that for native folding. Diffusion was 1,000-fold slower for misfolding, reflecting significant additional roughness in the energy landscape and confirming quantitatively the long-held hypothesis that misfolding landscapes are rougher than native landscapes.
Keywords: intrachain diffusion, protein aggregation, prion protein, optical tweezers, single-molecule force spectroscopy
Abstract
The timescale for the microscopic dynamics of proteins during conformational transitions is set by the intrachain diffusion coefficient, D. Despite the central role of protein misfolding and aggregation in many diseases, it has proven challenging to measure D for these processes because of their heterogeneity. We used single-molecule force spectroscopy to overcome these challenges and determine D for misfolding of the prion protein PrP. Observing directly the misfolding of individual dimers into minimal aggregates, we reconstructed the energy landscape governing nonnative structure formation. Remarkably, rather than displaying multiple pathways, as typically expected for aggregation, PrP dimers were funneled into a thermodynamically stable misfolded state along a single pathway containing several intermediates, one of which blocked native folding. Using Kramers’ rate theory, D was found to be 1,000-fold slower for misfolding than for native folding, reflecting local roughening of the misfolding landscape, likely due to increased internal friction. The slow diffusion also led to much longer transit times for barrier crossing, allowing transition paths to be observed directly for the first time to our knowledge. These results open a new window onto the microscopic mechanisms governing protein misfolding.
The formation of intricate 3D structures by proteins is a complex physical process. Such “folding” is typically described in terms of energy landscape theory (1) as a thermally driven diffusive search over an energy landscape in conformational space for the minimum-energy structure. In this picture, whereas the rates at which structural transitions take place are dominated by the presence of energy barriers in the landscape (2), it is the coefficient of diffusion over the landscape, D, that encapsulates the microscopic dynamics of the protein chain, setting the characteristic timescale for molecular motions. Knowledge of D provides insight into the internal friction in the protein chain as it undergoes conformational fluctuations (3) and sets the ultimate speed limit at which changes in structure can take place (4).
Given the fundamental importance of the diffusion coefficient in protein folding, there has been much interest in measuring D under different conditions. Conformational diffusion has been studied extensively in peptides and unfolded proteins (5–10), using fluorescence probes such as fluorophore quenching or Förster resonant energy transfer to measure reconfiguration times. Typically, D ∼107–108 nm2/s was found, although values as low as 105 nm2/s have been reported (10). Because the diffusion coefficient is inversely proportional to friction, measurements of D have been important for investigating the role and origin of internal friction along the folding pathway (6, 9). Possible links between the value of D and aggregation propensity have also been explored in intrinsically disordered proteins (5). However, it has proven challenging to measure the diffusion coefficient during barrier crossing via fluorescence, owing to the very brief transition time for barrier crossing (11).
Recently, an alternate approach using single-molecule force spectroscopy (SMFS), whereby force is applied to induce structural changes in an isolated molecule, has been applied to measure D for barrier crossings (12–15). This approach takes advantage of the powerful ability of force spectroscopy to measure energy landscapes by analyzing the statistics of conformational fluctuations (16), using the landscape profile and rates to recover D from Kramers’ theory (17). The ability to probe barrier crossings opens up the exciting possibility of investigating the microscopic differences between native structure formation and what happens when folding goes awry, producing nonnative structures. Such misfolding is a feature of many diseases, with misfolded proteins characteristically aggregating into insoluble amyloid fibers rich in β-sheets (18). The value of D should be particularly important in misfolding, because the outcome of misfolding and aggregation processes is thought in many cases to be dominated by kinetics (19). Although in silico studies have begun to probe the energy landscapes for protein misfolding and aggregation (20), these landscapes have not yet been reconstructed experimentally. A direct comparison between diffusion in native folding and misfolding of the same protein has therefore not yet been made.
An important challenge in studying misfolding and aggregation is that they are typically very heterogeneous processes, involving various transient species along multiple pathways leading to different types of aggregates (21). Despite recent advances including solving the structures of some native-like aggregation precursor states (22, 23) and small oligomers (24), a full picture of the sequence of molecular events in aggregation remains elusive. Single-molecule assays are well suited to overcome this challenge, through their ability to distinguish and characterize even transient subpopulations with high sensitivity (25). Previous studies have investigated phenomena ranging from transient, metastable misfolding events (26–28) to various stages in the growth of aggregates (29, 30), but complete misfolding pathways leading to stable misfolded states have not yet been elucidated (25).
Here we use SMFS to reconstruct the energy landscape for misfolding of the prion protein PrP and thereby recover D for misfolding. PrP is particularly interesting as a model for investigating protein misfolding, because even though PrP folds rapidly into its native structure (PrPC) under normal conditions (31), it has a stable misfolded form, PrPSc, which can convert PrPC to form more PrPSc, thereby acting as an infectious agent to transmit prion diseases (32). The structure of PrPSc remains unknown, as does the mechanism for conversion of PrPC, although a variety of structural models (33) and mechanisms (32, 34) have been proposed. Previous single-molecule studies of PrP misfolding (35) have characterized properties such as the kinetics of oligomerization (30) and the dependence of aggregation pathways on metal ions (36), suggesting that the conversion of PrP features several phases starting with dimerization, but detailed pathways were not resolved. SMFS measurements of isolated PrP monomers found that they frequently sampled various misfolded conformations, but they were not thermodynamically stable, consistent with the view that misfolded PrP is stable only within aggregates (27).
Because the conversion of PrP may start with dimerization (30, 37), here we have focused on dimers as the smallest form of aggregate. Using optical tweezers to apply tension and thereby unfold and refold single PrP dimers, we found that dimers readily misfold into stable aggregates. A single misfolding pathway was observed and characterized in detail, revealing several exceptional features that set PrP apart from other proteins studied to date. Reconstruction of the energy landscape for dimer misfolding, along with the previously measured landscape for native folding (15), was then used to make the first comparison of D for native folding versus misfolding in the same protein, showing that diffusion is much slower during misfolding than during native folding.
Results
To study PrP misfolding, two hamster PrP molecules were covalently connected end to end, forming a tandem dimer (Fig. S1). Such tandem oligomers have been used previously to study misfolding and aggregation in a variety of proteins (38–40), including PrP (41). Tandem dimers were attached to DNA handles connected to beads held in dual-beam optical tweezers (27), as illustrated (Fig. 1A), and the force was ramped up/down to unfold/refold the molecules repeatedly while measuring their extension, thereby generating force-extension curves (FECs). The folding of two PrP molecules in close contact as tandem dimers was then compared with the folding of isolated monomers.
Fig. S1.

PrP dimer design. (A) PrP dimers were made in two ways: either expressed as a single protein with the two domains connected by a GSG linker (Top), or by covalent linkage of terminal Cys residues by a disulfide bond (Bottom). In each case, DNA handles (blue) were attached to terminal Cys residues. (B) Both types of dimers displayed the same behavior.
Fig. 1.

FECs of PrP dimers reveal stable misfolded states. (A) Individual PrP molecules (Left, monomers; Right, dimers) attached to DNA handles were bound to beads held in optical traps. (B) Unfolding (black) and refolding (red) FECs of PrP monomers showing apparently two-state folding are well fit by WLC models (dashed lines). (C) Unfolding (black) and refolding (red) FECs of PrP dimers show the formation of stable nonnative structures, in contrast to the sequential unfolding of identical domains expected for independently folded native domains (cartoon, Inset).
For isolated monomers, as described previously (27), the force increased monotonically as the DNA handles were stretched until the protein unfolded in a single step around 10 pN (Fig. 1B, black), creating a characteristic “rip” owing to the abrupt extension increase and concomitant force drop as the unfolded protein stretched out under tension. Refolding FECs retraced the same trajectory (Fig. 1C, red). The change in contour length during the transitions, ∆Lc, found by fitting 4,362 FECs to an extensible worm-like chain (WLC) model using Eq. S1 agreed exactly with the result expected for natively structured PrP (42): 34.3 ± 0.4 nm.
For the dimer, two consecutive rips matching those for monomeric PrP would be expected (Fig. 1C, Inset) if each monomeric domain independently formed PrPC, similar to the behavior typically observed in FECs of native folding in other tandem-repeat proteins (43–48). The actual behavior, however, was strikingly different, indicating that neither domain was natively folded. Unfolding FECs (Fig. 1C, black) often displayed one large rip at a force lower than native unfolding (∼8 pN), followed by a shoulder-like region and then a distinctly smaller rip at a force higher than native unfolding (∼13 pN). Refolding FECs retraced the small rip at high force, but not the large rip at lower force, displaying instead a broader shoulder region at 5–10 pN (Fig. 1C, red). Upon repeated unfolding–refolding cycles (Fig. S2), two classes of unfolding behavior were observed, denoted type 1 (Fig. 2A, black) and type 2 (Fig. 2A, blue). Type 2 unfolding FECs did not contain the large rip at low force, matching instead the shape of the refolding FECs. None of the curves showed behavior characteristic of natively folded PrP. The total ∆Lc for type 2 unfolding was 56 ± 3 nm (Fig. 2A, blue), corresponding to ∼170 aa in the misfolded structure, as opposed to 104 for PrPC. In contrast, the total ∆Lc for type 1 unfolding was 81 ± 1 nm (Fig. 2A, black), corresponding to ∼240 aa, indicating that many of the residues unstructured in PrPC were incorporated into the aggregated structure.
Fig. S2.

Repeated unfolding FECs. Two types of unfolding FECs were observed: (A) type 1 and (B) type 2. Multiple curves are shown in each case, measured on the same molecule.
Fig. 2.
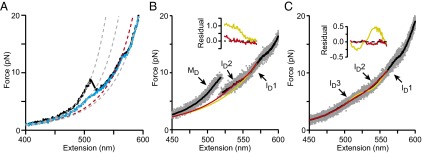
Intermediates on the misfolding pathway of PrP dimers. (A) WLC fits (dashed lines) to representative type 1 (black) and 2 (blue) FECs reveal contour length changes (∆Lc) in the dimer. The total ∆Lc (gray lines) is 56 nm for type 2 and 81 nm for type 1, compared with 34 nm for a single PrPC domain. For both FEC types, an intermediate, ID1 (red), unfolds at ∼13 pN; a “shoulder” with non-WLC behavior at 5–10 pN indicates additional intermediates. (B) The shoulder feature in type 1 FECs was best fit assuming one additional transition (red) corresponding to ID2–ID1 transitions in type 2 FECs, rather than none (yellow), as shown by the residuals (Inset). (C) An average (black) of type 2 FECs (gray) was best fit in the shoulder region by a model assuming two additional transitions in sequence (red) rather than only one (yellow), as shown by the fit residuals (Inset). Unfolding occurred sequentially via three intermediates: ID3, ID2, and ID1.
Such FECs contain all of the information required to reconstruct the misfolding energy landscape for the dimer. We first determined the sequence of states along the misfolding pathway. Multiple rips in the dimer FECs revealed several metastable intermediates, in contrast to two-state folding for native PrP (27). All unfolding and refolding FECs showed a discrete rip near 13 pN with ∆Lc = 15 ± 1 nm (Fig. 2A and Fig. S3); this state was denoted ID1 (first dimer intermediate). FECs also contained a shoulder-like deviation from WLC behavior at 5–10 pN, arising from transitions that were fast compared with the rate at which force and extension were measured (14). Modeling the average curve expected in the shoulder region with Eq. S2, we found that type 1 unfolding curves were well fit assuming one additional intermediate between ID1 and the fully misfolded state, MD, which we denoted ID2 (Fig. 2B). Type 2 unfolding curves required two sequential intermediates to obtain good fits (Fig. 2C); one had the same properties as ID2, and the other was denoted ID3 (Table 1). Type 1 unfolding thus followed the sequence of states MD→ID2→ID1→U (unfolded state), whereas the sequence for type 2 unfolding was ID3→ID2→ID1→U.
Fig. S3.

Fitting the unfolding transition of ID1. Unfolding FECs (gray), here type 2, were averaged (black) and fit over the range 10–20 pN to a model assuming a single unfolding transition, corresponding to ID1 unfolding into U (red).
Table 1.
Structural, kinetic, and energetic parameters of the misfolded dimer and intermediate states
| Parameter | MD | ID3 | ID2 | ID1 |
| ∆Lc to U from WLC fits, nm | 81 ± 1 | 56 ± 3 | — | 15 ± 1 |
| ∆Lc to next state from equilibrium fits, nm | — | 23 ± 1 | 17 ± 2 | 14.4 ± 0.4 |
| F1/2 from equilibrium fits, pN | — | 6.5 ± 0.4 | 8.5 ± 0.4 | 13.1 ± 0.5 |
| ∆G to next state, kcal/mol | 0.5 ± 0.1 | 6 ± 1 | 7 ± 1 | 11 ± 1 |
| log(k0), s−1 | −5 ± 1 | −3.4 ± 0.6 | — | −5.1 ± 0.6 |
| ∆x‡, nm | 8 ± 2 | 7.8 ± 0.7 | — | 5.7 ± 0.7 |
| ∆G‡, kcal/mol | 10 ± 1 | 8.0 ± 0.8 | — | 10.5 ± 0.8 |
| log (D), nm2/s | 3.1 ± 0.6 | 3.1 ± 0.3 | — | 2.9 ± 0.3 |
Refolding FECs retraced the type 2 unfolding curves and almost always ended in ID3, without any observable transition into MD (Fig. S4A). Very rarely, however, complete sequential refolding from U to MD passing through each of the three intermediates was observed (Fig. S4B), indicating that all five states are actually on a single folding pathway. The fact that MD was almost never observed directly during refolding suggests that it must form slowly at low force. Supporting this view, the fraction of curves exhibiting type 1 behavior could be increased by increasing the waiting time at low force between successive pulls (Fig. 3A). All FECs thus represent the same underlying pathway consisting of five sequential states: MD↔ID3↔ID2↔ID1↔U (Fig. 4A). Type 1 FECs do not show evidence for ID3 because it has a lower unfolding force than MD and hence the two states unfold concurrently. Notably, the final step in misfolding (formation of MD) is much slower than native folding, with a rate of 0.5 s−1 compared with ∼104 s−1 for native PrP (15).
Fig. S4.
Analysis of refolding FECs. (A) Typical refolding FECs (red) had behavior identical to that of type 2 unfolding FECs (black). (B) A refolding curve (red) shows complete refolding from U to MD. All intermediate states (cyan: ID1, green: ID2, blue: ID3) are on the pathway to MD (gray). A type 1 unfolding curve is shown for comparison (black). (C) The U to ID1 refolding rates at each force were calculated and fit similarly as for the unfolding data (52), yielding the following parameters: log(k0) = 2.9 ± 0.6 s‒1, ∆x‡ = 0.8 ± 0.6 nm, and ∆G‡ = 0.6 ± 0.6 kcal/mol.
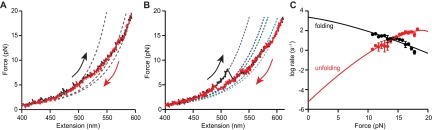
Fig. 3.

Unfolding and refolding kinetics. (A) The fraction of type 1 FECs rose with the waiting time between successive pulls. Red line: single-exponential fit for the ID3–MD transition (0.5 ± 0.2 s−1). (B) Force-dependent unfolding rates for MD (black), ID3 (blue), and ID1 (red) fit to Eq. S2 yield parameters describing the misfolding energy landscape.
Fig. 4.

Pathway and energy landscape for PrP dimer misfolding. (A) The folding pathway for the dimer (red) leads from U to MD sequentially through each intermediate as the force is lowered. The unfolding pathway leads from MD (type 1) or ID3 (type 2) sequentially through each intermediate to U, skipping ID3 in type 1 unfolding because of its low unfolding force. (B) PrP dimer misfolding energy landscape at zero force, reconstructed from FECs. Energy and contour length changes are plotted with respect to MD (error bars: SEM).
After elucidating the steps in the misfolding pathway, the energy landscape underlying the observed behavior was reconstructed from the unfolding forces and kinetics. For U, ID1, ID2, and ID3, the free-energy differences between the states were found from the product of the unfolding forces and extension changes in the quasi-equilibrium transitions, whereas ΔG between MD and ID3 was found from the ratio of the state occupancies at long delay times. As a consistency check, we also found the total free energy change for complete unfolding by integrating the FECs to obtain the distribution of nonequilibrium work done on the molecule and then applying the Jarzysnki equality (49) to determine the free energy, as described previously (50). The result, ∆Gtotal = 23 ± 3 kcal/mol, agreed within error with the sum of the free energy changes for the individual transitions, 24 ± 2 kcal/mol. The locations and heights of the barriers between each state were found from the force-dependent unfolding rates (Fig. 3B), using the kinetic theory of Dudko et al. (51) (Eq. S3). Because discrete unfolding events could not be observed for the rapid transition between ID2 and ID1, the properties of the barrier between these states were not quantified. In the case of ID1, the activation barrier to unfolding was the same within error (1 kcal/mol) as the equilibrium free energy of unfolding (Table 1), implying that there is a minimal barrier to refolding. Such a small barrier for refolding of ID1 was confirmed by analyzing the refolding lifetimes (52) for the transition from U to ID1 (Fig. S4C), which revealed a barrier of only about 1 kcal/mol.
All results from the analysis of the free energy differences and barrier properties (Table 1) were then combined piecewise for the five sequential states observed to reconstruct the energy landscape profile for the dimer misfolding (Fig. 4B). We note that, from this picture, once MD has formed, the barrier to return to the native structure would be very high, ∼25 kcal/mol, because PrPC could be formed only by passing through the unfolded state.
Finally, the diffusion coefficient implied by the barrier-crossing kinetics and landscape profile was determined for each of the three barriers reconstructed in the landscape, namely the transitions MD↔ID3, ID3↔ID2, and ID1↔U, by refitting the force-dependent rates to the theory of Dudko et al. (51) reexpressed with D as an explicit fitting parameter (Eq. S4). Similar values were found for all three barriers: D = 1 × 10³ ± 0.6 nm2/s for unfolding MD, 1 × 10³ ± 0.3 nm2/s for unfolding ID3, and 0.8 × 10³ ± 0.3 nm2/s for unfolding ID1. Because the value of D should be the same for both folding and unfolding, we also calculated D for refolding of ID1; the result was D = 3 × 10³ ± 0.4 nm2/s, consistent within error with the unfolding result, for an average value for ID1 of 1 × 10³ ± 0.3 nm2/s. In all cases, errors were found by bootstrapping analysis (SI Methods). We note that D is exponentially sensitive to the barrier height in Kramers’ theory analyses (17). Agreement between the values obtained for the unfolding and refolding of ID1 is thus a strong test of self-consistency for the analysis, because the barrier heights differ by an order of magnitude between refolding and unfolding.
SI Methods
Sample Preparation.
Dimers of Syrian hamster PrP(91–231)—the protease-resistant fragment of PrPSc—were made either by linking PrP monomers via disulfide bonds between cysteine residues engineered at the termini (73) or by recombinant expression of a single tandem-repeat gene. Monomeric PrP(90–231) was expressed, purified, and refolded as described previously (27). The DNA for the genetic dimer construct with a N-terminal His tag was synthesized (DNA 2.0) and inserted into the pJexpress406 plasmid. The 35-kDa protein was expressed in Escherichia coli C41 (DE3) (Lucigen) and purified similar to the monomer. Briefly, cell pellets were resuspended in lysis buffer (6 M GdnHCl, 50 mM phosphate, 500 mM NaCl, 0.5 mM PMSF, and 20 mM imidazole, pH 7.4) and sonicated for three 10-s intervals. β-Mercaptoethanol and Tween 20 were added to a final concentration of 10 mM and 0.5%, respectively, before the lysate was centrifuged, filtered, and purified by FPLC (GE Healthcare) using an Ni-NTA column (Qiagen) equilibrated with the lysis buffer. The sample was then washed with lysis buffer and eluted with elution buffer (6 M GdnHCl, 50 mM phosphate buffer, and 250 mM imidazole, pH 7.4). Before attaching DNA handles, PrP was reduced with TCEP in a 1:100 molar ratio for 30 min, desalted by spin column (Zeba, Thermo Scientific) to remove excess TCEP, and activated with 2,2′-dithiodipyridine (Sigma-Aldrich). Incompletely activated PrP monomers formed dimers upon reoxidation. Handles were attached to both types of dimers as described previously (27).
The dimers formed from cysteine-labeled monomers could, in principle, contain monomers connected in three different orientations: NC–NC, NC–CN, and CN–NC (where N and C represent the N and C termini). These three topologies should give very distinct folding/unfolding behavior, as the chain topology strongly affects folding (74). In practice, all of the dimer molecules displayed identical folding behavior, indicating that these molecules shared the same topology. The topology of the disulfide-linked dimers was identified by comparison with the folding of a PrP dimer expressed as a single polypeptide chain (thus ensuring the NC–NC topology). The FECs from the recombinant dimer were qualitatively and quantitatively the same as those from the disulfide-linked dimers (Fig. S1B), indicating that they all shared the NC–NC topology.
FEC Measurements and Analysis.
FEC measurements were performed using a dual-trap optical tweezers system custom-built to obtain high resolution and stability (75), under conditions similar to those previously described (15, 27). Briefly, the traps were moved in steps of 1–2 nm at a rate of 50–630 nm/s using electro-optic deflectors. Data were sampled at 20 kHz, filtered online at the Nyquist frequency, and averaged within each step. Trap stiffness, calibrated as described previously, was 0.3 and 0.9 pN/nm.
Contour length changes between states were determined by fitting different parts of each individual FEC with an extensible WLC model as previously described (27):
| [S1] |
where Lp is the persistence length of the polymer, Lc is the contour length, K is the elastic modulus, and kB is the Boltzmann constant. Two WLCs in series, one for the DNA and one for the protein, were used to fit both the pre- and posttransition portions of the FEC. After fitting the pretransition portion (and setting the protein Lc to 0), the posttransition portion was fit holding all parameters constant except for the protein Lc, to determine the change in Lc upon unfolding the protein. For the DNA handles, Lp ∼50 nm, K ∼1,500 pN, and Lc ∼1,000 nm; for the unfolded protein, Lp = 0.65 nm and K = 2,000 pN.
We estimated the number of amino acids, naa, in the misfolded dimer using the relation . Here is the contour length per amino acid, 0.36 nm, and dT is the distance between the termini of the structured part of the protein. In the case of monomeric PrPC, dT = 3.1 nm is known from the NMR structure (42), but no such structural information is available for the misfolded dimer. Assuming slightly larger values of dT ∼4 and 5 nm for type 2 and type 1 unfolding, respectively, the dimer structures involved ∼170 aa for type 2 unfolding and ∼240 aa for type 1.
The shoulder feature at low force in the FECs arises from transitions that are fast compared with the timescale of the data sampling and filtering (14, 76). To fit this feature, we used a model of the average extension and force expected in the case of rapid, equilibrated transitions, assuming two-state behavior (14). The extension of the full construct was described as the sum of the extensions from the handle, the amount of unfolded polypeptide before the transition, and the average extension expected from the transition itself:
| [S2] |
where xH(F) is the extension of the handles (obtained by inverting Eq. S1 for the DNA), xU(F) is the extension of the unstructured portion of the protein, n is the number of structures being unfolded (each assumed to act as a two-state system), Δxi(F) is the extension change upon unfolding the structure at force F (related to ∆Lc via Eq. S1), and the probability that the ith structure is unfolded at force F is . Each transition was thus parameterized by the contour length change (∆Lc) and equilibrium unfolding force (F1/2). We averaged each set of curves (type 1 and 2 unfolding FECs, as well as refolding FECs, which simply retraced the type 2 curves) measured on the same molecule and fit the average to Eq. S2. In all cases, good fits were obtained with n = 1, indicating the presence of one additional intermediate.
Two statistical tests were used to ensure that the model in Eq. S2 with n = 1 was the minimal model required to fit the shoulder feature, following a procedure outlined previously (14). First, a lack-of-fit sum of squares test was used to determine whether the deviation from the simple WLC model was significant. We found that there was indeed a lack of fit for the simple WLC model. In contrast, there was no lack of fit detected by this test for the model with n = 1, indicating no additional intermediates were needed to fit the data adequately. Second, we applied the Wald–Wolfowitz runs test to check whether the residuals from the fits were random. Once again, the simple WLC fit failed the test, indicating systematically nonrandom residuals, whereas the residuals from the model above with n = 1 did not fail the test. The model with n = 1 was thus the minimal model required to fit the low-force shoulder.
Fitting of Force-Dependent Kinetics.
Unfolding-force histograms were converted into force-dependent rates and fit using the theory of Dudko et al. (51) to extract the energy landscape parameters:
| [S3] |
where k0 is the unfolding rate at zero force, Δx‡ is the distance to the transition state from the folded state, ΔG‡ is the energy barrier height from the folded state, and ν parameterizes the shape of the barrier (ν = 2/3 for a linear-cubic potential was assumed). Note that the theory above was derived for a two-state system, obtaining the rate by integrating over the postulated linear-cubic form of the landscape under the assumption of a constant diffusion coefficient (54, 77). In general, this model cannot be applied to multistate systems, because the unfolding forces for transitions that occur late in the FEC may covary with those that occur earlier (78). In the specific case of the PrP dimer, however, this issue does not arise: The MD and ID3 unfolding transitions (Fig. 3B, black and blue) can be isolated because they never occur in the same FEC (they represent different starting points for the FEC measurements), whereas the unfolding force for ID1 (Fig. 3B, red) does not covary with the other transitions, having a Pearson correlation coefficient of 0.1 ± 0.1. As a result, the different barriers in the sequential unfolding can be treated individually with the two-state model.
The refolding rates for the U–ID1 transition at each force were calculated from the refolding force histograms similarly to the unfolding data and fit to the equation analogous to Eq. S3 that describes the force dependence of refolding rates (52).
To obtain the best estimate of D for crossing each barrier in the misfolding landscape, we reexpressed k(F) in Eq. S3 explicitly in terms of D, Δx‡, and ΔG‡, assuming a linear-cubic form of the potential as previously:
| [S4] |
We then fit the force-dependent rates to Eq. S4. The values for Δx‡ and ΔG‡ were the same as those found using Eq. S3; the results in Table 1 represent the average of the two fits.
Roughness in the Landscape.
In the presence of microscopic roughness in the landscape, the mean first passage time looks similar to the result for diffusive motion on a smooth landscape but with a slower diffusion constant, where D is renormalized by the roughness and reduced by a factor of exp[−(ε/kBT)2], for rms roughness ε (54, 55). This approach has been applied to analyze kinetics in the presence of roughness as high as 2–6 kBT (79–81), suggesting that the roughness in the landscape of PrP dimers should not prevent the application of Kramers-type approaches like Eqs. S3 and S4.
Errors in the Kinetic Fit Results.
The random errors on the fitting parameters were estimated by bootstrapping analysis of the fits. The unfolding force distributions for each transition were randomly resampled from the set of measured values, and the resulting distributions were transformed to force-dependent rates and fit as above. Resampling was iterated 100,000 times for each transition to obtain the distribution of resulting fitting values, and the SD of the values was taken as the measure of the uncertainty in each parameter arising from the experimental variability in the measured rates. The robustness of the fitting values was also investigated by holding one of the fit parameters constant and refitting the data while systematically varying that fixed parameter. The lowest fitting error, as reported by χ2, was found in each case when the fixed parameters had the same values that had been returned from free fits, suggesting that the global minimum for χ2 had been found in the original fits.
The primary systematic error in the force-dependent rate measurements that could affect the fitting results arises from systematic error in the force calibration of the optical trap. Based on the values for F1/2 found by different groups measuring the same molecules (82, 83), we estimate that the systematic error in our force calibration is less than 2–3%, so that the random errors dominate. We note, moreover, that the comparison between native folding and misfolding is relatively insensitive against such systematic errors, given that both sets of measurements were made using the same instrument and thus systematic effects generate common-mode errors that affect the results for native folding and misfolding in similar ways.
Transition Time Measurements.
Extension trajectories were measured in equilibrium at constant force near F1/2 for the ID1↔U transition, using a passive force clamp (64) to prevent feedback loop artifacts as described previously (15). Data were sampled at 50 kHz and filtered online at the Nyquist frequency. The trap stiffness was 0.3 pN/nm.
Transitions were identified as the segments of the trajectory in which the extension changed between values characteristic of states U and ID1. The transit time for each individual transition, ttp, was defined as the time required to transit the middle half of the distance between the folded and unfolded states (Δx), as a reasonable estimate of the barrier region between the states. The boundaries for this barrier region were thus defined as x1 = xf + 1/4Δx, and x2 = xu − 1/4Δx (Fig. 5B, dotted lines). To determine ttp, first the trajectory was median-filtered in a 40-μs window, comparable to the time resolution of the instrument (13, 15). Initial estimates of ttp were found by fitting each transition to a logistic function (27)—x(t) = xf/u ± Δx/{1 + exp[−k(t – t0)]}, where k is the steepness of the curve—to reduce the effects of Brownian fluctuations in the trajectory, and measuring the time elapsed between the points where the fit crosses x1 and x2. This initial estimate was then used to determine a time window appropriate for filtering the trajectory in each transition. To ensure that filtering was optimized within each transition to achieve maximal noise reduction without altering the time for the transition, the window was chosen to be 1/2 of the initial ttp estimate, up to a maximum size of 0.5 ms. After filtering, the final ttp value was determined as the time required for the smoothed trajectory to pass between the boundaries x1 and x2.
Fig. 5.

Transition path time measurements. (A) Native folding transitions measured from constant-force trajectories occur faster than the resolution limit of the tweezers, 50 μs. (B) The transition path time for misfolding measured from constant-force trajectories for ID1 folding is much slower. The transit time in each transition, ttp, was measured as the time taken to cross the barrier region defined by the boundaries x1 and x2 (dotted lines). (C) Transitions between U and ID1 were as slow as the millisecond timescale.
The average transition time, τtp, expected for crossing a harmonic barrier is given by (84, 85)
| [S5] |
Here κb is the stiffness of the barrier, γ is Euler’s constant, ΔG‡ > 2 kBT (85), and the expression becomes exact in the limit of large barrier height (84). For the ID1↔U transition, the landscape reconstruction yields ΔG‡ = 4 kBT and κb = 2 ± 0.5 kBT/nm2 at F1/2. Using the average value of D for unfolding and refolding ID1, D = 1 × 10³ ± 0.3 nm/s2, we estimate τtp = 1 × 10⁻³ ± 0.3 s, consistent within error with the measured value.
We note that determining τtp does not depend on the use of any model (unlike the kinetic fitting) or complex analysis—it comes from direct measurements of the time elapsed traveling between two points, an approach that is conceptually very straightforward. The orders-of-magnitude increase in τtp compared with native folding, and the agreement between the diffusion coefficient implied by τtp and the value for D determined from the kinetic fitting (within error), thus provide model-independent confirmation that the results of the kinetic fitting are quantitatively correct and D is greatly reduced in misfolding compared with native folding.
Errors in the Transition Time Results.
Individual transition times for both unfolding and refolding had a broad range of values, from about 20 μs to 2 ms. The random error on the mean transition time, τtp, was found by bootstrap analysis to be 0.02 ms. However, this value underestimates the error in τtp: A larger source of error is the choice of boundaries x1 and x2, because changing the distance between these boundaries will change the time required to cross between them. Given that it is unlikely that the barrier region is very much smaller or larger than 1/2 of the distance between the two states, we estimated that the uncertainty in the boundary positions introduced an error of ±20%, or ±0.1 ms.
CD Spectra.
CD spectra were collected using a Jasco J-810 spectropolarimeter. Samples were measured at concentrations from 0.1 to 55 μM over path lengths of 0.1, 1, and 2 mm. Monomeric PrP was measured in 10 mM sodium phosphate pH 7.0 and 10 mM sodium acetate pH 4.0. Dimeric PrP aggregated rapidly in 10 mM sodium phosphate pH 7.0, and hence this buffer could not be used for CD spectra. Dimeric PrP was measured in 10 mM sodium acetate pH 4.0, and then at neutral pH by titrating the sample from pH 4.0 to pH 7 using sodium hydroxide and immediately recording spectra. Background spectra of the buffers only were subtracted and the sample spectra converted to units of mean residue ellipticity.
Discussion
A central result of this analysis is that the diffusion coefficients found for misfolding transitions are significantly lower than the values found previously for unfolded proteins and peptides, by four to five orders of magnitude (5–10). More importantly, diffusion during misfolding of PrP is also significantly slower than diffusion during native folding. We previously reconstructed the landscape for native folding of PrP from SMFS measurements and used it to derive D by an analysis similar to that described above (15). For native folding, we found D = 1 × 10⁶ ± 0.4 nm2/s, indicating that diffusion during misfolding is about 1,000-fold slower than in native folding of the same protein.
Changes in D are often interpreted as arising from changes in the friction experienced by the protein chain, because D = kBT/γ, where γ is the friction coefficient; γ may consist of friction from the viscous solvent or “internal” friction within the protein chain (53). Because both native folding and misfolding of PrP were measured under identical solvent conditions, the change in D most likely arises from differences in internal friction. Such friction is often modeled as additional roughness in the energy landscape: assuming a random roughness distribution along the 1D landscape profile, D is reduced by a factor of exp[−(ε/kBT)2], where ε is the rms roughness (54, 55). The observed 1,000-fold reduction in D for misfolding compared with native folding would in this picture reflect an additional 3 kBT of roughness along the misfolding pathway.
Additional roughness like this indicates the presence of localized traps and barriers, presumably arising from a tendency to form many nonproductive or locally frustrated interactions while the protein is misfolding, interactions which, in contrast, are normally avoided during native folding. This picture agrees well with the notion that landscapes for native folding are expected to be smooth and minimally frustrated, owing to evolutionary selection for rapid, reliable folding into native structures, whereas the landscapes for proteins that are not subject to such evolutionary pressure are expected to exhibit more frustration, whether locally (resulting in higher roughness) or globally (resulting in a “flat” landscape that does not funnel the protein to a native, minimum-energy state) (56). Random-sequence polypeptides and artificially designed proteins have indeed been found both by experiment (57) and simulation (58) to exhibit a greater prevalence of mutually exclusive competing interactions frustrating the folding, compared with naturally evolved natively folded proteins. It has generally been presumed that nonnative structure formation also involves unusually rough landscapes (21), owing similarly to the lack of selective pressure to reduce frustration, but until now this picture has not been verified experimentally by quantifying the difference in roughness between misfolding and native folding for the same protein.
We note that our analysis is based implicitly on Kramers’ widely used theory of diffusive barrier crossing, wherein the diffusion coefficient is approximated as constant (2, 59). In fact, owing to the effects of projecting the full multidimensional energy landscape onto a one-dimensional reaction coordinate, in theory D is expected to vary with position (59–61). Although the position dependence of D is challenging to measure experimentally, current evidence suggests that the variation in D is less than an order of magnitude (6, 62, 63), far too small to account for the large difference between native and misfolded PrP. To verify that the constant-D approximation was indeed reasonable, we examined the average transit time, τtp, required to cross the barrier during the misfolding: τtp is a sensitive probe of D that is, in contrast, insensitive to the barrier height, and moreover can be measured directly without assumptions about the form of D (11, 17).
The ID1↔U transition was measured in equilibrium using a passive force clamp (64) to keep the force near F1/2, and segments of the trajectory containing the transitions between ID1 and U were extracted similarly to previous work (27) on transitions during native folding of PrP (Fig. 5A). The transition time was measured directly from the trajectory segments, as the time required to traverse the middle half of the distance between ID1 and U (Fig. 5B). Whereas τtp was found from energy landscape analysis of native folding to be 2 μs, faster than the 50-μs time resolution of the instrument (13, 15), the ID1↔U transition time was much slower, with many transitions occurring on the millisecond timescale—slow enough that individual transition paths themselves could be clearly resolved (Fig. 5 B and C). Averaging over 1,500 transitions, we found τtp = 0.5 ± 0.1 ms for unfolding and 0.5 ± 0.1 ms for refolding, roughly 300 times longer than for native folding and thus reflecting an orders-of-magnitude increase in D. For comparison, the value for τtp can be predicted from the result for D using Eq. S5, assuming a harmonic barrier with constant D. The result, τtp = 1 × 100 ± 0.3 ms, is fully consistent with the directly measured value, confirming the robustness of the landscape analysis above.
Looking beyond the diffusion coefficient, analysis of the misfolding pathway revealed several exceptional features that contrast PrP with other proteins studied to date. Surprisingly, PrP dimers misfolded remarkably easily, invariably following a single pathway leading to the same state. Such homogeneous misfolding contrasts sharply with the heterogeneity seen in SMFS studies of dimers of other aggregation-prone proteins, such as α-synuclein (39) and Aβ (65). The high rate of misfolding also differs starkly from most previous single-molecule studies of tandem-repeat proteins, where misfolding—if it was observed at all—occurred at much lower levels, for example, 2–5% of the time for titin I27 domain repeats (66, 67), 4% for tenascin FN III repeats (67), 3–8% for spectrin repeats (68), and 15–30% for α-synuclein repeats (39). Another key difference from these other proteins, as well as from monomeric PrP (27), concerns the stability of the misfolded states: Whereas in previous studies the misfolded states were only metastable, eventually converting back to the native structure [whether rapidly (27) or slowly (66, 67)], our results show the misfolded PrP dimer to be thermodynamically stable (24 ± 2 kcal/mol for MD versus 11 ± 1 kcal/mol per native monomer). These features suggest that PrP may be particularly predisposed to conversion into specific misfolded structures through intermolecular interactions. Indeed, PrP dimer misfolding looks remarkably like the native folding of a protein that has evolved to have a well-funneled, minimally frustrated landscape (56), without the heterogeneous pathways expected for aggregation (21). The primary sign that nonnative interactions are involved is the strikingly slow diffusion coefficient.
We note that the stability of MD cannot alone explain the exclusively misfolded behavior, because the small energy difference between MD and PrPC (∼2 kcal/mol) should lead to an equilibrium PrPC population of ∼4% in the dimer. Hence, there must also be some kinetic selection for misfolding. This observation suggests a mechanism for the misfolding: The intermediate ID1, which forms at a higher force than does PrPC, prevents the formation of PrPC in either domain, thereby promoting misfolding. Indeed, because ID1 does not form in monomeric PrP (27), it must involve interactions between C-terminal residues in one domain of the dimer and N-terminal residues of the other (Fig. S5), which then form an interdomain nucleus for the misfolding. From the 15-nm contour length change upon unfolding, we estimate that ID1 consists of ∼50 aa. It thus almost certainly encompasses the region spanning the link between the two domains (i.e., the C-terminal residues of the first domain and the N-terminal residues of the second domain).
Fig. S5.

Model of intermediate state ID1. The secondary structure of PrPC is mapped onto the dimer as it would occur if each domain folded natively. The intermediate ID1 guides the dimer down the misfolding pathway by helping prevent native structure formation. Because ID1 does not form in monomeric PrP, it likely spans the region between the two natively structured domains (dashed box).
Finally, it is interesting to speculate as to the structure of the misfolded dimer. CD spectra revealed a substantial conversion from primarily helices in the monomer (Fig. S6, black) to primarily β-strands in the dimer (Fig. S6, red). Conversion to a soluble, β-rich form, induced by low pH and/or mildly denaturing conditions, has been studied previously as a potential intermediate step in PrPSc formation (69, 70). Here, however, low pH is not required: β-rich structures are seen both at pH 4 and neutral pH. At the ensemble level, the PrP dimer forms an oligomer that rapidly precipitates under conditions of pH and ionic strength like those used during the SMFS measurements, similar to previous reports (41). It is possible that the individual misfolded dimers undergo additional restructuring upon oligomerization; nevertheless, the single-molecule misfolded form is likely rich in β-strands, serving as the precursor to the bulk oligomers. The low dimer helical content is consistent with models of PrP aggregates (33) in which the helical C terminus of PrPC is converted to β-strands—in contrast to those positing the retention of significant C-terminal helical content—as well as with single-molecule fluorescence results finding β-rich dimers as the first step in PrP aggregation (30). Suggestively, PrP dimers were proposed to play a role in the conversion of PrPC to PrPSc (37) and synthetic dimers have been shown to be neurotoxic both in culture and in mouse models (41). Synthetic dimers have also been used effectively as immunogens to elicit antiprion antibodies to reduce PrPSc formation (71). However, the relevance of the species observed at the single-molecule level to disease remains to be established in future work.
Fig. S6.

CD spectrum of PrP dimers. CD spectrum of recombinant dimers (red) shows an increased β-sheet content (11% helices and 35% sheets) compared with the spectrum of monomeric PrPC (black, 43% helices and 13% sheets).
Despite the complexity of protein misfolding and aggregation, these results show that the energy landscape can be resolved in the single-molecule limit and used to probe crucial properties such as the diffusion coefficient setting the timescale for microscopic motions. This work opens the possibility of investigating the fundamental biophysical factors driving structural outcomes in misfolding and aggregation.
Methods
Sample Preparation.
Dimers of Syrian hamster PrP(91–231) were made either by linking PrP monomers via disulfide bonds between cysteine residues engineered at the termini or by recombinant expression of a single tandem-repeat gene. See SI Methods for complete details.
FEC Measurements and Analysis.
FECs were measured with dual-trap optical tweezers as described (15, 27). ∆Lc values were found by fitting the different branches of the FECs to extensible WLC models (Eq. S1) for the DNA handles and unfolded protein (27). The shoulder feature at low force was fit using a model of the average extension and force expected in the case of rapid, equilibrated transitions assuming two-state behavior (Eq. S2). Unfolding-force histograms were converted into force-dependent rates and fit using Eq. S3, yielding the unfolding rate at zero force, k0, the distance to the transition state from the folded state, Δx‡, and the energy barrier height, ΔG‡ (51). See SI Methods for complete details.
Energy Landscape Parameters.
ΔG between U, ID1, ID2, and ID3 was found from the unfolding forces and extension changes during the quasi-equilibrium transitions: ΔG = Δx(F1/2)·F1/2 − ΔGstretch, where ΔGstretch is the energy for stretching the unfolded protein to F1/2, found by integrating the WLC model for the protein alone. ΔG between MD and ID3 was found from the ratio of the state occupancies at long delay times: ΔG = kBTln(MD/ID3). ΔGtotal for complete unfolding was also found from the Jarzynski equality: ΔGtotal = −kBTln〈exp(−W/kBT)〉− ∆Gstretch, where W is the irreversible work done to unfold the entire protein found by integrating the FECs, ∆Gstretch is the reversible stretching energy of the handles and unfolded protein, and the finite sampling bias was corrected (72). Barrier heights and positions were found from the kinetic fits described above. The combination of methods used to reconstruct the energy landscape is illustrated in Fig. S7.
Fig. S7.
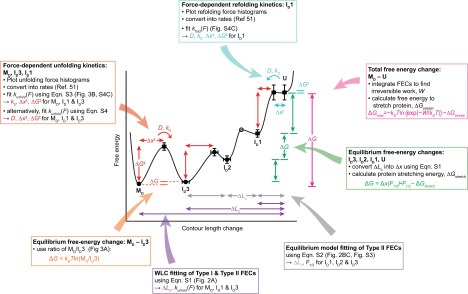
Method for reconstructing the misfolding energy landscape. The analysis methods used to determine different features of the landscape are illustrated. Some information (e.g., length changes between states and total free energy change) was obtained independently from different methods.
Diffusion Coefficient.
D was found for each barrier by fitting the force-dependent rates to Eq. S4. See SI Methods for complete details.
Supplementary Material
Acknowledgments
This work was supported by funds from PrioNet Canada, Alberta Prion Research Institute, Alberta Innovates (AI) Technology Futures, AI Health Solutions, Natural Sciences and Engineering Research Council, and the National Institute for Nanotechnology.
Footnotes
The authors declare no conflict of interest.
This article is a PNAS Direct Submission.
This article contains supporting information online at www.pnas.org/lookup/suppl/doi:10.1073/pnas.1419197112/-/DCSupplemental.
References
- 1.Dill KA, MacCallum JL. The protein-folding problem, 50 years on. Science. 2012;338(6110):1042–1046. doi: 10.1126/science.1219021. [DOI] [PubMed] [Google Scholar]
- 2.Hanggi P, Talkner P, Borkovec M. Reaction-rate theory - 50 years after Kramers. Rev Mod Phys. 1990;62(2):251–341. [Google Scholar]
- 3.Hagen SJ. Solvent viscosity and friction in protein folding dynamics. Curr Protein Pept Sci. 2010;11(5):385–395. doi: 10.2174/138920310791330596. [DOI] [PubMed] [Google Scholar]
- 4.Kubelka J, Hofrichter J, Eaton WA. The protein folding ‘speed limit’. Curr Opin Struct Biol. 2004;14(1):76–88. doi: 10.1016/j.sbi.2004.01.013. [DOI] [PubMed] [Google Scholar]
- 5.Ahmad B, Chen Y, Lapidus LJ. Aggregation of α-synuclein is kinetically controlled by intramolecular diffusion. Proc Natl Acad Sci USA. 2012;109(7):2336–2341. doi: 10.1073/pnas.1109526109. [DOI] [PMC free article] [PubMed] [Google Scholar]
- 6.Borgia A, et al. Localizing internal friction along the reaction coordinate of protein folding by combining ensemble and single-molecule fluorescence spectroscopy. Nat Commun. 2012;3:1195. doi: 10.1038/ncomms2204. [DOI] [PMC free article] [PubMed] [Google Scholar]
- 7.Hagen SJ, Hofrichter J, Szabo A, Eaton WA. Diffusion-limited contact formation in unfolded cytochrome c: Estimating the maximum rate of protein folding. Proc Natl Acad Sci USA. 1996;93(21):11615–11617. doi: 10.1073/pnas.93.21.11615. [DOI] [PMC free article] [PubMed] [Google Scholar]
- 8.Möglich A, Joder K, Kiefhaber T. End-to-end distance distributions and intrachain diffusion constants in unfolded polypeptide chains indicate intramolecular hydrogen bond formation. Proc Natl Acad Sci USA. 2006;103(33):12394–12399. doi: 10.1073/pnas.0604748103. [DOI] [PMC free article] [PubMed] [Google Scholar]
- 9.Soranno A, et al. Quantifying internal friction in unfolded and intrinsically disordered proteins with single-molecule spectroscopy. Proc Natl Acad Sci USA. 2012;109(44):17800–17806. doi: 10.1073/pnas.1117368109. [DOI] [PMC free article] [PubMed] [Google Scholar]
- 10.Waldauer SA, Bakajin O, Lapidus LJ. Extremely slow intramolecular diffusion in unfolded protein L. Proc Natl Acad Sci USA. 2010;107(31):13713–13717. doi: 10.1073/pnas.1005415107. [DOI] [PMC free article] [PubMed] [Google Scholar]
- 11.Chung HS, Eaton WA. Single-molecule fluorescence probes dynamics of barrier crossing. Nature. 2013;502(7473):685–688. doi: 10.1038/nature12649. [DOI] [PMC free article] [PubMed] [Google Scholar]
- 12.Lannon H, Haghpanah JS, Montclare JK, Vanden-Eijnden E, Brujic J. Force-clamp experiments reveal the free-energy profile and diffusion coefficient of the collapse of protein molecules. Phys Rev Lett. 2013;110(12):128301. doi: 10.1103/PhysRevLett.110.128301. [DOI] [PubMed] [Google Scholar]
- 13.Neupane K, et al. Transition path times for nucleic acid folding determined from energy-landscape analysis of single-molecule trajectories. Phys Rev Lett. 2012;109(6):068102. doi: 10.1103/PhysRevLett.109.068102. [DOI] [PubMed] [Google Scholar]
- 14.Solanki A, Neupane K, Woodside MT. Single-molecule force spectroscopy of rapidly fluctuating, marginally stable structures in the intrinsically disordered protein α-synuclein. Phys Rev Lett. 2014;112(15):158103. doi: 10.1103/PhysRevLett.112.158103. [DOI] [PubMed] [Google Scholar]
- 15.Yu H, et al. Energy landscape analysis of native folding of the prion protein yields the diffusion constant, transition path time, and rates. Proc Natl Acad Sci USA. 2012;109(36):14452–14457. doi: 10.1073/pnas.1206190109. [DOI] [PMC free article] [PubMed] [Google Scholar]
- 16.Woodside MT, Block SM. Reconstructing folding energy landscapes by single-molecule force spectroscopy. Annu Rev Biophys. 2014;43:19–39. doi: 10.1146/annurev-biophys-051013-022754. [DOI] [PMC free article] [PubMed] [Google Scholar]
- 17.Woodside MT, Lambert J, Beach KSD. Determining intrachain diffusion coefficients for biopolymer dynamics from single-molecule force spectroscopy measurements. Biophys J. 2014;107(7):1647–1653. doi: 10.1016/j.bpj.2014.08.007. [DOI] [PMC free article] [PubMed] [Google Scholar]
- 18.Chiti F, Dobson CM. Protein misfolding, functional amyloid, and human disease. Annu Rev Biochem. 2006;75:333–366. doi: 10.1146/annurev.biochem.75.101304.123901. [DOI] [PubMed] [Google Scholar]
- 19.Johnson SM, et al. Native state kinetic stabilization as a strategy to ameliorate protein misfolding diseases: A focus on the transthyretin amyloidoses. Acc Chem Res. 2005;38(12):911–921. doi: 10.1021/ar020073i. [DOI] [PubMed] [Google Scholar]
- 20.Zheng W, Schafer NP, Wolynes PG. Free energy landscapes for initiation and branching of protein aggregation. Proc Natl Acad Sci USA. 2013;110(51):20515–20520. doi: 10.1073/pnas.1320483110. [DOI] [PMC free article] [PubMed] [Google Scholar]
- 21.Jahn TR, Radford SE. Folding versus aggregation: Polypeptide conformations on competing pathways. Arch Biochem Biophys. 2008;469(1):100–117. doi: 10.1016/j.abb.2007.05.015. [DOI] [PMC free article] [PubMed] [Google Scholar]
- 22.Eichner T, Kalverda AP, Thompson GS, Homans SW, Radford SE. Conformational conversion during amyloid formation at atomic resolution. Mol Cell. 2011;41(2):161–172. doi: 10.1016/j.molcel.2010.11.028. [DOI] [PMC free article] [PubMed] [Google Scholar]
- 23.Neudecker P, et al. Structure of an intermediate state in protein folding and aggregation. Science. 2012;336(6079):362–366. doi: 10.1126/science.1214203. [DOI] [PubMed] [Google Scholar]
- 24.Laganowsky A, et al. Atomic view of a toxic amyloid small oligomer. Science. 2012;335(6073):1228–1231. doi: 10.1126/science.1213151. [DOI] [PMC free article] [PubMed] [Google Scholar]
- 25.Hoffmann A, Neupane K, Woodside MT. Single-molecule assays for investigating protein misfolding and aggregation. Phys Chem Chem Phys. 2013;15(21):7934–7948. doi: 10.1039/c3cp44564j. [DOI] [PubMed] [Google Scholar]
- 26.Stigler J, Ziegler F, Gieseke A, Gebhardt JC, Rief M. The complex folding network of single calmodulin molecules. Science. 2011;334(6055):512–516. doi: 10.1126/science.1207598. [DOI] [PubMed] [Google Scholar]
- 27.Yu H, et al. Direct observation of multiple misfolding pathways in a single prion protein molecule. Proc Natl Acad Sci USA. 2012;109(14):5283–5288. doi: 10.1073/pnas.1107736109. [DOI] [PMC free article] [PubMed] [Google Scholar]
- 28.Heidarsson PO, et al. Direct single-molecule observation of calcium-dependent misfolding in human neuronal calcium sensor-1. Proc Natl Acad Sci USA. 2014;111(36):13069–13074. doi: 10.1073/pnas.1401065111. [DOI] [PMC free article] [PubMed] [Google Scholar]
- 29.Cremades N, et al. Direct observation of the interconversion of normal and toxic forms of α-synuclein. Cell. 2012;149(5):1048–1059. doi: 10.1016/j.cell.2012.03.037. [DOI] [PMC free article] [PubMed] [Google Scholar]
- 30.Post K, et al. Rapid acquisition of beta-sheet structure in the prion protein prior to multimer formation. Biol Chem. 1998;379(11):1307–1317. doi: 10.1515/bchm.1998.379.11.1307. [DOI] [PubMed] [Google Scholar]
- 31.Wildegger G, Liemann S, Glockshuber R. Extremely rapid folding of the C-terminal domain of the prion protein without kinetic intermediates. Nat Struct Biol. 1999;6(6):550–553. doi: 10.1038/9323. [DOI] [PubMed] [Google Scholar]
- 32.Colby DW, Prusiner SB. Prions. Cold Spring Harb Perspect Biol. 2011;3(1):a006833. doi: 10.1101/cshperspect.a006833. [DOI] [PMC free article] [PubMed] [Google Scholar]
- 33.Diaz-Espinoza R, Soto C. High-resolution structure of infectious prion protein: the final frontier. Nat Struct Mol Biol. 2012;19(4):370–377. doi: 10.1038/nsmb.2266. [DOI] [PMC free article] [PubMed] [Google Scholar]
- 34.Cobb NJ, Sönnichsen FD, McHaourab H, Surewicz WK. Molecular architecture of human prion protein amyloid: a parallel, in-register beta-structure. Proc Natl Acad Sci USA. 2007;104(48):18946–18951. doi: 10.1073/pnas.0706522104. [DOI] [PMC free article] [PubMed] [Google Scholar]
- 35.Yu H, Dee DR, Woodside MT. Single-molecule approaches to prion protein misfolding. Prion. 2013;7(2):140–146. doi: 10.4161/pri.23303. [DOI] [PMC free article] [PubMed] [Google Scholar]
- 36.Levin J, Bertsch U, Kretzschmar H, Giese A. Single particle analysis of manganese-induced prion protein aggregates. Biochem Biophys Res Commun. 2005;329(4):1200–1207. doi: 10.1016/j.bbrc.2005.02.094. [DOI] [PubMed] [Google Scholar]
- 37.Tompa P, Tusnády GE, Friedrich P, Simon I. The role of dimerization in prion replication. Biophys J. 2002;82(4):1711–1718. doi: 10.1016/S0006-3495(02)75523-9. [DOI] [PMC free article] [PubMed] [Google Scholar]
- 38.Bader R, Bamford R, Zurdo J, Luisi BF, Dobson CM. Probing the mechanism of amyloidogenesis through a tandem repeat of the PI3-SH3 domain suggests a generic model for protein aggregation and fibril formation. J Mol Biol. 2006;356(1):189–208. doi: 10.1016/j.jmb.2005.11.034. [DOI] [PubMed] [Google Scholar]
- 39.Neupane K, Solanki A, Sosova I, Belov M, Woodside MT. Diverse metastable structures formed by small oligomers of α-synuclein probed by force spectroscopy. PLoS ONE. 2014;9(1):e86495. doi: 10.1371/journal.pone.0086495. [DOI] [PMC free article] [PubMed] [Google Scholar]
- 40.Speretta E, et al. Expression in drosophila of tandem amyloid β peptides provides insights into links between aggregation and neurotoxicity. J Biol Chem. 2012;287(24):20748–20754. doi: 10.1074/jbc.M112.350124. [DOI] [PMC free article] [PubMed] [Google Scholar]
- 41.Simoneau S, et al. In vitro and in vivo neurotoxicity of prion protein oligomers. PLoS Pathog. 2007;3(8):e125. doi: 10.1371/journal.ppat.0030125. [DOI] [PMC free article] [PubMed] [Google Scholar]
- 42.James TL, et al. Solution structure of a 142-residue recombinant prion protein corresponding to the infectious fragment of the scrapie isoform. Proc Natl Acad Sci USA. 1997;94(19):10086–10091. doi: 10.1073/pnas.94.19.10086. [DOI] [PMC free article] [PubMed] [Google Scholar]
- 43.Cao Y, Li H. Polyprotein of GB1 is an ideal artificial elastomeric protein. Nat Mater. 2007;6(2):109–114. doi: 10.1038/nmat1825. [DOI] [PubMed] [Google Scholar]
- 44.Carrion-Vazquez M, et al. The mechanical stability of ubiquitin is linkage dependent. Nat Struct Biol. 2003;10(9):738–743. doi: 10.1038/nsb965. [DOI] [PubMed] [Google Scholar]
- 45.Dietz H, Berkemeier F, Bertz M, Rief M. Anisotropic deformation response of single protein molecules. Proc Natl Acad Sci USA. 2006;103(34):12724–12728. doi: 10.1073/pnas.0602995103. [DOI] [PMC free article] [PubMed] [Google Scholar]
- 46.Jollymore A, Lethias C, Peng Q, Cao Y, Li H. Nanomechanical properties of tenascin-X revealed by single-molecule force spectroscopy. J Mol Biol. 2009;385(4):1277–1286. doi: 10.1016/j.jmb.2008.11.038. [DOI] [PubMed] [Google Scholar]
- 47.Rief M, Pascual J, Saraste M, Gaub HE. Single molecule force spectroscopy of spectrin repeats: Low unfolding forces in helix bundles. J Mol Biol. 1999;286(2):553–561. doi: 10.1006/jmbi.1998.2466. [DOI] [PubMed] [Google Scholar]
- 48.Rief M, Gautel M, Oesterhelt F, Fernandez JM, Gaub HE. Reversible unfolding of individual titin immunoglobulin domains by AFM. Science. 1997;276(5315):1109–1112. doi: 10.1126/science.276.5315.1109. [DOI] [PubMed] [Google Scholar]
- 49.Jarzynski C. Nonequilibrium equality for free energy differences. Phys Rev Lett. 1997;78:2690–2693. [Google Scholar]
- 50.Greenleaf WJ, Frieda KL, Foster DA, Woodside MT, Block SM. Direct observation of hierarchical folding in single riboswitch aptamers. Science. 2008;319(5863):630–633. doi: 10.1126/science.1151298. [DOI] [PMC free article] [PubMed] [Google Scholar]
- 51.Dudko OK, Hummer G, Szabo A. Theory, analysis, and interpretation of single-molecule force spectroscopy experiments. Proc Natl Acad Sci USA. 2008;105(41):15755–15760. doi: 10.1073/pnas.0806085105. [DOI] [PMC free article] [PubMed] [Google Scholar]
- 52.Pierse CA, Dudko OK. Kinetics and energetics of biomolecular folding and binding. Biophys J. 2013;105(9):L19–L22. doi: 10.1016/j.bpj.2013.09.023. [DOI] [PMC free article] [PubMed] [Google Scholar]
- 53.Ansari A, Jones CM, Henry ER, Hofrichter J, Eaton WA. The role of solvent viscosity in the dynamics of protein conformational changes. Science. 1992;256(5065):1796–1798. doi: 10.1126/science.1615323. [DOI] [PubMed] [Google Scholar]
- 54.Bryngelson JD, Wolynes PG. Intermediates and barrier crossing in a random energy-model (with applications to protein folding) J Phys Chem. 1989;93(19):6902–6915. [Google Scholar]
- 55.Zwanzig R. Diffusion in a rough potential. Proc Natl Acad Sci USA. 1988;85(7):2029–2030. doi: 10.1073/pnas.85.7.2029. [DOI] [PMC free article] [PubMed] [Google Scholar]
- 56.Onuchic JN, Wolynes PG. Theory of protein folding. Curr Opin Struct Biol. 2004;14(1):70–75. doi: 10.1016/j.sbi.2004.01.009. [DOI] [PubMed] [Google Scholar]
- 57.Scalley-Kim M, Baker D. Characterization of the folding energy landscapes of computer generated proteins suggests high folding free energy barriers and cooperativity may be consequences of natural selection. J Mol Biol. 2004;338(3):573–583. doi: 10.1016/j.jmb.2004.02.055. [DOI] [PubMed] [Google Scholar]
- 58.Truong HH, Kim BL, Schafer NP, Wolynes PG. Funneling and frustration in the energy landscapes of some designed and simplified proteins. J Chem Phys. 2013;139(12):121908. doi: 10.1063/1.4813504. [DOI] [PMC free article] [PubMed] [Google Scholar]
- 59.Best RB, Hummer G. Coordinate-dependent diffusion in protein folding. Proc Natl Acad Sci USA. 2010;107(3):1088–1093. doi: 10.1073/pnas.0910390107. [DOI] [PMC free article] [PubMed] [Google Scholar]
- 60.Chahine J, Oliveira RJ, Leite VB, Wang J. Configuration-dependent diffusion can shift the kinetic transition state and barrier height of protein folding. Proc Natl Acad Sci USA. 2007;104(37):14646–14651. doi: 10.1073/pnas.0606506104. [DOI] [PMC free article] [PubMed] [Google Scholar]
- 61.Oliveira RJ, Whitford PC, Chahine J, Leite VB, Wang J. Coordinate and time-dependent diffusion dynamics in protein folding. Methods. 2010;52(1):91–98. doi: 10.1016/j.ymeth.2010.04.016. [DOI] [PubMed] [Google Scholar]
- 62.Best RB, Hummer G. Diffusive model of protein folding dynamics with Kramers turnover in rate. Phys Rev Lett. 2006;96(22):228104. doi: 10.1103/PhysRevLett.96.228104. [DOI] [PubMed] [Google Scholar]
- 63.Cellmer T, Henry ER, Hofrichter J, Eaton WA. Measuring internal friction of an ultrafast-folding protein. Proc Natl Acad Sci USA. 2008;105(47):18320–18325. doi: 10.1073/pnas.0806154105. [DOI] [PMC free article] [PubMed] [Google Scholar]
- 64.Greenleaf WJ, Woodside MT, Abbondanzieri EA, Block SM. Passive all-optical force clamp for high-resolution laser trapping. Phys Rev Lett. 2005;95(20):208102. doi: 10.1103/PhysRevLett.95.208102. [DOI] [PMC free article] [PubMed] [Google Scholar]
- 65.Kim BH, et al. Single-molecule atomic force microscopy force spectroscopy study of Aβ-40 interactions. Biochemistry. 2011;50(23):5154–5162. doi: 10.1021/bi200147a. [DOI] [PMC free article] [PubMed] [Google Scholar]
- 66.Borgia MB, et al. Single-molecule fluorescence reveals sequence-specific misfolding in multidomain proteins. Nature. 2011;474(7353):662–665. doi: 10.1038/nature10099. [DOI] [PMC free article] [PubMed] [Google Scholar]
- 67.Oberhauser AF, Marszalek PE, Carrion-Vazquez M, Fernandez JM. Single protein misfolding events captured by atomic force microscopy. Nat Struct Biol. 1999;6(11):1025–1028. doi: 10.1038/14907. [DOI] [PubMed] [Google Scholar]
- 68.Randles LG, Rounsevell RW, Clarke J. Spectrin domains lose cooperativity in forced unfolding. Biophys J. 2007;92(2):571–577. doi: 10.1529/biophysj.106.093690. [DOI] [PMC free article] [PubMed] [Google Scholar]
- 69.Baskakov IV, Legname G, Baldwin MA, Prusiner SB, Cohen FE. Pathway complexity of prion protein assembly into amyloid. J Biol Chem. 2002;277(24):21140–21148. doi: 10.1074/jbc.M111402200. [DOI] [PubMed] [Google Scholar]
- 70.Bjorndahl TC, et al. Detailed biophysical characterization of the acid-induced PrP(c) to PrP(β) conversion process. Biochemistry. 2011;50(7):1162–1173. doi: 10.1021/bi101435c. [DOI] [PubMed] [Google Scholar]
- 71.Gilch S, et al. Polyclonal anti-PrP auto-antibodies induced with dimeric PrP interfere efficiently with PrPSc propagation in prion-infected cells. J Biol Chem. 2003;278(20):18524–18531. doi: 10.1074/jbc.M210723200. [DOI] [PubMed] [Google Scholar]
- 72.Gore J, Ritort F, Bustamante C. Bias and error in estimates of equilibrium free-energy differences from nonequilibrium measurements. Proc Natl Acad Sci USA. 2003;100(22):12564–12569. doi: 10.1073/pnas.1635159100. [DOI] [PMC free article] [PubMed] [Google Scholar]
- 73.Zheng P, Cao Y, Li H. Facile method of constructing polyproteins for single-molecule force spectroscopy studies. Langmuir. 2011;27(10):5713–5718. doi: 10.1021/la200915d. [DOI] [PubMed] [Google Scholar]
- 74.Shank EA, Cecconi C, Dill JW, Marqusee S, Bustamante C. The folding cooperativity of a protein is controlled by its chain topology. Nature. 2010;465(7298):637–640. doi: 10.1038/nature09021. [DOI] [PMC free article] [PubMed] [Google Scholar]
- 75.Moffitt JR, Chemla YR, Smith SB, Bustamante C. Recent advances in optical tweezers. Annu Rev Biochem. 2008;77:205–228. doi: 10.1146/annurev.biochem.77.043007.090225. [DOI] [PubMed] [Google Scholar]
- 76.Žoldák G, Stigler J, Pelz B, Li H, Rief M. Ultrafast folding kinetics and cooperativity of villin headpiece in single-molecule force spectroscopy. Proc Natl Acad Sci USA. 2013;110(45):18156–18161. doi: 10.1073/pnas.1311495110. [DOI] [PMC free article] [PubMed] [Google Scholar]
- 77.Dudko OK, Hummer G, Szabo A. Intrinsic rates and activation free energies from single-molecule pulling experiments. Phys Rev Lett. 2006;96(10):108101. doi: 10.1103/PhysRevLett.96.108101. [DOI] [PubMed] [Google Scholar]
- 78.Zhang Y, Dudko OK. A transformation for the mechanical fingerprints of complex biomolecular interactions. Proc Natl Acad Sci USA. 2013;110(41):16432–16437. doi: 10.1073/pnas.1309101110. [DOI] [PMC free article] [PubMed] [Google Scholar]
- 79.Yang WY, Gruebele M. Folding at the speed limit. Nature. 2003;423(6936):193–197. doi: 10.1038/nature01609. [DOI] [PubMed] [Google Scholar]
- 80.Janovjak H, Knaus H, Muller DJ. Transmembrane helices have rough energy surfaces. J Am Chem Soc. 2007;129(2):246–247. doi: 10.1021/ja065684a. [DOI] [PubMed] [Google Scholar]
- 81.Wensley BG, et al. Experimental evidence for a frustrated energy landscape in a three-helix-bundle protein family. Nature. 2010;463(7281):685–688. doi: 10.1038/nature08743. [DOI] [PMC free article] [PubMed] [Google Scholar]
- 82.Pfitzner E, et al. Rigid DNA beams for high-resolution single-molecule mechanics. Angew Chem Int Ed Engl. 2013;52(30):7766–7771. doi: 10.1002/anie.201302727. [DOI] [PMC free article] [PubMed] [Google Scholar]
- 83.Seol Y, Perkins T. Sensitivity of DNA-hairpins dynamics to the mechanism of force feedback probed using a surface-coupled passive force clamp. Biophys J. 2009;96(3) Suppl 1:291a. [Google Scholar]
- 84.Chaudhury S, Makarov DE. A harmonic transition state approximation for the duration of reactive events in complex molecular rearrangements. J Chem Phys. 2010;133(3):034118. doi: 10.1063/1.3459058. [DOI] [PubMed] [Google Scholar]
- 85.Chung HS, Louis JM, Eaton WA. Experimental determination of upper bound for transition path times in protein folding from single-molecule photon-by-photon trajectories. Proc Natl Acad Sci USA. 2009;106(29):11837–11844. doi: 10.1073/pnas.0901178106. [DOI] [PMC free article] [PubMed] [Google Scholar]