

Significance
Poly(ADP-ribose) polymerase (PARP) inhibitors hold promise for patients with breast cancer 1 (BRCA1)-associatated cancers but are anticipated to give rise to resistance. We show that mouse mammary tumors resembling BRCA1-associated metaplastic breast carcinoma display intrinsic resistance to the PARP inhibitor olaparib as a result of increased P-glycoprotein drug efflux transporter expression. These findings may have implications for ongoing clinical trials.
Keywords: resistance, mouse model, breast cancer, BRCA1, PARP
Abstract
Metaplastic breast carcinoma (MBC) is a rare histological breast cancer subtype characterized by mesenchymal elements and poor clinical outcome. A large fraction of MBCs harbor defects in breast cancer 1 (BRCA1). As BRCA1 deficiency sensitizes tumors to DNA cross-linking agents and poly(ADP-ribose) polymerase (PARP) inhibitors, we sought to investigate the response of BRCA1-deficient MBCs to the PARP inhibitor olaparib. To this end, we established a genetically engineered mouse model (GEMM) for BRCA1-deficient MBC by introducing the MET proto-oncogene into a BRCA1-associated breast cancer model, using our novel female GEMM ES cell (ESC) pipeline. In contrast to carcinomas, BRCA1-deficient mouse carcinosarcomas resembling MBC show intrinsic resistance to olaparib caused by increased P-glycoprotein (Pgp) drug efflux transporter expression. Indeed, resistance could be circumvented by using another PARP inhibitor, AZD2461, which is a poor Pgp substrate. These preclinical findings suggest that patients with BRCA1-associated MBC may show poor response to olaparib and illustrate the value of GEMM-ESC models of human cancer for evaluation of novel therapeutics.
Poly(ADP-ribose) polymerase (PARP) inhibition provides a promising therapeutic strategy for targeting homologous recombination (HR)-deficient tumors, such as breast cancer 1 (BRCA1)-mutated cancers (1). Indeed, clinical phase I and phase II trials have shown potent anticancer activity of small molecule inhibitors of PARP, such as olaparib, in patients with BRCA1-associated breast cancer (2, 3). However, it remains to be established whether different breast cancer subtypes in BRCA1 mutation carriers respond equally to PARP inhibition. Reduced sensitivity of breast cancers to anticancer drugs has frequently been associated with an epithelial-to-mesenchymal transition (EMT) (4–7). Metaplastic breast carcinomas (MBCs) are a subset of triple-negative breast cancers (TNBCs) characterized by a claudin-low and EMT-like phenotype (8) and a poor prognosis compared with other TNBCs (9). More than 60% of MBCs have BRCA1 promoter methylation, raising the question whether these tumors can be effectively targeted by using PARP inhibitors (10). To address this issue in an experimentally controlled setting, we set out to generate a genetically engineered mouse model (GEMM) of BRCA1-deficient MBC by inducing EMT via MET overexpression in a previously established GEMM of BRCA1-mutated breast cancer. We report that EMT is associated with olaparib resistance and can be effectively bypassed by administration of AZD2461, a PARP inhibitor with low affinity for the P-glycoprotein (Pgp) drug efflux transporter.
Results
Development of a GEMM-ESC Strategy for Mouse Mammary Tumor Models.
GEMMs have the potential to capture the cell-intrinsic and cell-extrinsic factors that drive de novo tumor formation, making them exceptionally valuable for cancer research (11). To speed up the development of novel multiallele GEMMs of human cancer, we previously developed a GEMM-ES cell (ESC) strategy, which permits rapid introduction of mutant alleles into ESCs derived from existing, well-characterized GEMMs and subsequent production of experimental cohorts of chimeric mice that can be directly used for preclinical studies (12, 13). To validate candidate oncogenes and their contribution to therapy resistance in BRCA1-associated breast cancer, we set out to develop a female GEMM-ESC pipeline, based on our K14cre;Brca1F/F;Trp53F/F (KB1P) mouse mammary tumor model, in which Cre-mediated stochastic inactivation of BRCA1 and p53 leads to mammary tumors and, to a lesser extent, skin tumors (14). We derived clonal ESC lines from male and female KB1P blastocysts and validated their quality and potency by producing chimeric mice via blastocyst injection (Fig. 1A). As expected, sex conversion was evident for the male KB1P clone C3. Clone C3 and female clone A2 contributed well to chimeras, with the majority of animals scoring greater than 40% chimerism, and displayed germ-line transmission. For a second female KB1P clone (C7), more than half of the chimeras showed low chimerism and did not display germ-line transmission, indicating that the quality of this clone was suboptimal (Fig. 1B).
Fig. 1.

Mammary tumor development in chimeric mice derived from KB1P ESCs. (A) ESCs were isolated from our well-validated KB1P mouse model and subsequently tested for performance to generate chimeric mice. (B) Scatter plot showing the performance to generate chimeras of three individual ESC clones (one male, two female). (C) Tumor-free survival of KB1P chimeric mice (red, clone A2, t50 = 266 d, n = 13 mice; and blue, clone C7, t50 = 237 d, n = 6 mice) and KB1P GEMM mice (black; t50 = 209 d, n = 48 mice). Log-rank (Mantel–Cox) P value is indicated. (D) Histopathology of mammary tumors derived from KB1P chimeric and KB1P GEMM female mice. (Upper) H&E staining and (Middle, Lower) immunohistochemical detection of estrogen receptor (ER) and progesterone receptor (PR). (E) Pie diagrams illustrate the distribution of mammary tumor types in KB1P GEMM mice (93% carcinoma; 7% carcinosarcoma) and chimeras from KB1P clone A2 (93% carcinoma; 7% carcinosarcoma) and KB1P clone C7 (100% carcinoma). Carcinomas are shown in blue and carcinosarcomas in orange. (F) CNV analysis of KB1P chimeric and KB1P GEMM mammary tumors. Chromosome numbers are represented on the x axis and log2 ratio is depicted on the y axis.
Female ESCs tend to undergo XO conversion during in vitro culture. Indeed, copy number variation (CNV) sequencing of female KB1P ESC lines showed loss of one X-chromosome, which was confirmed by whole chromosome painting (Fig. S1 A and B). Previous studies reported that XO mice are viable and fertile but can exhibit some degree of growth retardation, high-frequency hearing loss, reduced thyroid activity, reduced body temperature, and behavioral abnormalities (15, 16). Chimeric mice derived from female KB1P ESCs did not display any abnormalities, were fertile, and gave germ-line transmission, indicating that our female KB1P ESCs contribute to the development of healthy chimeric offspring regardless of their XO status.
Fig. S1.

XO conversion in female ESCs. (A) DNA CNV analysis of two female ESC clones derived from the KB1P mouse model. Chromosome numbers are represented on the x axis and log2 ratios are depicted on the y axis. (B) FISH analysis of three individual female ESC clones using probes to detect X chromosome number. The numbers in the table represent individual cells for each clone, assessed for X chromosome number. A minimum of 100 cells were assessed per clone. Confocal images of metaphase spreads from two female ESC clones stained with a probe for the X-chromosome and Y-chromosome.
Mammary Tumor Development in KB1P Chimeric Mice.
Next, we monitored female KB1P chimeras for development of mammary tumors and compared the mammary tumor latency to that of the original KB1P GEMM (Fig. 1C). Chimeras of KB1P clone A2 developed tumors with a significantly increased median latency of 266 d vs. 209 d for the original KB1P GEMM (P < 0.0001), most likely because of the smaller number of mammary and skin epithelial cells that undergo Cre-mediated loss of BRCA1 and p53 compared with the original model (Fig. 1C). There was no significant difference in tumor latency for chimeras of KB1P clone C7, with a median tumor latency time (t50) of 237 d.
Histologically, mammary tumors from KB1P chimeras were estrogen and progesterone receptor-negative and were classified as solid carcinomas, thus showing morphological features comparable to KB1P GEMM tumors (Fig. 1 D and E). To assess inactivation of BRCA1 and p53 in tumors from KB1P chimeras, we performed Southern blot analysis, which confirmed recombination of the conditional Brca1F and Trp53F alleles in all cases (Fig. S2). Given that BRCA1 loss leads to genomic instability, we assessed DNA CNVs in mammary tumors from KB1P chimeras by CNV sequencing, which confirmed that KB1P chimeric tumors display genomic instability to the same extent as KB1P GEMM tumors (Fig. 1F). Thus, our female GEMM-ESC approach yields healthy chimeras that develop mammary tumors that closely resemble tumors from the original mouse model, and is therefore a novel tool to study breast cancer.
Fig. S2.
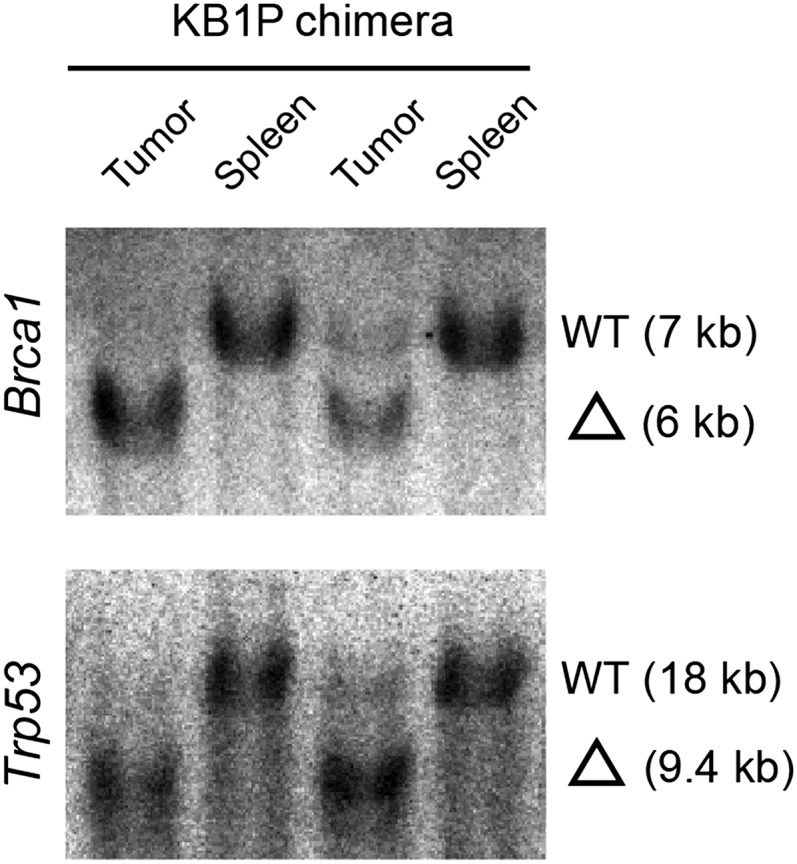
Southern blot analysis of genomic DNA from KB1P chimeric tumors to determine Brca1 (EcoRV/Stul digestion, exon 14 probe) and Trp53 (Bglll digestion, 5’ Xbal probe) deletion. Fragment sizes: Brca1 WT, 7 kb; Brca1 del, 6 kb; Trp53 WT, 18 kb; Trp53 del, 9.4 kb. Spleen is used as control tissue.
MET Accelerates Mammary Tumor Development in KB1P Chimeric Mice.
We next determined if the female GEMM-ESC strategy would be suitable to study the contribution of candidate oncogenes to mammary tumor formation. To allow rapid introduction of additional modifications, we made use of the Flp/FRT recombinase-mediated cassette exchange strategy (13, 17) (Fig. 2A). Female KB1P ESC clone A2 was targeted with an FRT homing cassette into the 3′UTR of the Col1a1 locus to produce K14cre;Brca1F/F;Trp53F/F;Col1a1FRT (KB1P-Col1a1) ESCs (Fig. S3A). Next, a Cre-inducible allele of the MET receptor tyrosine kinase, which is associated with EMT and therapy resistance (18, 19), and expressed at high levels in breast cancer (20–22), was introduced in KB1P-Col1a1 ESC clone A2.1 to produce K14cre;Brca1F/F;Trp53F/F;Col1a1inv-CAG-Met-Luc (KB1P-MET) ESCs (Fig. S3B). To allow for in vivo monitoring of MET expression by bioluminescence imaging, the Met cDNA was fused to a codon-optimized firefly luciferase (Luc) gene via an internal ribosomal entry site (Fig. S3C). Successful targeting of the FRT homing cassette and subsequent shuttling of the Cre-inducible invCAG-Met-Luc construct was confirmed by Southern blot analysis (Fig. S3 D and E). Luciferase expression was confirmed by bioluminescence imaging of Adeno-Cre–treated KB1P-MET ESCs (Fig. S3F). KB1P-Col1a1 and KB1P-MET ESCs produced high-grade female chimeras, which were monitored for mammary tumor development (Fig. 2B and Fig. S4A). Whereas KB1P and KB1P-Col1a1 chimeras developed mammary tumors with comparable latency, KB1P-MET chimeras developed mammary tumors with a significantly reduced latency of 176 d (P < 0.001; Fig. 2C), demonstrating that MET overexpression accelerates BRCA1-associated tumor development.
Fig. 2.

MET expression in KB1P chimeric mice leads to accelerated mammary tumor development. (A) Overview of the experimental procedure. Female ESCs derived from our KB1P mouse model were equipped with a Col1a1-frt homing cassette, and subsequently the Met proto-oncogene was introduced by recombinase-mediated cassette exchange. (B) Scatter plot illustrating the performance of KB1P ESC clones targeted with the Col1a1-frt homing cassette (Col1a1), and additionally equipped with Met (MET clone A9 and B3) to produce chimeric mice. (C) Mammary tumor-free survival of KB1P chimera (red; t50 = 284 d, n = 13 mice), KB1P-Col1a1 (black; t50 = 299 d, n = 14 mice), and KB1P-MET (blue; t50 = 176 d, n = 11 mice) chimeric mice. Log-rank (Mantel–Cox) P values are indicated. (D) Immunohistochemical staining of formalin-fixed/paraffin-embedded sections from KB1P, KB1P-Col1a1, and KB1P-MET chimeric mammary tumors for H&E, MET, METY1234/1235, E-cadherin, and vimentin. (E) Pie diagrams illustrating the distribution of different mammary tumor types in KB1P (93% carcinoma; 7% carcinosarcoma), KB1P-Col1a1 (100% carcinoma), and KB1P-MET (45% carcinoma; 55% carcinosarcoma) chimeric mice. Carcinomas are shown in blue and carcinosarcomas in orange. (F) Box plot showing relative expression of claudin 3, 4, and 7 in KB1P-MET carcinomas and carcinosarcomas. Mann–Whitney P values are indicated.
Fig. S3.

Targeting strategy. (A) Targeting of Col1a1-frt in the Col1a1 locus was performed by homolog recombination in KB1P ESCs. Schematic representation of the Col1a1 locus and the Col1a1-frt targeting construct. The Col1a1-frt vector contains a neomycin resistance cassette flanked by frt sites, followed by an ATG-less hygromycin resistance gene. The 3′ internal probe is indicated. Exons are shown as black boxes and the 3′UTR as a gray box. B, BglII; E, EcoRI; P, PstI; pA, polyadenylation signal; S, SpeI; X, XhoI; Xb, XbaI. (B) Flip-in of the frt-invCag-Met-Luc vector in Col1a1-frt targeted KB1P ESC clones was performed. Expression of Flpe recombinase removes the pGK-neo-pA cassette from the targeted Col1a1 locus and allows for Flpe-mediated integration of the frt-invGag-Met-Luc vector. ESC clones are selected for resistance to hygromycin that is expressed from the CAG promoter present in the frt-invGag-Met-Luc vector. (C) Cre recombinase-mediated expression of MET and firefly luciferase. The frt-invCag-Met-Luc vector contains Lox66 and Lox71 recombination sites that allow for promoter inversion after Cre recombinase expression resulting in MET and firefly luciferase expression. (D) Southern blot analysis of genomic DNA from KB1P-Col1a1 targeted ESC clones to determine incorporation of the Col1a1-frt homing cassette in the Col1a1 locus using the 3′ internal probe (EcoRI digest). Fragment sizes: Col1a1 WT, 4.6 kb; Col1a1-frt, 3.8 kb. (E) Southern blot analysis of genomic DNA from KB1P-MET ESC clones to determine successful Flp-in of MET using the 3′ internal probe (BglII digest). Fragment sizes: Col1a1 WT, 0.9 kb; Col1a1-frt, 3.3 kb; frt-invCag-Met-Luc, 6.8 kb. (F) Measurement of bioluminescence of two KB1P-MET ESC clones left untreated (Left) or infected with AdCre (Right).
Fig. S4.

Analysis of KB1P chimeric mammary tumors. (A) In vivo bioluminescence imaging of a KB1P-MET female chimera at day 82 and day 110. (B) Southern blot analysis of genomic DNA from KB1P-Col1a1 and KB1P-MET chimeric tumors to determine Brca1 (EcoRV/StuI digestion, exon 14 probe) and Trp53 (BglII digestion, 5′ XbaI probe) deletion. Fragment sizes: Brca1 WT, 7 kb; Brca1 del, 6 kb; Trp53 WT, 18 kb; Trp53 del, 9.4 kb. Spleen is used as control tissue.
KB1P-MET Chimeras Develop Mammary Tumors with Metaplastic Characteristics.
Histopathological analysis revealed that all mammary tumors from KB1P-Col1a1 chimeras were classified as carcinomas. In contrast, more than half of KB1P-MET chimeras developed carcinosarcomas, based on the presence of spindle cells that show E-cadherin loss and vimentin expression, indicating that MET expression promotes the development of metaplastic tumors with an EMT-like phenotype (Fig. 2 D and E). KB1P-MET carcinosarcomas also showed a claudin-low gene expression pattern, which is a key characteristic of breast cancers with an EMT phenotype (Fig. 2F) (8). In contrast to KB1P-MET carcinomas, mice bearing KB1P-MET carcinosarcomas developed tumors with a shorter latency (Table S1), indicating that these metaplastic tumors are more aggressive than carcinomas. Southern blot analysis confirmed Cre-mediated recombination of Brca1 and Trp53 in all tumors (Fig. S4B).
Table S1.
Histopathologic overview of KB1P-MET tumors
| KB1P-MET tumor | ESC clone | Chimerism, % | Latency, d | Histology |
| 1 | B3 | 85 | 75 | Carcinosarcoma |
| 2 | A9 | 70 | 81 | Carcinosarcoma |
| 3 | A9 | 75 | 121 | Carcinosarcoma |
| 4a | B3 | 75 | 148 | Carcinosarcoma |
| 4b | B3 | 75 | 148 | Carcinosarcoma |
| 5a | B3 | 45 | 176 | Carcinosarcoma |
| 5b | B3 | 45 | 176 | Carcinoma (solid) |
| 5c | B3 | 45 | 176 | Carcinoma (solid) |
| 6 | B3 | 65 | 217 | Carcinoma |
| 7 | A9 | 75 | 247 | Carcinoma |
| 8 | A9 | 85 | 248 | Carcinoma |
To confirm that KB1P-MET carcinosarcomas had undergone an EMT, we performed RNA-sequencing and determined the expression level of a panel of EMT signature genes (Fig. S5). KB1P and KB1P-MET tumors clustered perfectly into three groups. KB1P tumors express high levels of epithelial genes; KB1P-MET carcinomas express high levels of epithelial and mesenchymal genes, whereas KB1P-MET carcinosarcomas express high levels of mesenchymal genes. These results show that KB1P-MET mouse carcinosarcomas display an EMT phenotype and, in this respect, resemble BRCA1-deficient MBC in humans (23).
Fig. S5.

RNA-seq analysis of KB1P-MET tumors. Heat map of RNA-sequence analysis of KB1P and KB1P-MET chimeric tumors using the EMT signature.
KB1P-MET Carcinosarcomas Display Resistance to the PARP Inhibitor Olaparib.
Mammary tumors from GEMMs can be transplanted orthotopically into WT syngeneic female mice while retaining their morphological features, molecular characteristics, and drug-sensitivity profile (24). To confirm that mammary tumors from chimeric mice can be used for transplantation and intervention studies, we orthotopically transplanted 1-mm3 tumor fragments from KB1P-Col1a1 and KB1P-MET chimeras into the fourth mammary gland of syngeneic WT female recipient mice. Mammary tumor growth was evident after 4–6 wk and histopathological features of the transplanted tumor outgrowths were preserved, demonstrating that chimera-derived mammary tumors are suitable for allografting.
As MBCs have been associated with therapy resistance and poor outcome (25), we set out to assess if the EMT status of KB1P-MET tumors would affect their response to therapy. When allografted tumors reached a volume of 200 mm3, tumor-bearing mice were treated with cisplatin (6 mg/kg on days 0 and 14) or olaparib (50 mg/kg daily) for a period of 28 d or until the tumor reached the maximum allowed size of 1,500 mm3. In line with previous studies (24, 26), KB1P-Col1a1 carcinomas regressed upon cisplatin and olaparib treatment (Fig. 3). Likewise, KB1P-MET tumors shrank upon cisplatin treatment, regardless of their morphological status (Fig. 3A). In contrast, whereas KB1P-MET carcinomas regressed upon olaparib treatment, KB1P-MET carcinosarcomas were intrinsically resistant to olaparib (Fig. 3B). This suggests that olaparib resistance is not induced by MET expression per se, but rather by MET-associated EMT.
Fig. 3.

KB1P-MET carcinosarcomas respond poorly to clinical PARP inhibitor olaparib. (A) Small fragments of KB1P-Col1a1 and KB1P-MET epithelial and mesenchymal tumors were transplanted in the fourth mammary fat pad of WT recipient syngeneic mice. When tumors had reached a size of 200 mm3, mice were treated. Tumor-bearing KB1P-Col1a1 and KB1P-MET mice were treated with 6 mg/kg cisplatin, administered i.v. on day 0 and day 14. Tumor growth was monitored three times per week to assess treatment efficacy. (B) Tumor-bearing KB1P-Col1a1 and KB1P-MET mice were treated with 50 mg/kg olaparib daily, administered by i.p. injection, for 28 consecutive days. Tumor growth was monitored three times per week to assess treatment efficacy.
Increased Pgp Expression in KB1P-MET Carcinosarcomas Causes Resistance to Olaparib.
Next, we determined if KB1P-MET carcinosarcomas display increased expression of drug efflux transporters, which were previously implicated in olaparib resistance (26). Indeed, we detected increased mRNA expression of the Abcb1a and Abcb1b genes, both encoding Pgp, in KB1P-MET carcinosarcomas, indicating that these tumors may display resistance by increased efflux of olaparib (Fig. 4A). Moreover, Abcb1a and Abcb1b mRNA levels were strongly correlated to the EMT status of the KB1P-MET tumors (Fig. 4B).
Fig. 4.

KB1P-MET carcinosarcomas regress upon AZD2461 treatment. (A) Bar graph showing reverse transcriptase-multiplex ligation-dependent probe amplification (RT-MLPA) analysis on mammary tumors from KB1P and KB1P-MET chimeric mice. Abcb1a and Abcb1b mRNA levels are shown relative to the housekeeping gene Hprt. C, carcinoma; CS, carcinosarcoma. (B) Scatter plot showing the correlation between EMT status and Abcb1a or Abcb1b expression levels. Orange circle indicates KB1P chimera; blue circle indicates KB1P-MET carcinoma; blue triangle indicates KB1P-MET carcinosarcoma. (C) Small fragments derived from a KB1P-MET carcinoma and two carcinosarcomas were transplanted into the mammary fat pad of WT recipient syngeneic mice. When tumors had reached a size of 200 mm3, mice were treated with olaparib (50 mg/kg i.p. for 28 d) with or without the Pgp inhibitor tariquidar (2 mg/kg i.p.) or left untreated. Tumor growth was monitored three times per week to assess treatment efficacy. (D) Small fragments derived from a KB1P-Col1a1 carcinoma and KB1P-MET carcinosarcomas were transplanted into the mammary fat pad of WT recipient syngeneic mice. When tumors had reached a size of 200 mm3, mice were treated orally with the PARP inhibitor AZD2461 (100 mg/kg per os for 28 d) or left untreated. Tumor growth was monitored three times per week to assess treatment efficacy.
To demonstrate that Pgp mediates olaparib resistance of KB1P-MET carcinosarcomas,, we determined the response of KB1P-MET carcinosarcomas to olaparib combined with the Pgp inhibitor tariquidar (XR9576) (27). A KB1P-MET carcinosarcoma with high Pgp expression (donor 2) responded well to the combination therapy, confirming that olaparib resistance is mediated by increased drug efflux by Pgp in this tumor (Fig. 4C). Olaparib resistance of a KB1P-MET carcinosarcoma with low Pgp expression (donor 3) could not be bypassed by coadministration of tariquidar, indicating that resistance of this carcinosarcoma was driven by a different mechanism.
Next, we determined the response of KB1P-MET carcinosarcomas to AZD2461, a PARP inhibitor with strongly reduced affinity to Pgp (28). KB1P-MET carcinosarcomas with high Pgp expression (donors 1 and 2) responded well to AZD2461, confirming Pgp-mediated resistance to olaparib (Fig. 4D).
To assess whether also human TNBCs with EMT features have elevated Pgp levels, we evaluated ABCB1 gene expression in several human TNBC subtypes. Similar to mouse KB1P-MET carcinosarcomas and in contrast to basal-like TNBCs with epithelial morphology, the majority of MBCs have a claudin-low phenotype (29, 30). We therefore determined ABCB1 mRNA levels in claudin-low TNBCs and compared them vs. basal-like TNBCs. As expected, claudin-low TNBCs showed a significantly higher EMT score than basal-like TNBCs (Fig. 5A). In addition, claudin-low TNBCs showed significantly increased ABCB1 mRNA levels compared with basal-like TNBCs (Fig. 5B), suggesting that also human MBCs may show intrinsic resistance to olaparib as a result of elevated Pgp-mediated drug extrusion.
Fig. 5.

ABCB1 expression and EMT score in human basal and claudin-low TNBCs. Box plots showing EMT score (A) and ABCB1 expression levels (B) in basal-like and claudin-low TNBCs. Wilcoxon P values are indicated.
Discussion
In this study, we describe a novel female GEMM-ESC strategy for rapid introduction of additional mutant alleles into existing complex GEMMs of human breast cancer. We also demonstrate the utility of this approach to study cause-and-effect relations in BRCA1-associated breast cancer. An advantage of the female GEMM-ESC approach is that, when female chimeras have been generated, these mice can directly be used for tumor monitoring without further breeding. This strategy effectively reduces time and costs spent on breeding, and—equally importantly—it reduces the total number of mice used to generate a new mouse line. Mammary tumors that develop in chimeric mice derived from GEMM-ESCs are transplantable and therefore suitable for a wide range of preclinical in vivo studies. Moreover, the GEMM-ESC strategy is compatible with CRISPR/Cas9 technology, thus creating a powerful tool for fast-track generation of tailored in vivo models to propel basic and translational cancer research in the era of personalized medicine.
We used the female GEMM-ESC strategy to establish a novel mouse model for BRCA1-mutated metaplastic breast cancer by forcing MET expression in our previously established KB1P mouse mammary tumor model. We showed that the resulting KB1P-MET carcinosarcomas are unresponsive to olaparib treatment. Given that EMT is associated with more aggressive breast cancer subtypes (5), it is perhaps not surprising that breast cancer subtypes with mesenchymal elements respond poorly to therapeutics. Notably, several KB1P-MET carcinosarcomas showed elevated levels of the drug efflux transporter Pgp, an observation that was previously reported in olaparib-resistant KB1P tumors (26), but was never linked to their morphological status. In addition, we found elevated ABCB1 expression in human EMT-like TNBCs with a claudin-low gene expression pattern, suggesting that human BRCA1-deficient MBCs also may display reduced sensitivity to olaparib as a result of Pgp-mediated drug efflux. Interestingly, increased Pgp expression was also associated with olaparib resistance in BRCA2-deficient carcinosarcomas from K14cre;Brca2F/F;Trp53F/F mice (31). However, in a KB1P-MET carcinosarcoma expressing low levels of Pgp, unresponsiveness to PARP inhibition could not be explained by drug efflux. This particular tumor (donor 3) showed decreased expression of 53BP1 (Fig. S6A), which was previously reported to restore HR and thereby cause olaparib resistance in BRCA1-deficient tumors (24, 25). Indeed, RAD51 foci formation was detected in this tumor following irradiation, suggesting that restoration of HR as a result of 53BP1 loss is the most plausible cause of resistance to olaparib and AZD2461 (Fig. S6 B and C). We have previously shown that restoration of HR by somatic mutation of Trp53bp1 encoding 53BP1 occurs in 25% of KB1P mammary tumors with acquired resistance to AZD2461 (28). Whether reduced 53BP1 expression in the AZD2461-resistant KB1P-MET carcinosarcoma is a consequence of MET-induced EMT or caused by (epi)genetic alterations of Trp53bp1 remains to be determined.
Fig. S6.

53BP1 expression and RAD51 foci formation in KB1P-MET carcinosarcomas. (A) Immunohistochemical detection of 53BP1 expression in FFPE sections from KB1P-Col1a1 and KB1P-MET tumors. (B) Analysis of RAD51 expression using confocal microscopy in KB1P-MET carcinosarcomas. Tumors were exposed to 15 Gy irradiation before analysis. IR, irradiated; KP, K14cre;Trp53F/F; NIR, nonirradiated. (C) Quantification of RAD51 foci formation. Box plot representing the percentage of cells with more than five foci. The Mann–Whitney P value is indicated for KB1P-MET donor 3.
Although clinical phase I and phase II trials have demonstrated anticancer activity of olaparib in patients with BRCA1-associated breast cancer (2, 3), the response of BRCA1-associated MBCs has yet to be established. Our data show that mouse mammary tumors resembling BRCA1-associated MBC display intrinsic resistance to olaparib as a result of increased Pgp drug efflux transporter expression. These preclinical findings may have implications for ongoing clinical trials.
Methods
All animal work was performed in accordance with protocol A11002 approved by the Animal Ethics Committee of The Netherlands Cancer Institute(Amsterdam). Detailed protocols regarding CNV sequencing, whole chromosome painting, Southern blot analysis, targeting ESCs, AdCre infection, bioluminescence imaging, RNA sequencing, EMT signature and human data sets, RAD51 foci analysis, transplantations, histology, and RT-MLPA are described in SI Methods.
Antibodies.
All antibodies and their dilutions are summarized in Table S2.
Table S2.
Primary and secondary antibodies
| Antibody | Manufacturer | Dilution |
| Primary | ||
| Mouse anti–E-cadherin | BD BioScience 610182 | 1:400 |
| Rabbit anti-Vimentin | Cell Signaling 5741 | 1:200 |
| Rabbit anti-cytokeratin 5 | Covance/Babco PRB-160P | 1:500 |
| Rat anti-cytokeratin 8 | University of Iowa Troma-1 | 1:800 |
| Rabbit anti-estrogen receptor α | Santa Cruz SC-542 | 1:2,000 |
| Rabbit anti-progesterone receptor | Neomarkers RM-9102-SO | 1:300 |
| Goat anti-HGFR/cMet | R&D Systems AF527 | 1:100 |
| Rabbit anti–phospho-Met | Cell Signaling 3077 | 1:150 |
| Rabbit anti-53BP1 | Bethyl A300-272A | 1:1,000 |
| Secondary | ||
| Labeled polymer-HRP anti-mouse Envision | Dako K4005 | — |
| Labeled polymer-HRP anti-rabbit Envision | Dako K4009 | — |
| Biotin-conjugated anti-rat | Santa Cruz SC-2041 | 1:100 |
| Biotin-conjugated anti-rabbit | Dako E0432 | 1:1,000 |
| Biotin-conjugated anti-goat | Dako E0466 | 1:300 |
Generation of Chimeric Mice.
ESCs were derived from KB1P mice and cultured as described previously (13). Male and female ESCs were injected into C57BL/6N blastocysts and implanted into pseudopregnant B6CBAF1/Ola foster mice. The percentage of chimerism of the resulting chimeras was scored by the absence of host-derived coat color. Germ-line transmission was determined by crossing chimeric mice to KB1P (FVB) mice, and the offspring were scored for coat color transmission.
Targeting Col1a1 Locus and Flip-in of Met.
Female KB1P ESCs were targeted with the Col1a1-frt targeting plasmid followed by Flp-mediated integration of the frt-invCAG-Met-Luc vector as described previously (13, 17). Further details are described in SI Methods.
SI Methods
CNV Sequencing.
Genomic DNA of ESCs and tumor samples was extracted by proteinase K lysis and organic extraction with phenol-chloroform. For DNA sequencing, DNA libraries for Illumina sequencing were prepared by using the KAPA HTP Library Preparation Kit (KAPA Biosystems) according to the manufacturer’s instructions. The amount of dsDNA in the genomic samples was quantified by using the Qubit dsDNA HS Assay Kit (Invitrogen). As much as 250 ng of double-stranded genomic DNA was fragmented by Covaris shearing to obtain fragment sizes of 160–180 bp. Samples are purified using 1.8× Agencourt AMPure XP PCR Purification beads according to the manufacturer’s instructions (Beckman Coulter). The sheared DNA samples were quantified and qualified on the Agilent Technologies 2100 Bioanalyzer instrument by using the HS assay kit (Agilent Technologies). DNA library preparation for Illumina sequencing was performed by using the KAPA HTP Library Preparation Kit (KAPA Biosystems). During library enrichment, 10 PCR cycles were used to obtain enough yield for sequencing. After library preparation the libraries were cleaned up by using 1× AMPure XP beads. All DNA libraries were analyzed on a BioAnalyzer system by using DNA7500 chips (Agilent Technologies) to determine the molarity. As many as 10 uniquely indexed samples were mixed together by equimolar pooling, in a final concentration of 10 nM, and subjected to sequencing on an Illlumina HiSeq2000 machine in one lane of a single-read 50-bp run, according to the manufacturer’s instructions. Reads were aligned to the reference genome (hg19) by using the Burrows-Wheeler Alignment (BWA) backtrack algorithm (32) and counted in 20-kb nonoverlapping bins. These bin counts were corrected for GC bias using a loose fit. The “mappability” value of each bin is precomputed by summarizing the alignment results of all possible 51-mers from the reference sequence. A linear model intercepting 0 was used to fit the loess-corrected count data to the mappability values. The slope of this fit, multiplied with the mappability value for each bin, provides the bin’s reference value that is used to calculate the final log2 copy number ratios. Encyclopedia of DNA Elements (ENCODE) (33) blacklisted regions and bins with a mappability < 0.2 were excluded from the final dataset.
Whole Chromosome Painting.
Mouse whole-chromosome paint X-Cy3 and mouse whole chromosome paint Y-rhodamine green were used as described previously (34).
Orthotopic Transplantations and Treatment of Tumor-Bearing Mice.
Small fragments (1–2 mm in diameter) of mammary tumors from chimeric KB1P-Col1a1 and KB1P-MET mice were transplanted orthotopically into the fourth right mammary fat pad of WT FVB/N mice as described previously (24). Treatment was initiated when tumors reached a size of ∼200 mm3 (formula for tumor volume: 0.5 × length × width2). Cisplatin (6 mg/kg i.v.; Mayne Pharma) was administered at day 0 and 14. Olaparib (50 mg/kg i.p.) and AZD2461 (100 mg/kg per os) were administered for 28 consecutive days. Tariquidar (2 mg/kg i.p.; Avaant Pharmaceuticals) was administered 15 min before the olaparib injection for 28 consecutive days. Mice were killed after 28 d of treatment or when the tumor volume exceeded 1,500 mm3.
Histology and Immunohistochemistry.
FFPE sections were stained with H&E. For immunohistochemical stainings, antigen retrieval was performed with citrate buffer, pH 6.0 (cytokeratin 5 and 8, progesterone receptor, cMet, and 53BP1) or Tris⋅EDTA, pH 9.0 (E-cadherin, vimentin, estrogen receptor-α, and phospho-Met). Subsequently, endogenous peroxidases were blocked with 3% (vol/vol) H2O2. Slides were preincubated with 10% (wt/vol) nonfat dry milk, 4% (wt/vol) BSA/5% (vol/vol) goat serum, or 2.5% (wt/vol) BSA/5% (vol/vol) rabbit serum in PBS solution. The first antibody was incubated overnight. Next, slides were incubated with HRP-conjugated Envision (Dako) or stained with biotin-conjugated secondary antibodies and incubated with HRP-conjugated streptavidin–biotin complex (Dako). Following detection with 3,3-diaminobenzidine-tetrahydrochloride (A-6926; Sigma), slides were counterstained with hematoxylin and dehydrated.
Southern Blot Analysis of Brca1 and Trp53.
Genomic DNA was isolated from tissue by proteinase K lysis and organic extraction with phenol-chloroform. Southern blot analysis was performed by using 10 µg genomic DNA, digested with EcoRI/StuI or BglII to determine the status of Brca1 or Trp53. Blotting and hybridization was performed as described previously (35). Probes were radioactively labeled by PCR. Primers for amplification of the 86-nt Brca1 exon 14 probe were as follows: forward primer, 5′-AGC CAA AAT TTG AAG AGC G -3′; and reverse primer, 5′-ATC CCT GAC TCG TCA TCT CC -3′. Hybridization of EcoRV/StuI digested DNA to the Brca1 exon 14 probe resulted in 7-kb (WT Brca1 allele) and 6-kb (deleted Brca1 allele) bands. Primers for amplification of the 700-nt Trp53 5′ XbaI probe were as follows: forward primer, 5′-CTA CCT GAA GAC CAA GAA GG-3′; and reverse primer, 5′-TGG AGG ATA TGG ACC CTA TG-3′. Hybridization of BglII digested DNA to the Trp53 5′ XbaI probe resulted in 18-kb (WT Trp53 allele) and 9.4-kb (deleted Trp53 allele) bands.
Targeting Col1a1 Locus and Flip-in of Met.
The Col1a1-frt targeting construct and the Flpe overexpressing plasmid were provided by J. Gribnau (Erasmus Medical Center Rotterdam, Rotterdam, The Netherlands) (17). Met cDNA was inserted as an FseI-PmeI fragment into the frt-invCAG-Luc vector, resulting in the frt-invCAG-Met-Luc vector. Targeting of the Col1a1 locus with the Col1a1-frt construct and Flp-mediated integration of the frt-invCAG-Met-Luc plasmid was performed as described previously (13). Briefly, female KB1P ESCs (5 × 10⁶) were electroporated with 10 µg XhoI digested Col1a1-frt targeting plasmid DNA in 0.4-cm Gene Pulser cuvettes (Bio-Rad) at 3 µF, 0.8 kV for 0.1 ms in a Bio-Rad Gene Pulser. Cells were plated on a 57-cm2 tissue culture dish precoated with 0.1 mg/mL laminin (Sigma). After 24 h, Geneticin (200 ng/mL; Gibco) was added to the culture medium to select positive clones. The medium was refreshed every other day. After 10–14 d, individual clones could be picked, dissociated, and transferred to a 0.1% gelatin-coated 96-well plate. After expending neomycin-resistant ESC clones, genomic DNA was isolated and used for PCR and Southern blot analysis to screen for correctly targeted clones.
Flip-in of Met was achieved by cotransfecting the Flpe overexpressing plasmid (0.6 µg) and the frt-invCAG-Met-Luc vector (4.8 µg) in a Col1a1-frt targeted KB1P ESC clone (KB1P-Col1a1). KB1P-Col1a1 ESCs (1 × 10⁶) were plated on a laminin-coated 57-cm2 dish. After 2 d, plasmid DNA was mixed with 9 µL Lipofectamine 2000 (Invitrogen) in 250 µL OptiMEM (Gibco) and added to the culture medium. After 6 h, the medium was refreshed, and, after 24 h, Hygromycin-B (150 µg/mL; Invitrogen) was added. Individual clones were picked after 10–14 d and expanded, and genomic DNA was isolated to screen for correct shuttling. Screening of Col1a1-frt targeted and frt-invCAG-Met-Luc Flp-in ESC clones was performed by PCR and Southern blot as described previously (13).
In Vitro Switching with Adeno-cre Recombinase.
KB1P-MET ESCs were cultured as described (13) for 24 h in six-well plates and infected with viral Ad5-CMV-Cre particles (6 × 10⁷; Gene Transfer Vector Core, University of Iowa). Three days after infection, luciferase activity in ESCs was determined by bioluminescence imaging.
In Vitro and in Vivo Bioluminescence Imaging.
Beetle luciferin (Promega) was dissolved at 15 mg/mL in sterile PBS solution and stored at −20 °C. For in vitro studies, luciferin solution was diluted 10 times in culture medium. For in vivo studies, luciferin solution was injected i.p. (0.01 mL/g body weight) and animals were anesthetized with 2–3% isoflurane. Light emission was measured 15 min after luciferin administration by using a cooled CCD camera (IVIS; Xenogen), coupled to Living Image acquisition and analysis software over an integration time of 1 min. Signal intensity was quantified as the Flux (photons per second) measured over the region of interest.
RT-MLPA Analysis.
Total RNA of tumor samples was isolated with TRIzol (Invitrogen), and the integrity of RNA was verified by denaturing gel electrophoresis. Reverse transcription, hybridization, ligation, PCR amplification, and fragment analysis by capillary electrophoresis were performed as described previously (24).
RNA Sequencing.
Total RNA was extracted using TRIzol reagent (Ambion Life Technologies) according to the manufacturer’s instructions. For RNA sequencing, strand-specific sequencing libraries were generated by using the TruSeq Stranded mRNA sample preparation guide (Illumina) according to the manufacturer’s protocol. Strand-specific sequencing libraries were generated by using the TruSeq Stranded mRNA sample preparation guide (Illumina) according to the manufacturer’s instructions. Briefly, polyadenylated RNA from intact total RNA was purified by using oligo-dT beads. Following purification, the RNA was fragmented, random primed, and reverse transcribed by using SuperScript II Reverse Transcriptase (Invitrogen) with the addition of actinomycin D. Second-strand synthesis was performed by using polymerase I and RNaseH with replacement of dTTP for dUTP. The generated cDNA fragments were 3′-end adenylated and ligated to Illumina paired-end sequencing adapters and subsequently amplified by 12 cycles of PCR. The libraries were analyzed on a 2100 Bioanalyzer (Agilent) using a 7500 chip (Agilent) and diluted to 10 nM. The 10-nM RNAseq libraries were denatured and diluted in hybridization buffer (Illumina) to 7 pM concentrations and spiked (0.5%) with a standard PhiX library. Cluster generation was achieved in a c-Bot instrument (Illumina), and deep sequencing was done with a HiSeq2000 machine (Illumina).
EMT Signature and EMT Score.
A published EMT signature (36) was converted from human to mouse, resulting in 239 epithelial and 224 mesenchymal genes, of which 235 epithelial and 223 mesenchymal genes could be mapped to Ensembl gene identifiers by using Ensembl Biomart (31, 37). Expression data were mean-centered per gene or probe for each data set. The EMT score of each tumor in all data sets is calculated by subtracting the mean log2 expression of the epithelial genes from the mean of the log2 expression of the mesenchymal genes. Consequently, tumors with a mesenchymal gene expression profile display a positive EMT score and epithelial tumors have a negative EMT score. Correlation between EMT score and Abcb1a, Abcb1b, and Abcg2 expression was calculated by using Spearman correlation.
Human Data Set.
To determine ABCB1 expression levels in human TNBCs, we used the previously described dataset GSE10885, which contains 58 basal-like samples and 17 claudin-low samples (8).
In Situ Analysis of RAD51 Foci Formation.
Small fragments of KP (K14cre;Trp53F/F) carcinoma and KB1P-MET carcinosarcomas were transplanted orthotopically into the fourth right mammary fat pad of WT FVB/N mice. When tumors reached a size of ∼10 × 10 mm, the tumor was irradiated at a dose of 15 Gy by using a cone-beam irradiator. Mice were killed 2 h after irradiation, and tissue was processed. FFPE sections were deparaffinized and rehydrated, after which antigen retrieval was performed on the sections with Target Retrieval solution (DAKO). Tissue was permeabilized by using 0.2% Triton in PBS solution for 20 min at room temperature and subsequently incubated with DNase I (1,000 U/mL; Roche) for 1 h at 37 °C. Sections were incubated with RAD51 antibody (gift from R. Kanaar, Erasmus MC, Rotterdam, The Netherlands) and subsequently with goat anti-rabbit Alexa Fluor 568. Slides were mounted by using Vectashield with DAPI. A minimum of five different areas were imaged (z-stack) per tumor; images were analyzed by using ImageJ to quantify the percentage of cells with more foci than the threshold of five foci per nucleus.
Supplementary Material
Acknowledgments
We thank the preclinical therapeutics, animal housing and animal pathology cores, and the genomics core facility for their help, and Mark O’Connor (AstraZeneca) for providing olaparib and AZD2461. This work was supported by Worldwide Cancer Research (formerly AICR) Grant 14-0288, Dutch Cancer Society Project NKI-2011-5220, Netherlands Organization for Scientific Research (NWO) NWO-NGI Zenith 93512009 and NWO-VICI 91814643, European Union Seventh Framework Program EurocanPlatform Project 260791, a National Roadmap grant for Large-Scale Research facilities provided by the NWO, Cancer Genomics Centre Netherlands, and the Cancer Systems Biology Center funded by the NWO.
Footnotes
The authors declare no conflict of interest.
This article is a PNAS Direct Submission.
This article contains supporting information online at www.pnas.org/lookup/suppl/doi:10.1073/pnas.1500223112/-/DCSupplemental.
References
- 1.Sonnenblick A, de Azambuja E, Azim HA, Piccart M. An update on PARP inhibitors—moving to the adjuvant setting. Nat Rev Clin Oncol. 2015;12(1):27–41. doi: 10.1038/nrclinonc.2014.163. [DOI] [PubMed] [Google Scholar]
- 2.Tutt A, et al. Oral poly(ADP-ribose) polymerase inhibitor olaparib in patients with BRCA1 or BRCA2 mutations and advanced breast cancer: A proof-of-concept trial. Lancet. 2010;376(9737):235–244. doi: 10.1016/S0140-6736(10)60892-6. [DOI] [PubMed] [Google Scholar]
- 3.Fong PC, et al. Inhibition of poly(ADP-ribose) polymerase in tumors from BRCA mutation carriers. N Engl J Med. 2009;361(2):123–134. doi: 10.1056/NEJMoa0900212. [DOI] [PubMed] [Google Scholar]
- 4.Hollier BG, Evans K, Mani SA. The epithelial-to-mesenchymal transition and cancer stem cells: A coalition against cancer therapies. J Mammary Gland Biol Neoplasia. 2009;14(1):29–43. doi: 10.1007/s10911-009-9110-3. [DOI] [PubMed] [Google Scholar]
- 5.Taube JH, et al. Core epithelial-to-mesenchymal transition interactome gene-expression signature is associated with claudin-low and metaplastic breast cancer subtypes. Proc Natl Acad Sci USA. 2010;107(35):15449–15454. doi: 10.1073/pnas.1004900107. [DOI] [PMC free article] [PubMed] [Google Scholar]
- 6.Borst P. Cancer drug pan-resistance: Pumps, cancer stem cells, quiescence, epithelial to mesenchymal transition, blocked cell death pathways, persisters or what? Open Biol. 2012;2(5):120066. doi: 10.1098/rsob.120066. [DOI] [PMC free article] [PubMed] [Google Scholar]
- 7.Foroni C, Broggini M, Generali D, Damia G. Epithelial-mesenchymal transition and breast cancer: Role, molecular mechanisms and clinical impact. Cancer Treat Rev. 2012;38(6):689–697. doi: 10.1016/j.ctrv.2011.11.001. [DOI] [PubMed] [Google Scholar]
- 8.Hennessy BT, et al. Characterization of a naturally occurring breast cancer subset enriched in epithelial-to-mesenchymal transition and stem cell characteristics. Cancer Res. 2009;69(10):4116–4124. doi: 10.1158/0008-5472.CAN-08-3441. [DOI] [PMC free article] [PubMed] [Google Scholar]
- 9.Jung S-Y, et al. Worse prognosis of metaplastic breast cancer patients than other patients with triple-negative breast cancer. Breast Cancer Res Treat. 2010;120(3):627–637. doi: 10.1007/s10549-010-0780-8. [DOI] [PubMed] [Google Scholar]
- 10.Turner NC, et al. BRCA1 dysfunction in sporadic basal-like breast cancer. Oncogene. 2007;26(14):2126–2132. doi: 10.1038/sj.onc.1210014. [DOI] [PubMed] [Google Scholar]
- 11.van Miltenburg MH, Jonkers J. Using genetically engineered mouse models to validate candidate cancer genes and test new therapeutic approaches. Curr Opin Genet Dev. 2012;22(1):21–27. doi: 10.1016/j.gde.2012.01.004. [DOI] [PubMed] [Google Scholar]
- 12.Huijbers IJ, Krimpenfort P, Berns A, Jonkers J. Rapid validation of cancer genes in chimeras derived from established genetically engineered mouse models. BioEssays. 2011;33(9):701–710. doi: 10.1002/bies.201100018. [DOI] [PMC free article] [PubMed] [Google Scholar]
- 13.Huijbers IJ, et al. Rapid target gene validation in complex cancer mouse models using re-derived embryonic stem cells. EMBO Mol Med. 2014;6(2):212–225. doi: 10.1002/emmm.201303297. [DOI] [PMC free article] [PubMed] [Google Scholar]
- 14.Liu X, et al. Somatic loss of BRCA1 and p53 in mice induces mammary tumors with features of human BRCA1-mutated basal-like breast cancer. Proc Natl Acad Sci USA. 2007;104(29):12111–12116. doi: 10.1073/pnas.0702969104. [DOI] [PMC free article] [PubMed] [Google Scholar]
- 15.Ishikawa H, Banzai M, Yamauchi T. Developmental retardation of XO mouse embryos at mid-gestation. J Reprod Fertil. 1999;115(2):263–267. doi: 10.1530/jrf.0.1150263. [DOI] [PubMed] [Google Scholar]
- 16.Burgoyne PS, Ojarikre OA, Turner JMA. Evidence that postnatal growth retardation in XO mice is due to haploinsufficiency for a non-PAR X gene. Cytogenet Genome Res. 2002;99(1-4):252–256. doi: 10.1159/000071601. [DOI] [PubMed] [Google Scholar]
- 17.Beard C, Hochedlinger K, Plath K, Wutz A, Jaenisch R. Efficient method to generate single-copy transgenic mice by site-specific integration in embryonic stem cells. Genesis. 2006;44(1):23–28. doi: 10.1002/gene.20180. [DOI] [PubMed] [Google Scholar]
- 18.Zhang Z, et al. Functional genetic approach identifies MET, HER3, IGF1R, INSR pathways as determinants of lapatinib unresponsiveness in HER2-positive gastric cancer. Clin Cancer Res. 2014;20(17):4559–4573. doi: 10.1158/1078-0432.CCR-13-3396. [DOI] [PubMed] [Google Scholar]
- 19.La Monica S, et al. Gefitinib inhibits invasive phenotype and epithelial-mesenchymal transition in drug-resistant NSCLC cells with MET amplification. PLoS ONE. 2013;8(10):e78656. doi: 10.1371/journal.pone.0078656. [DOI] [PMC free article] [PubMed] [Google Scholar]
- 20.Ponzo MG, et al. Met induces mammary tumors with diverse histologies and is associated with poor outcome and human basal breast cancer. Proc Natl Acad Sci USA. 2009;106(31):12903–12908. doi: 10.1073/pnas.0810402106. [DOI] [PMC free article] [PubMed] [Google Scholar]
- 21.Knight JF, et al. Met synergizes with p53 loss to induce mammary tumors that possess features of claudin-low breast cancer. Proc Natl Acad Sci USA. 2013;110(14):E1301–E1310. doi: 10.1073/pnas.1210353110. [DOI] [PMC free article] [PubMed] [Google Scholar]
- 22.Zagouri F, et al. High MET expression is an adverse prognostic factor in patients with triple-negative breast cancer. Br J Cancer. 2013;108(5):1100–1105. doi: 10.1038/bjc.2013.31. [DOI] [PMC free article] [PubMed] [Google Scholar]
- 23.Weigelt B, Kreike B, Reis-Filho JS. Metaplastic breast carcinomas are basal-like breast cancers: A genomic profiling analysis. Breast Cancer Res Treat. 2009;117(2):273–280. doi: 10.1007/s10549-008-0197-9. [DOI] [PubMed] [Google Scholar]
- 24.Rottenberg S, et al. Selective induction of chemotherapy resistance of mammary tumors in a conditional mouse model for hereditary breast cancer. Proc Natl Acad Sci USA. 2007;104(29):12117–12122. doi: 10.1073/pnas.0702955104. [DOI] [PMC free article] [PubMed] [Google Scholar]
- 25.Hennessy BT, et al. Biphasic metaplastic sarcomatoid carcinoma of the breast. Ann Oncol. 2006;17(4):605–613. doi: 10.1093/annonc/mdl006. [DOI] [PubMed] [Google Scholar]
- 26.Rottenberg S, et al. High sensitivity of BRCA1-deficient mammary tumors to the PARP inhibitor AZD2281 alone and in combination with platinum drugs. Proc Natl Acad Sci USA. 2008;105(44):17079–17084. doi: 10.1073/pnas.0806092105. [DOI] [PMC free article] [PubMed] [Google Scholar]
- 27.Mistry P, et al. In vitro and in vivo reversal of P-glycoprotein-mediated multidrug resistance by a novel potent modulator, XR9576. Cancer Res. 2001;61(2):749–758. [PubMed] [Google Scholar]
- 28.Jaspers JE, et al. Loss of 53BP1 causes PARP inhibitor resistance in Brca1-mutated mouse mammary tumors. Cancer Discov. 2013;3(1):68–81. doi: 10.1158/2159-8290.CD-12-0049. [DOI] [PMC free article] [PubMed] [Google Scholar]
- 29.Prat A, et al. Phenotypic and molecular characterization of the claudin-low intrinsic subtype of breast cancer. Breast Cancer Res. 2010;12(5):R68. doi: 10.1186/bcr2635. [DOI] [PMC free article] [PubMed] [Google Scholar]
- 30.Gerhard R, et al. Immunohistochemical features of claudin-low intrinsic subtype in metaplastic breast carcinomas. Breast. 2012;21(3):354–360. doi: 10.1016/j.breast.2012.03.001. [DOI] [PubMed] [Google Scholar]
- 31.Jaspers JE, et al. BRCA2-deficient sarcomatoid mammary tumors exhibit multidrug resistance. Cancer Res. 2015;75(4):732–741. doi: 10.1158/0008-5472.CAN-14-0839. [DOI] [PubMed] [Google Scholar]
- 32.Li H, Durbin R. Fast and accurate short read alignment with Burrows-Wheeler transform. Bioinformatics. 2009;25(14):1754–1760. doi: 10.1093/bioinformatics/btp324. [DOI] [PMC free article] [PubMed] [Google Scholar]
- 33.ENCODE Project Consortium An integrated encyclopedia of DNA elements in the human genome. Nature. 2012;489(7414):57–74. doi: 10.1038/nature11247. [DOI] [PMC free article] [PubMed] [Google Scholar]
- 34.Szuhai K, Tanke HJ. COBRA: Combined binary ratio labeling of nucleic-acid probes for multi-color fluorescence in situ hybridization karyotyping. Nat Protoc. 2006;1(1):264–275. doi: 10.1038/nprot.2006.41. [DOI] [PubMed] [Google Scholar]
- 35.Jonkers J, et al. Synergistic tumor suppressor activity of BRCA2 and p53 in a conditional mouse model for breast cancer. Nat Genet. 2001;29(4):418–425. doi: 10.1038/ng747. [DOI] [PubMed] [Google Scholar]
- 36.Huang S, et al. MED12 controls the response to multiple cancer drugs through regulation of TGF-β receptor signaling. Cell. 2012;151(5):937–950. doi: 10.1016/j.cell.2012.10.035. [DOI] [PMC free article] [PubMed] [Google Scholar]
- 37.Kinsella RJ, et al. Ensembl BioMarts: A hub for data retrieval across taxonomic space. Database (Oxford) 2011;2011:bar030. doi: 10.1093/database/bar030. [DOI] [PMC free article] [PubMed] [Google Scholar]