Significance
The thymus generates the repertoire of disease-fighting T lymphocytes, affording lifelong host protection against infectious organisms and other pathogens. To achieve this goal, a microinductive environment converts precursors into millions of distinct functional T cells. Because each T lineage cell displays a clone-specific T-cell receptor (TCR) that is generated through stochastic (i.e., haphazard) recombination events, the specificities of thymocytes must be interrogated, and those expressing useless or harmful TCRs are removed before their exit from the thymus. Here, we show that repertoire selection begins at a stage preceding the one currently identified. The pre–T-cell receptor, previously thought to operate autonomously, has robust ligand binding behavior to initiate the first stage of this process.
Keywords: pre–T-cell receptor, NMR spectroscopy, biomembrane force probe, thymic development, repertoire selection
Abstract
Adaptive cellular immunity requires accurate self- vs. nonself-discrimination to protect against infections and tumorous transformations while at the same time excluding autoimmunity. This vital capability is programmed in the thymus through selection of αβT-cell receptors (αβTCRs) recognizing peptides bound to MHC molecules (pMHC). Here, we show that the pre-TCR (preTCR), a pTα-β heterodimer appearing before αβTCR expression, directs a previously unappreciated initial phase of repertoire selection. Contrasting with the ligand-independent model of preTCR function, we reveal through NMR and bioforce-probe analyses that the β-subunit binds pMHC using Vβ complementarity-determining regions as well as an exposed hydrophobic Vβ patch characteristic of the preTCR. Force-regulated single bonds akin to those of αβTCRs but with more promiscuous ligand specificity trigger calcium flux. Thus, thymic development involves sequential β- and then, αβ-repertoire tuning, whereby preTCR interactions with self pMHC modulate early thymocyte expansion, with implications for β-selection, immunodominant peptide recognition, and germ line-encoded MHC interaction.
The thymus provides discrete microenvironments for both commitment and stepwise maturation of multipotent hematopoietic progenitors to the T lineage. The earliest progenitors enter at the corticomedullary junction as CD4−CD8− [double-negative (DN)] CD44+CD25− (DN1) cells, extensively proliferate, and consecutively progress through DN2 (CD4−CD8−CD44+CD25+), DN3 (CD4−CD8−CD44−CD25+), and DN4 (CD4−CD8−CD44−CD25−) stages in the outer cortex before becoming CD4+CD8+ double-positive (DP) cortical thymocytes, where proliferation is largely curtailed (1, 2). T-cell receptor-β (TCRβ) gene locus rearrangement and expression first occur at the DN3 stage, whereas those of the TCRα locus follow at the DP stage. At the DN stages, Notch without and then with pre-TCR (preTCR) signaling facilitates proliferation and differentiation, whereas at the DP stage, αβTCR signaling is key for developmental progression (reviewed in ref. 3). Repertoire selection eliminates useless (nonselectable) or potentially dangerous (strongly self-reactive) TCR specificities and is initiated at the DP stage, processes referred to as death by neglect and negative selection, respectively. Contemporaneously or temporally bracketing those processes, positive selection gives rise to CD4+CD8− and CD4−CD8+ single-positive thymocytes. Positively selected cells migrate to the thymic medulla to complete selection and functional maturation before peripheral egress as T lymphocytes. Within the medulla, CD4+ single-positive thymocytes undergo transcriptional regulator autoimmune regulator (AIRE)-dependent negative selection (4).
Running the thymic selection gauntlet is an arduous process, with only 1% or less of the preselection TCR repertoire observed in the postselection compartment (5). Furthermore, subpopulation kinetic analysis reveals that, although early progenitors give rise to 50 million thymocytes per day in the mouse, only 1 million thymocytes exit to the peripheral lymphoid compartment (6). Chemokines as well as plexin–semaphorin interactions orchestrate movement of thymocytes along the various developmental niches (7–9).
The first major checkpoint in early thymic development is referred to as β-selection, where signaling through the preTCR terminates β-locus rearrangements, rescues cells from apoptosis, and induces significant additional expansion of progenitors (10). Through this process, DN thymocytes are enabled to differentiate to DP thymocytes, facilitating TCRα gene rearrangementsand the generation of millions of αβTCRs encoding distinct specificities for peptides bound to MHC molecules (pMHC) through paired Vα and Vβ domains of the TCR V module (ref. 11 and references therein). Earlier work in vitro and in vivo (12) has suggested that preTCR signaling function is autonomous. Based on lattice packing in an X-ray crystallographic study, it was further speculated that the activated preTCR might form a superdomain of two preTCRs sitting close to the membrane in an antiparallel fashion with ligand binding precluded (13). However, the murine preTCR possesses an additional glycan at pTα N101, which would prevent formation of such a superdomain. In addition, recent β-chain X-ray structures (14) suggest a preTCR model where the receptor, with a Vβ domain that is not paired with Vα, can, nevertheless, extend from the thymocyte membrane in an upright orientation as a monomer or dimer, providing an alternative model of preTCR function.
Given that camelids possess a functional class of antibodies devoid of light chain (15) (unlike typical antibodies with paired heavy and light chains) and that antibody VH domains in mammals are often major determinants of antigen affinity and specificity (16), we reasoned that the Vβ could be capable of interacting with pMHC ligands. It has already been observed that endogenous retroviruses and bacterial superantigens interact independently with mature αβTCR Vβ domains (17). We, thus, hypothesized that ligand binding could have an effect on pTα-β–mediated early thymic development, with the potential for β to bind ligand, using the canonical complementarity determining region (CDR) loops as well as the exposed Vβ patch region. In this study, we report that the preTCR shows all of the hallmarks of a functional receptor, with ligand binding, specificity tied to CDR loops, and functional effects linked to ligand binding regions. Furthermore, we are able to measure single-bond properties of preTCR–pMHC interactions to show that the preTCR maintains mechanical characteristics now known to be important for mature αβTCR function (18, 19).
Results
PreTCRβ Subunit Displays Structural Elements with Potential for Antigen Recognition.
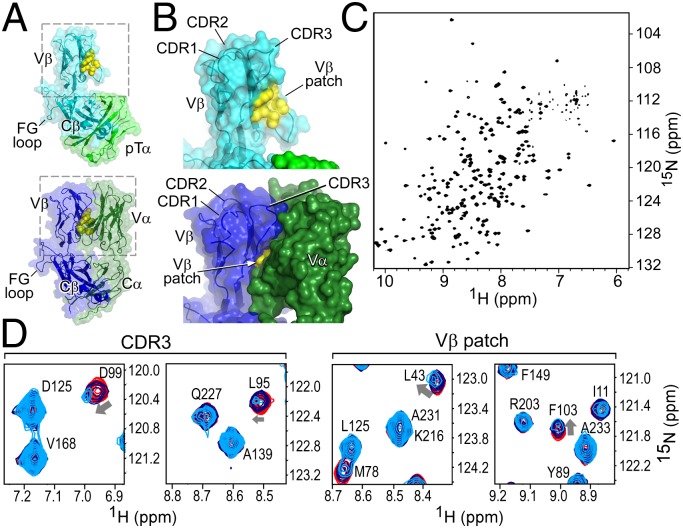
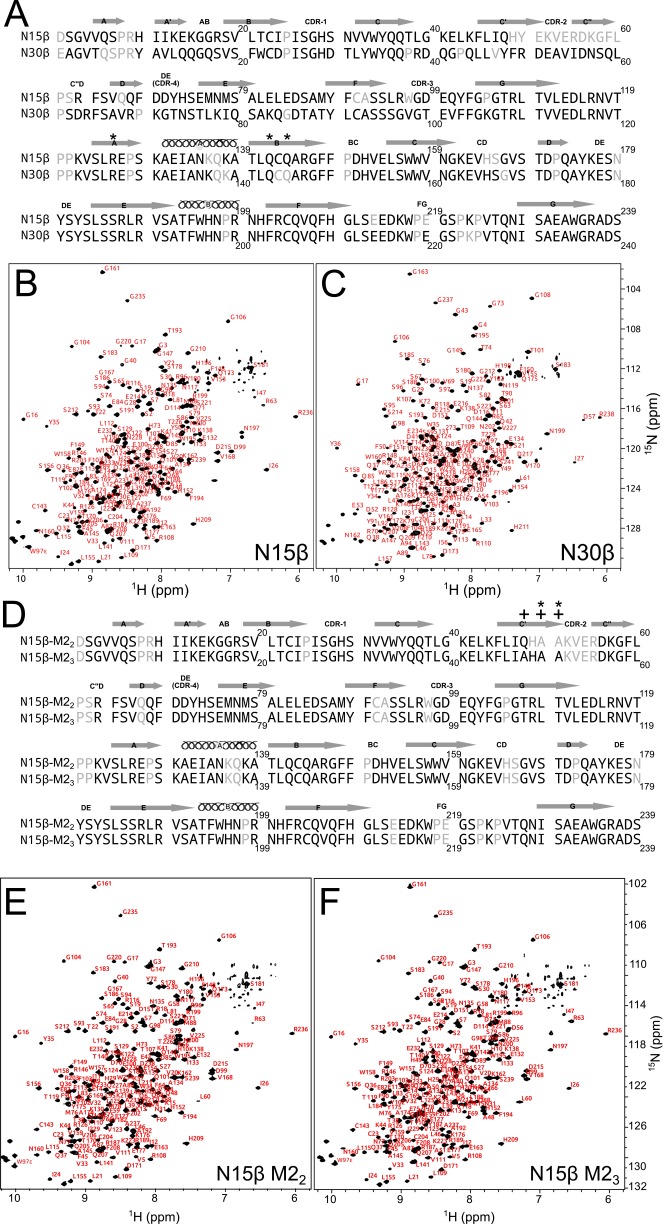
The structures of TCRβ subunits (i.e., chains) are quite similar in conformation of CDR loops and the Cβ FG loop, whether they are part of pTα-β (13) or TCRαβ heterodimer (20) (Fig. 1A) or alone (14, 21). Additionally, the preTCR unmasks a hydrophobic patch (13, 14) of Vβ that is not surface-exposed on the mature TCRαβ molecule (Fig. 1B). Using NMR methods to examine N15β (22) in isolation, we found it to be folded (Fig. 1C) with a well-dispersed 1H-15N transverse relaxation optimized spectroscopy (TROSY)-heteronuclear single quantum coherence (HSQC) spectrum. Three point mutations (Table S1) within the Cβ domain were made to ensure that nonspecific binding did not occur at the hydrophobic pTα– or Cα–Cβ interface site (20) (Fig. 1A) that is inaccessible in all surface-expressed preTCR or TCR molecules. NMR backbone assignment coverage (Fig. S1 A–C) was sufficient to allow us to test binding of this and N30β, which uses an entirely different Vβ germline segment (Vβ13 vs. Vβ5.2 for N15β), for recognition of the cognate ligand of their respective TCRαβ receptors: the vesicular stomatitis octapeptide (VSV8) bound to Kb (VSV8/Kb) (22).
Fig. 1.
The structure of the β-subunit when incorporated into pTαβ or TCRαβ heterodimers suggests that the preTCR has ligand binding properties. (A and B) Structures of the (Upper) pTα/LC13β preTCR [Protein Data Bank (PDB) ID code 3OF6] and (Lower) N15αβTCR (PDB ID code 1NFD) heterodimers. (A) The overall fold of β remains consistent within pTαβ compared with within TCRαβ. (B) Highlight of Vβ domain and CDR loops within pTαβ and αβTCR. The hydrophobic Vβ patch, which is exposed in pTαβ but not in TCRαβ, is shown in yellow. (C) TROSY-HSQC spectrum of N15β (with backbone residue assignments overlaid in Fig. S1B) showing spectral dispersion consistent with the β sheet-rich fold of the β-subunit. (D) Select regions of overlaid TROSY-HSQC spectra of 200 μM 1H-15N N15β alone (red) and with the addition of 200 (blue) or 500 μM (cyan) unlabeled VSV8/Kb. Chemical shift changes are highlighted for residues D99 and L95 of CDR3 and L43 and F103 of the Vβ patch. Note the lack of changes in C-domain residues, for example, D125, A139, V168 or A233.
Table S1.
Mutants used in cellular and NMR experiments
| TCRβ* | Name | Region | Changes† |
| N15 | C domain | Cβ–Cα interface | F126R/V142Q/L144Q |
| N15 | M22 | CDR2 | Y50A/E51A |
| N15 | M23 | CDR2 | Q48A/Y50A/E51A |
| N15 | W97A | CDR3 | W97A |
| N15 | MP1 | Vβ patch | F103A |
| N15 | MP2 | Vβ patch | L43A/F103A |
| N15 | MP3 | Vβ patch | Q37A/L43A/F103A |
| N30 | C domain | Cβ–Cα interface | F127R/V143Q/L145Q |
| N30 | M1 | CDR1 | S27A/H29A/D30A |
| N30 | M2 | CDR2 | D51A/E52A |
| N30 | M3 | CDR3 | S96G/Δ(G97-V102) |
| N30 | M12 | CDR1/2 | M1 + M2 |
| N30 | M123 | CDR1/2/3 | M1 + M2 + M3 |
For cellular transductions, all mutants are derived from WT β. For NMR studies, N15β WT and mutants M22, M23, and W97A are derived from the C-domain mutant F126R/V142Q/L144Q, and N30β refers to the C-domain mutant F127R/V143Q/L145Q.
Numbering according to Fig. S1.
Fig. S1.
β-Sequences with secondary structure and NMR assignments annotated. (A) N15β and N30β sequences are shown with secondary structure assignments taken from Zhou et al. (14). Assigned residues are in black, and unassigned residues are gray; 201 of 226 possible (i.e., non-Proline and non-N terminus) residues (89%) were assigned for N15β, whereas 212 of 225 (94%) were assigned for N30β. *Cβ hydrophobic residues mutated for specificity (F126R/V142Q/L144Q; N15β numbering). (B and C) 1H-15N transverse relaxation optimized spectroscopy (TROSY)-heteronuclear single quantum coherence (HSQC) spectrum of (B) N15β and (C) N30β with backbone residue assignments overlaid shows spectral dispersion and completeness of assigned spectra. (D) N15β M22 and M23 sequences are shown with secondary structure assignments as in A; 205 of 226 possible residues (91%) were assigned for N15β-M22, whereas 208 of 226 (92%) were assigned for N15β-M23. *Mutated residues within M22. +Mutated residues within M23. (E and F) 1H-15N TROSY-HSQC spectrum of (E) N15β M22 and (F) M23 with backbone residue assignments overlaid shows that the essential structure of β is undisturbed (compare with each other and N15β WT in B).
β-Chain Interaction with pMHC Revealed by NMR Chemical Shift Titration Analysis.
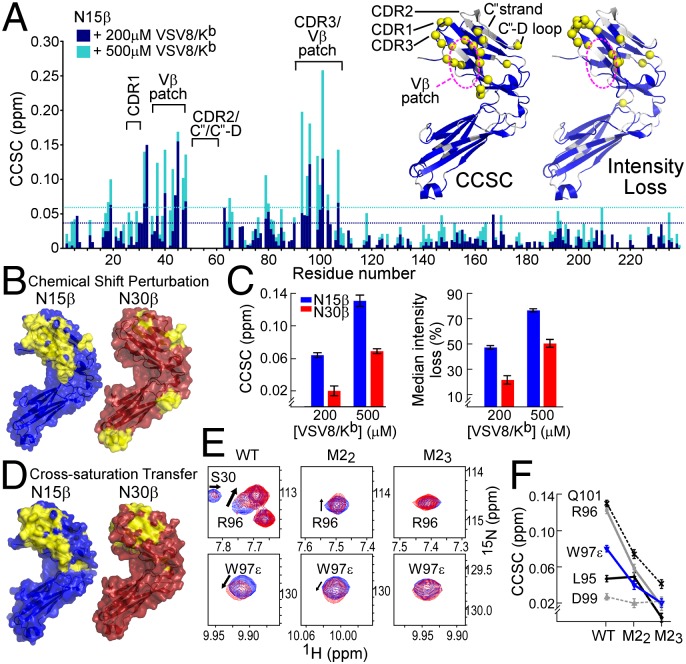
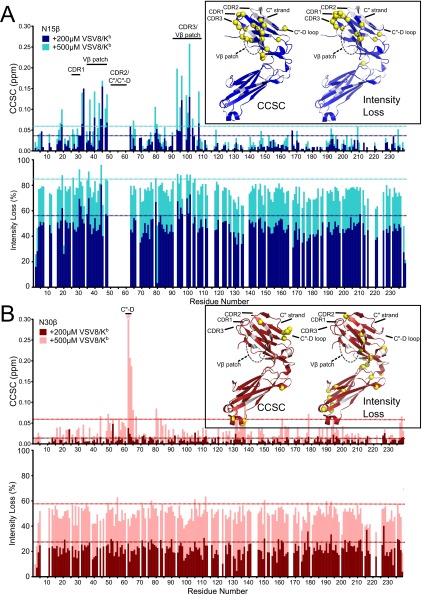
In NMR-based titration experiments, where unlabeled VSV8/Kb was added to 15N-labeled N15β, there were significant chemical shift changes within only the Vβ domain, indicating an interaction in solution (Figs. 1D and 2 A and B and Fig. S2A) (23). Additionally, there was a loss of intensity for those residues at the binding interface (Figs. 1D and 2A and Fig. S2A), suggesting an interaction in the intermediate exchange regime for NMR measurements, with exchange rates on the order of 1–100 s−1 (23). The region affected by the binding event seems to include the assigned CDR1, CDR3, and the Vβ patch (14, 20) (Fig. 1 A and B and Fig. S2A). The Vβ patch is notably hydrophobic and contains conserved residues uniquely exposed in the preTCR (Fig. S3A) (13, 14). For N30β, the largest chemical shift changes on interaction in solution are not localized to a particular region but rather, distributed throughout the molecule (Fig. 2B and Fig. S2B) as are resonance peak intensity losses (Fig. S2B). With the exception of the N30β C″D loop, the magnitude of the largest chemical shift changes (Fig. 2C and Fig. S2) is lower for N30β than for N15β along with the median losses of peak intensity (Fig. 2B and Fig. S2) as the β-subunit forms a complex with pMHC and increases in size from 27 to 71 kDa (23). Taken together, these data lead us to conclude that pMHC binding to Vβ CDRs or patch is weaker for N30β than for N15β, because interactions with these elements are not specifically detected using chemical shift change or intensity measurements. Median intensity losses (Fig. 2C) similarly argue that the affinity is lower for N30β than for N15β. NMR-based titration of N15β with VSV8/Kb yielded a Kd = 390 ± 50 μM (Fig. S3B), a 3D (i.e., solution) affinity well within the range known to have a physiologic influence on T-cell signaling (24).
Fig. 2.
β-Interaction with pMHC in solution as characterized by NMR. (A) The 2D 1H-15N HSQC spectra of 15N-N15β were acquired alone or with 200 (dark blue bars) or 500 μM (light blue bars) VSV8/Kb. Combined 1H and 15N chemical shift change (CCSC) was calculated for each residue. Dotted lines, which are color-coded like bars, indicate 1 SD above median CCSC. Inset is the ribbon representation [Protein Data Bank (PDB) ID code 3Q5Y] of (Left) CCSC analysis or (Right) intensity loss (detailed in Fig. S2A) of VSV8/Kb interaction with N15β. Amide protons exhibiting (Left) significant CCSCs or (Right) intensity losses are shown in yellow spheres in Inset. Regions corresponding to unassigned residues are white. (B) Solvent accessible surface representations of (Left) N15β (PDB ID code 3Q5Y) and (Right) N30β (PDB ID code 3Q5T) ectodomains with significant CCSCs colored yellow on surfaces within 6 Å of measured HN; β- and VSV8/Kb concentrations were 200 μM. Similar results were obtained at 500 μM ligand (Fig. S2). β Is shown rotated ∼120° about the y axis relative to Fig. 1 A and B. (C) Comparison of N15β and N30β interaction with VSV8/Kb. (Left) The 95th percentile of CCSC on mixing 200 or 500 μM VSV8/Kb with 200 μM N15β or N30β. Error bars indicate SD of CCSC for peaks not affected by ligand addition. (Right) Median peak intensity losses of spectral peaks on addition of 200 or 500 μM VSV8/Kb to 200 μM N15β or N30β. Error bars indicate propagated error using noise levels within NMR spectra. (D) Cross-saturation analysis. Surface representations of (Left) N15β and (Right) N30β ectodomains, with surfaces within 6 Å of HN exhibiting significant cross-saturation losses (detailed in SI Materials and Methods) shown in yellow. Representative spectral data and details of interacting surfaces are in Fig. S3 C–E. (E and F) Chemical shift perturbation of βCDR3 residues among N15β and CDR2 mutants. (E) Spectral regions of 1H-15N TROSY-HSQC showing R96 or W97ε within CDR3 in the presence (red) or absence (blue) of VSV8/Kb for N15β, M22, or M23. Arrows show directions of change in chemical shift; smaller changes are seen for the CDR2 mutants than for the WT. (F) CCSC of indicated CDR3 residues is less with VSV8/Kb addition for M22 or M23 CDR2 variants vs. the WT N15β. Near-complete backbone assignments for M22 and M23 are shown in Fig. S1 D–F.
Fig. S2.
Chemical shift perturbation and peak intensity analysis of N15β– and N30β–VSV8/Kb interaction. The 2D 1H-15N HSQC spectra of (A) 15N-N15β or (B) 15N-N30β were acquired alone or with 200 (dark blue or red bars) or 500 μM (light blue or red bars) VSV8/Kb. (Upper) Chemical shift change (CCSC) was calculated for each residue. Dotted lines are color-coded like bars and indicate 1 SD above median CCSC. (Lower) Intensity loss is plotted relative to unligated β. Dotted lines indicate 1 SD above median intensity loss. (A) N15β shows significant changes on addition of VSV8/Kb. Highlighted are changes in CDR1, CDR3, and the Vβ patch regions, which are progressively larger with the addition of more VSV8/Kb. The CDR2, C″ strand, and C″D loop are unassigned. Inset shows ribbon representation of (Left) CCSC analysis or (Right) intensity loss of VSV8/Kb interaction with N15β. Amide protons exhibiting significant (Left) CCSCs or (Right) intensity losses are shown in yellow spheres. Regions corresponding to unassigned residues are white. CCSC data and structural representations in Inset are reproduced from Fig. 2A to aid comparison with N30β. (B) N30β shows nonspecific changes distributed throughout the molecule. Highlighted are C″D loop residues, which show anomalously large CCSCs for the 500 μM level of VSV8/Kb. This anomaly may be caused by a local ring current shift and does not seem to indicate a large binding surface, because very few residues are affected; also, intensity losses are distributed evenly throughout the molecule. *Residue S63, which has a CCSC = 0.44 ppm. The detail of the N30β–VSV8/Kb interaction is the same as in A.
Fig. S3.
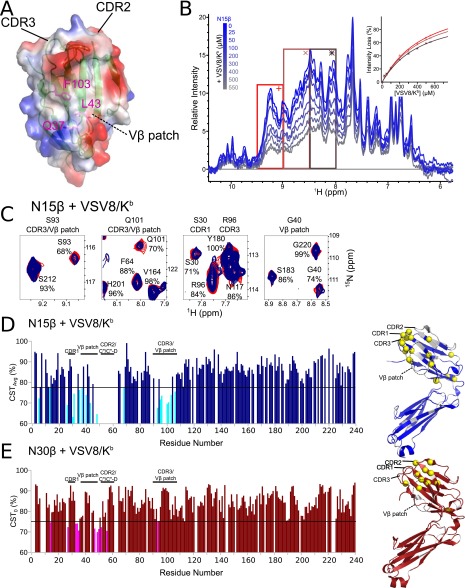
Biophysical characterization of β-pMHC interaction. (A) Surface charge representation of the Vβ patch region showing apolarity (white) of this large central surface within the interaction domain of the preTCR. Residues targeted for mutagenesis are highlighted along with critical structural elements. (B) The 1D 1H-15N HSQC spectra of 15N-N15β were acquired in the presence of variable amounts of VSV8/Kb. Sections of spectra 0.5 ppm in width were integrated individually, and loss of intensity was calculated relative to the spectrum containing only N15β. Loss of intensity for each individual spectral region was then fit to obtain an equilibrium dissociation constant (Kd) using a monovalent ligand binding equation. Goodness of fit was determined by the SE of fit for the Kd, which was found to be acceptable (relative SE ≤ 15%) for the three boxed regions indicated from 8 to 9.5 ppm. Curve fits for these regions plotted individually are shown in Inset. Kd is reported as the average value determined here ± mean of the SE. (C–E) Detail of cross-saturation–defined β-pMHC interaction sites. (C) Spectral regions showing saturation effect for residues in CDR1, -2, and -3 and Vβ patch. Shown are data from the experiment using a 2-s saturation pulse for 200 μM N15β + 200 μM VSV8/Kb as detailed in SI Materials and Methods. The reference spectrum (red) is overlaid with the saturated spectrum (blue). Relative intensities are shown for each identified peak. (D) Plot of cross-saturation transfer averaged over five experiments (CSTAvg) as detailed in SI Materials and Methods. Residues falling in the top 10% are highlighted on the bar chart and using ribbon representation of N15β (Right) ectodomain. Amide protons exhibiting significant cross-saturation losses are shown as yellow spheres. Regions corresponding to unassigned residues are white. (E) Plot of time 0 cross-saturation transfer rate (CST0) determined from five experiments for N30β + VSV8/Kb as detailed in SI Materials and Methods. Top residues affected are highlighted in the bar chart as well as the ribbon representation in Right, similar to D above.
Identification of the pMHC Binding Surface on the β-Chain Through Cross-Saturation Analysis.
To confirm the identity of the interaction contact surface, we used cross-saturation NMR, a technique that highlights areas of direct contact between molecules, unlike chemical shift analysis, which will also reflect allosteric- or self-association–induced changes in residue position (25). Cross-saturation NMR reveals that the binding of N15β with VSV8/Kb (Fig. 2D and Fig. S3 C and D) occurs directly through the same Vβ residues highlighted in the chemical shift change experiment (Fig. 2 A and B). Surprisingly, a direct interaction of N30β with VSV8/Kb (Fig. 2D and Fig. S3E) was detected in an area of the Vβ limited to CDR1 and -2 residues as well as a part of the Vβ patch. These binding surfaces in N15β and N30β are not compatible with a Vβ-mediated dimerization model (13, 14) in ligand recognition. Although the data show that chemical shift changes are more broadly dispersed throughout N30β (Fig. 2 A and B), these events are consequent to secondary or nonspecific interactions rather than highlight a direct contact site with VSV8/Kb. Most importantly, the results suggest that, between these two β-subunits, a common interaction motif exists that supports a weaker interaction with VSV8/Kb in N30β than in N15β.
CDR Residues Are Involved in β-Chain Binding to pMHC.
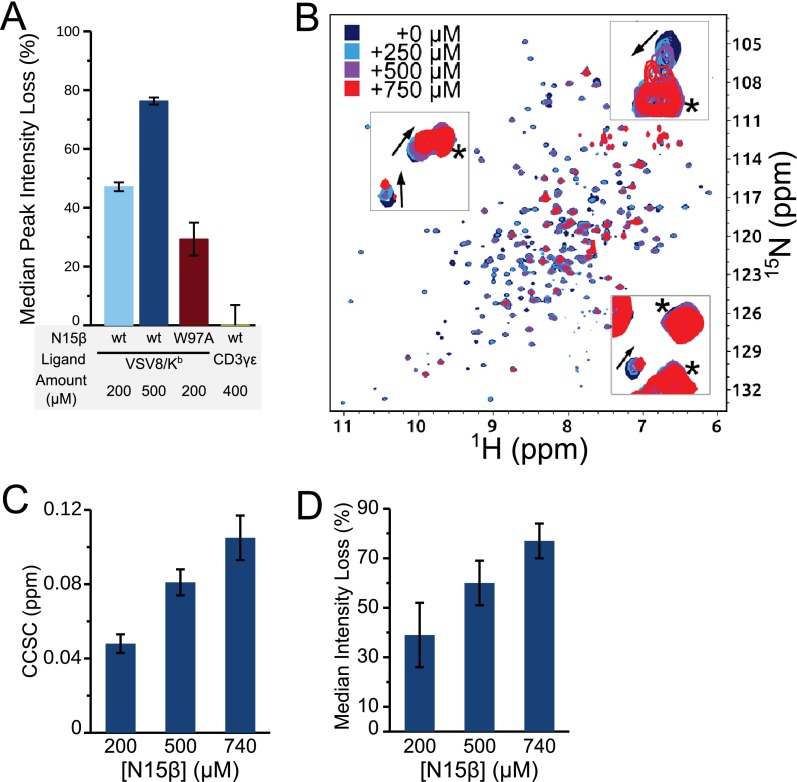
Mutational analysis of the direct interaction between N15β and VSV8/Kb supports an important role for CDR residues in mediating a specific interaction. For example, N15β CDR2 mutants M22 (Y50A/E51A) and M23 (Q48A/Y50A/E51A) (NMR backbone assignments in Fig. S1 D–F) show decreased binding to VSV8/Kb as evidenced by reduced chemical shift perturbations of CDR3 residues (Fig. 2 E and F). Similarly, N15β CDR3 mutant W97A showed decreased binding relative to N15β WT when median intensity losses are compared (Fig. S4A). Confirming the specificity, no significant interaction was observed when N15β WT was mixed with Ig fold-containing protein CD3γε (Fig. S4A). Although backbone assignments could not be obtained for the full-length VSV8/Kb (26), using 15N-labeled H-2Kb heavy chain bound to unlabeled VSV8 and β2m, we were able to observe chemical shift changes and line broadening when N15β was added in increasing concentrations, analogous to that seen with labeled N15β (Fig. S4 B–D). Overall, the interaction between N15β or N30β and VSV8/Kb suggests contributions of conserved, germ line-encoded β-MHC binding events, consistent with prior reports (27, 28) but extending to the preTCR. This interaction may be further modulated by variable CDR3 residues as well as Vβ patch residues within N15β and N30β.
Fig. S4.
Specificity of N15β–VSV8/Kb interaction. (A) Median peak intensity loss on mixing 200 μM N15β W97A with 200 μM VSV8/Kb or 200 μM N15β WT with 400 μM scCD3γε (41). Chemical shift change (CCSC) data for 200 μM N15β WT with 200 and 500 μM VSV8/Kb from Fig. 2B are shown for comparison. (B–D) N15β WT addition to 15N-labeled VSV8/Kb. (B) 1H-15N TROSY-HSQC of VSV8/Kb alone (blue) with increasing levels of N15β WT added. Only the H-2Kb heavy subunit is 15N-labeled. Spectrum was acquired on aBruker 900-MHz Spectrometer with a cryoprobe. Loss of intensity accompanies binding. Insets indicate chemical shift changes, which are denoted by arrows. (*Peaks that do not shift. (C) Combined chemical shift change of the top 5% of changes with addition of N15β. (D) Median peak intensity losses with the addition of N15β. Error bars for C and D are the same as for Fig. 2B.
Single-Bond Lifetime Analysis of Complete preTCRs with pMHC Ligands Uncovers Broadened Specificities.
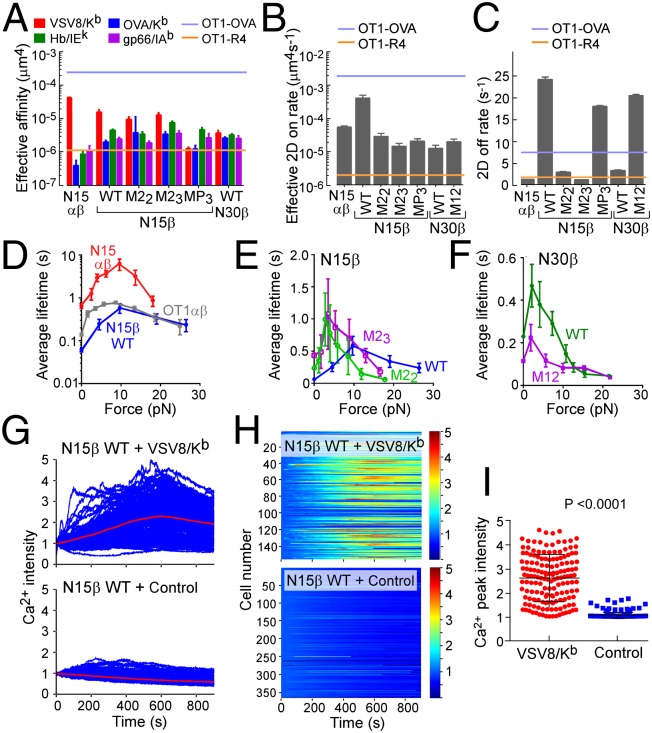
Micropipette and biomembrane force-probe (BFP) analyses can be implemented to measure in situ binding affinity, kinetic rates, and force-dependent single-bond lifetimes between cell surface receptors and their ligands using an approach entirely orthogonal to solution methods (18). We used various pMHC ligands to ascertain if any interaction is observed with preTCR on retrovirally transduced SCID.adh immature (CD4−/CD8+) thymocytes, which lack TCRα and -β chains but express all CD3 subunits and pTα. Biotinylated VSV8/Kb was bound to the surface of a micropipette-aspirated RBC or a glass bead attached to the RBC apex and used to analyze binding with SCID.adh cells expressing N15αβTCR, pTα/N15β WT, pTα/N30β WT, or indicated preTCR variants on the surface (Fig. 3A and Fig. S5 A–D). To exclude coreceptor influences, a Kb variant lacking CD8 binding was used throughout (18). Binding events were observed for N15αβTCR, N15β WT, mutants, and N30β WT (Fig. 3A), with N15β WT possessing the highest 2D affinity of the tested preTCRs. No binding occurred in control cells lacking TCRα and -β (Fig. S5E). The specificity of the N15αβTCR is considerably more precise than that of WT or mutant N15β-containing preTCRs, where interactions with cognate VSV8/Kb and OVA/Kb, gp66/I-Ab, or Hb/I-Ek are more similar (Fig. 3A). Intriguingly, N15β M23 seems to possess increased cross-reactivity compared with WT or M22 (Fig. 3A), suggesting that the mutation of residue Q48 relieves some constraints on specificity. Mutagenesis of the β-patch region (N15β patch triple mutant MP3) strongly affects binding to Kb ligands VSV and OVA while not adversely affecting interaction with either pMHCII ligand. Each preTCR tested exhibits unique kinetic properties, with the N15β WT possessing the highest on rate, although this on rate is tempered by a concomitant faster off rate (Fig. 3 B and C). Notwithstanding, the 2D affinity of the preTCR for its ligands is comparable with the weak OT1 TCR-R4/Kb altered peptide ligand interaction that mediates positive selection of OT1 αβTCR transgenic thymocytes (29), implying that such measured preTCR–ligand interactions might be important in thymocyte fate involving preTCR-expressing DN thymocytes (vide infra). This R4 peptide differs from the negatively selecting cognate OVA specificity (SIINFEKL) by a single N to R amino acid substitution at the p4 position.
Fig. 3.
Biophysical characterization of pMHC binding to and signaling by cell surface preTCR. (A) Effective 2D affinity was calculated from adhesion frequencies of each of the indicated receptors with the cognate ligand VSV8/Kb, an unrelated peptide bound to the same allele of MHCI (OVA/Kb), or unrelated peptides bound to two MHCII alleles (gp66/I-Ab and Hb/I-Ek). Shown for reference are the 2D affinities for the OT1 αβTCR interaction with its cognate peptide ligand OVA/Kb or the weak Arg-substituted altered peptide ligand R4/Kb. (B and C) Effective (B) 2D on rates and (C) 2D off rates for preTCRs compared with N15αβ. Shown for reference are the 2D rates for the OT1 αβTCR interaction with OVA/Kb or the altered peptide ligand R4/Kb. (D–F) Average bond lifetime measures of cell surface N15β WT, N30β WT, N15β variant preTCRs, or N15αβTCR binding to VSV8/Kb as a function of force. (D) N15αβ vs. N15β WT. The lifetimes of OT1 αβTCR-OVA/Kb interaction are shown for comparison. (E) N15β WT vs. M22 and M23. (F) N30β WT vs. N30β M12. (G–I) Ca2+ triggering of preTCR-expressing cells by VSV8/Kb in a microfluidic cell trap chip. (G) Superposition of individual Ca2+ response traces for N15β WT on exposure to (Upper) VSV8/Kb or (Lower) BSA control-treated surfaces. (H) Heat map showing individual Ca2+ responses, which are indicated by the colorimetric scaling of relative fluorescence signal in arbitrary units for data shown in G. (I) Maximal Ca2+ intensities for individual cells from G and H. P value was determined using Student’s t test.
Fig. S5.
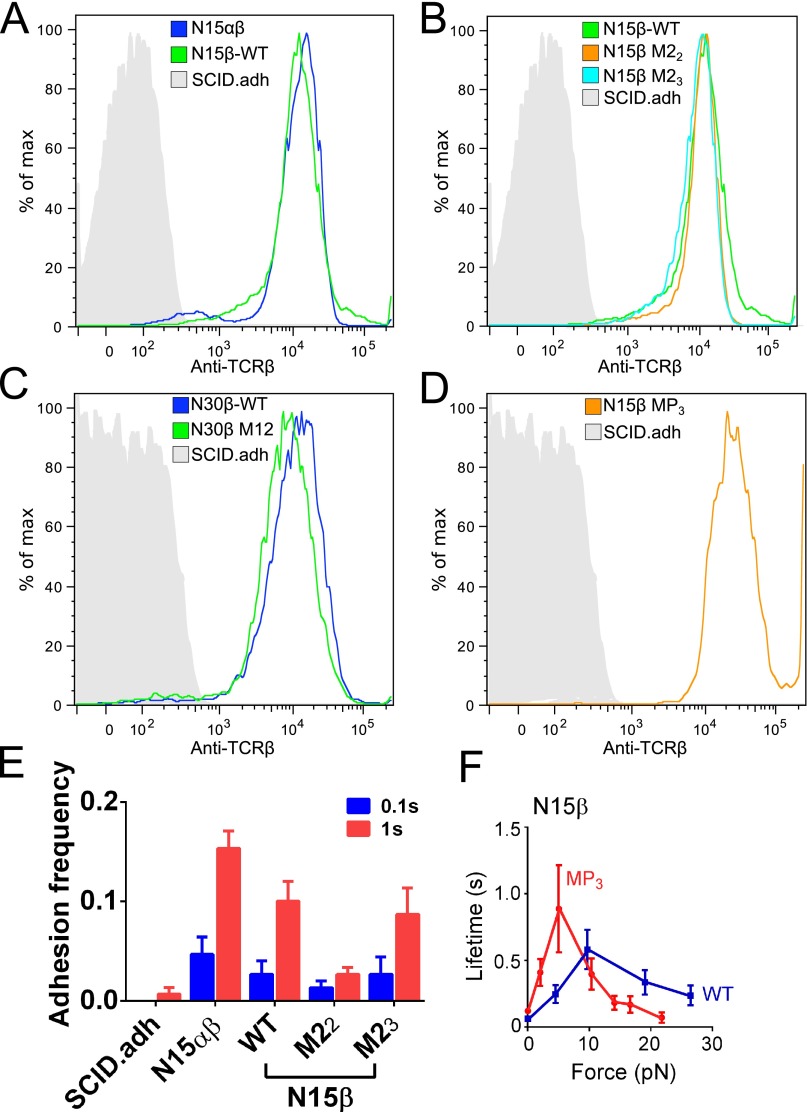
BFP characterization of surface-expressed TCRαβ or preTCR. (A–D) SCID.adh parental cell line lacking TCRα and -β was retrovirally transduced with either N15αβ or the indicated β and assayed by FACS using anti-TCR antibody H57. (A) N15αβ, N15β WT, and SCID.adh parental. (B) N15β WT, N15β M22, N15β M23, and SCID.adh. (C) N30β WT, N30β M12, and SCID.adh. (D) N15β MP3 and SCID.adh. (E) SCID.adh parental cell line lacking TCRα and -β showed no adhesion when probed with VSV8/Kb using 0.1- and 1-s contact times. (F) Force lifetime curves for N15β WT vs. MP3 show maximal lifetime at a lower force for MP3. WT data are from Fig. 3 D and E for comparison.
PreTCR Binding to pMHC Ligands Is Force-Dependent.
We next ascertained whether the preTCR displays a dynamic binding response under force as seen for the mature αβTCR using BFP (18). For N15αβ, TCR–pMHC bond lifetime increases with application of force, reaches a maximum at 10 pN, and then decreases as additional force is applied (Fig. 3D), characteristic of catch bond formation. The N15β WT preTCR (pTα-β WT) shows a weaker catch bond at 10 pN (0.6-s peak lifetime) but nevertheless manifests peak equivalent bond lifetime to the OT1 αβTCR (Fig. 3D). Both βM22- and βM23-containing preTCRs form catch bonds with pMHC only below 5 pN force but slip bonds thereafter, which is characterized by increasing force linked to accelerated bond release (Fig. 3E). Bond lifetime modification by force is not unexpected (18, 19, 30) and is not correlated with force-free 3D (31–33) or 2D measurements (28, 34). Thus, prolonged bond lifetime for M23 under force compared with M22 is not inconsistent with the solution NMR analyses, where binding is force-free and occurs in the absence of biomembrane constraints. N30β WT, in contrast to N15β WT, shows only slip bonds effectively at and above 5 pN (Fig. 3F), although at all forces, the bond lifetime for CDR1 and -2 mutated N30β (M12) remains shorter than for the N30β WT. N15β MP3 displays a force lifetime profile similar to that of the M22 and M23 mutants (Fig. S5F), suggesting that both CDR and patch regions contribute to the mechanism of the catch bond in the preTCR.
PreTCR Ligation by pMHC Initiates Calcium Flux.
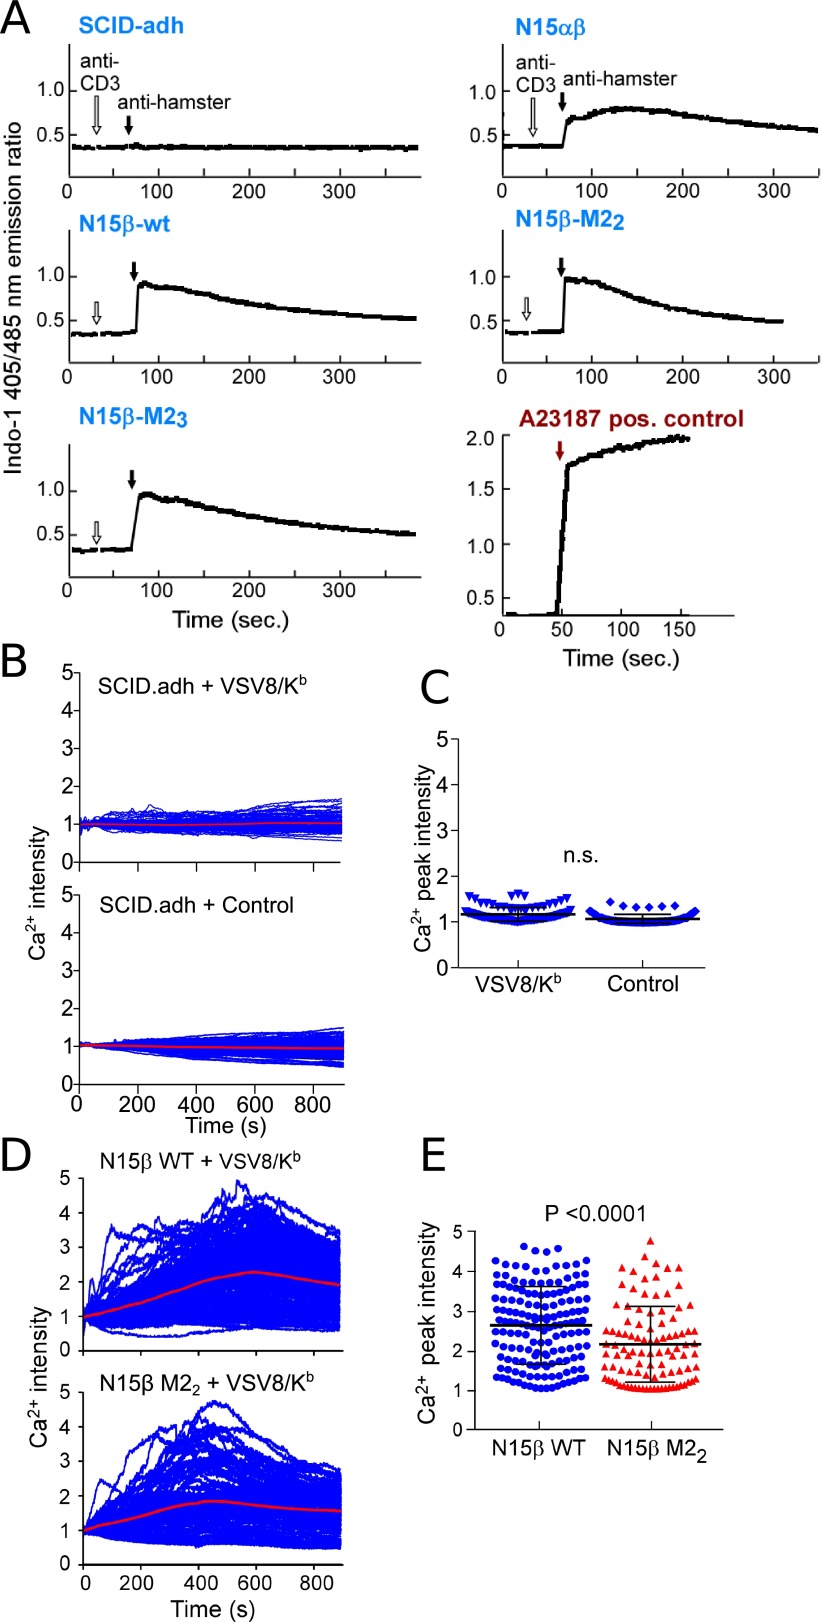
It has been previously reported that the calcium response of pre-T cells remains intact after triggering with anti-CD3 antibodies (35), a phenomenon that we recapitulated in β-transduced SCID.adh cells (Fig. S6A). Moreover, the presence of mutations within β does not affect the ability of the preTCR complex to signal through CD3, indicating that each construct is part of a functional cell surface receptor (35). To determine if pMHC ligand could activate Ca2+ flux in the same cells, N15β WT preTCR-expressing SCID.adh cells were individually monitored for Ca2+ triggering (Fig. 3 G and H) after loading into a microfluidic device (36) with VSV8/Kb (Fig. 3 G, Upper and H, Upper) or BSA control protein (Fig. 3 G, Lower and H, Lower) coupled to the surfaces. N15β WT robustly drives signaling in the presence of VSV8/Kb, which was revealed by the comparison of Ca2+ peak intensity measurements (Fig. 3I). Untransduced SCID.adh cells are not activated by either control or VSV8/Kb-coupled surfaces (Fig. S6 B and C). Mutagenesis of CDR2 partially abrogates Ca2+ flux generated by interaction with VSV8/Kb-treated surfaces (Fig. S6 D and E).
Fig. S6.
Calcium flux triggered by activation of preTCR. (A) SCID.adh cells were retrovirally transduced with N15 β-variants (WT, M22, and M23) only or N15-TCRα and -β and then sorted based on the surface staining of H57-597 antibody (against TCRβ) to match surface receptor expression. SCID.adh cells (TCR negative control) or sorted SCID.adh cells were loaded with Indo-1 (1 μg/mL). Calcium flux was recorded as follows: at 30 s, anti-CD3 (145-2c11; 5 μg/mL) was added (open arrows), and at 1 m, anti-hamster IgG (10 μg/mL) was added (closed arrows). Calcium flux is represented as the Indo-1 405/485-nm emission ratio. TCRαβ-positive 257–20-109 DP cells were used for calcium flux positive control and triggered using A23187 calcium ionophore (red arrow). (B) Individual calcium fluorescence measurement traces of untransduced SCID.adh cells loaded into multiwell microfluidics chambers coated with (Upper) VSV8/Kb or (Lower) BSA control protein. Measurements were completed at 37 °C. (C) Peak Ca2+ intensities for all measurements shown in B. Each dot represents the measurement of one cell. No significance of difference (n.s.) between VSV8/Kb or control surfaces as evaluated using Student's t test. (D) Individual calcium fluorescence measurement traces of N15β (Upper) WT- and (Lower) M22-transduced SCID.adh cells loaded into multiwell microfluidics chambers coated with VSV8/Kb. Measurements were completed at 37 °C. (E) Peak Ca2+ intensities for all measurements shown in D. Each dot represents the measurement of one cell. P value evaluated using Student's t test is shown.
Thymocyte Development Is Impacted by preTCR β-Chain CDR or Patch Mutations.
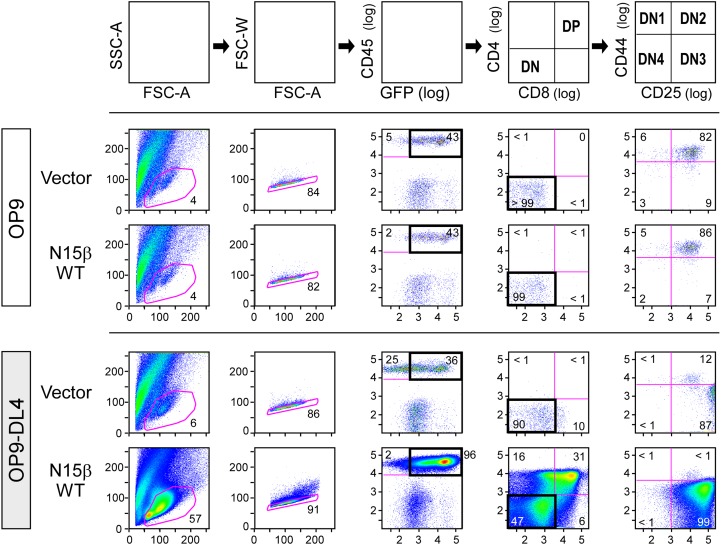
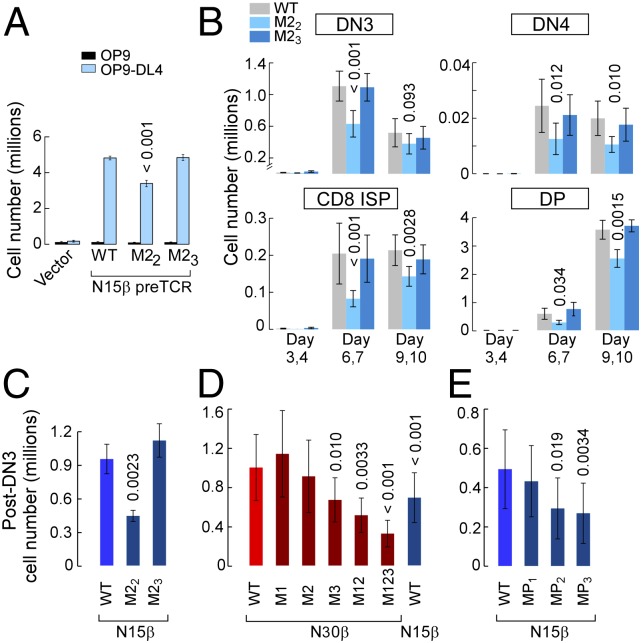
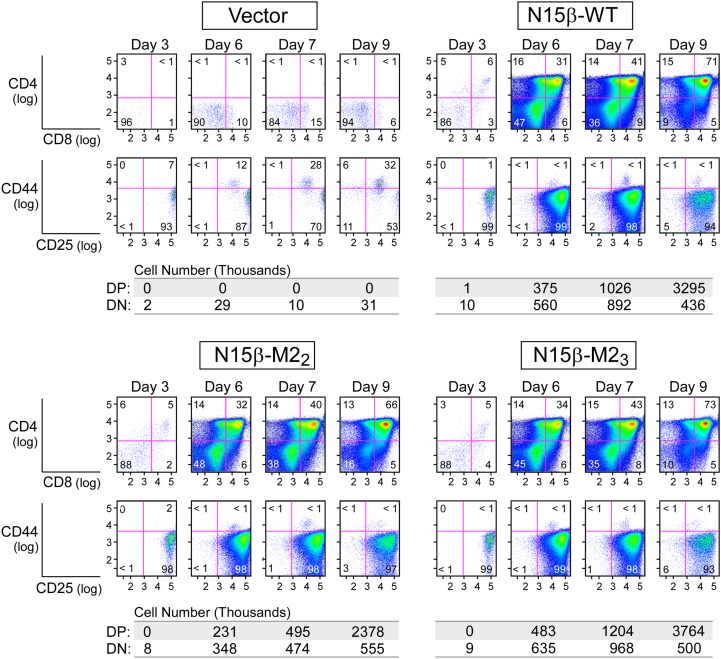
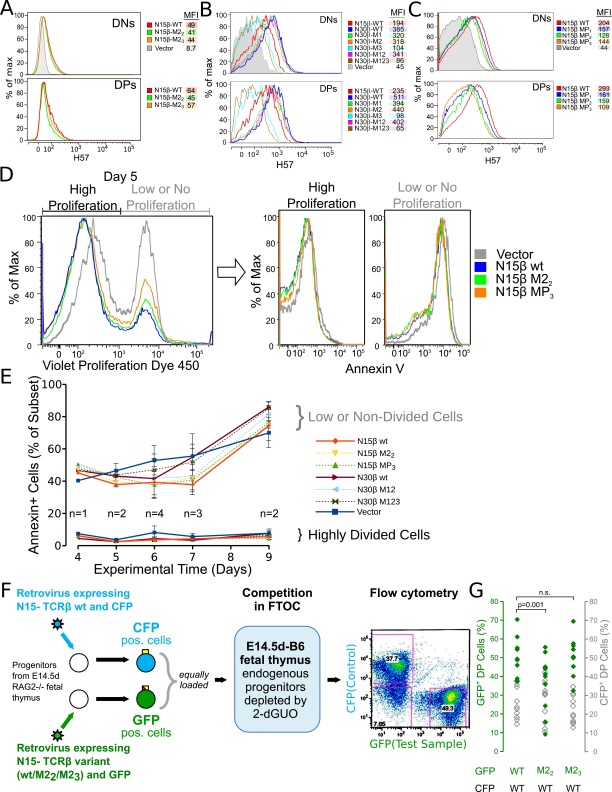
To test whether Vβ CDR2 mutations impact DN thymocyte proliferation and developmental progression, progenitor stem cells were cultured on OP9-DL4 stroma after isolation from fetal livers of B6 Rag2−/− mice, progression to the DN3 stage, retroviral transduction with β, and FACS sorting as described (37). The kinetics of thymocyte expansion as well as progression from DN3 to DP were then followed (Fig. S7). With the OP9 parental cell line lacking the Notch ligand DL4, essentially no proliferation or development is observed (Fig. 4A and Fig. S7). However, when placed on the OP9-DL4 cultures, a 2,500-fold expansion occurs for WT N15β-transduced thymocytes but not for vector controls (Fig. 4A and Figs. S7 and S8), recapitulating previous findings regarding the importance of both Notch and preTCR signaling in development. The total number of cells after 10 d of culture was greater for the WT N15β or M23 β-transduced cultures compared with the mutant M22β (Fig. 4A). This difference is because of an apparent proliferative advantage within the DN3 stage, resulting in more cells transitioning through DN4 and CD8 immature single positive into DP (Fig. 4B). When comparing numbers of cells transitioned from DN3 to DN4 and beyond relative to WT, significantly fewer cells bearing the M22 mutation but similar numbers of M23 cells were found after 6–7 d in culture (Fig. 4C), suggesting a significant role for ligand recognition within the DN3 to DP developmental transition. Using N30β, we found deficiencies in developmental progress for mutants of CDR3 (M3) and combined mutation of CDR1 and -2 (M12) and CDR1, -2, and -3 (M123) but not individual mutagenesis of CDR1 or -2 (M1 or M2, respectively) (Fig. 4D). N30β also produced significantly more developed cells than N15β in this system (Fig. 4D). When residues within the Vβ patch region are mutated to alanine in N15β, progressively fewer cells successfully transitioned beyond DN3 as more residues within the patch were altered (Fig. 4E). Cell surface expression levels could not account for differences between WT and mutated β-subunits (Fig. S9 A–C). Apoptosis was prevalent in nondividing cells relative to those that were proliferating rapidly (Fig. S9D), but developed cellularity was not caused by any direct change in apoptotic rate between WT- and mutant-β, because Annexin levels showed no dependence on β-subunit identity (Fig. S9E). The OP9-DL4 stromal cell findings were validated in a separate assay using a two-color retroviral internal ribosome entry site (IRES) system, allowing control of interlobe variability within the fetal thymic organ culture system, which recapitulates a more complete thymic inductive environment (Fig. S9F) (38). In this assay as well, the M22 β-chain attained lesser cellularity than WT N15β, whereas the M23 β-chain did not differ significantly from WT (Fig. S9G).
Fig. S7.
Gating strategy in the transduced thymocyte OP9-DL4 stromal cell culture system. N15β WT or vector-only transduced thymocytes were cultured with OP9 parental or OP9-DL4 stromal cells. Day 6 of culture is shown. Gating strategy is shown at the top, and numbers represent percentages in designated quadrants or circumscribed regions of the dot plots.
Fig. 4.
PreTCRβ CDR or Vβ patch mutations modulate proliferation within DN3 and progression from DN3 to DP stages of β-transduced thymocytes in stromal cell systems. (A–C) Developmental effects of CDR2 mutagenesis on N15β-transduced thymocytes; 2,000 sorted DN3 B6 Rag2−/− thymocytes were cultured in the OP9-DL4 system for 9–10 d. Results are shown as averages ± SEMs (n = 4). (A) Total thymocyte numbers at the end of OP9 or OP9-DL4 cultures. (B) Thymocyte numbers in OP9-DL4 cultures at DN3, DN4, CD8 immature single positive (ISP), and DP developmental stages at days 3 and 4, days 6 and 7, or days 9 and 10. (C–E) Number of cells developed beyond DN3 at days 6 and 7 within OP9-DL4 cultures of N15β- or N30β-transduced B6 Rag2−/− thymocytes. Significance of difference with leftmost β-WT is shown above each bar. (C) Developed cells for N15β WT vs. CDR2 mutants. (D) N30β WT vs. CDR mutants and N15β WT (n = 7). (E) N15β WT vs. Vβ patch mutants (n = 7).
Fig. S8.
Time dependence in the transduced thymocyte OP9-DL4 stromal cell culture system. N15β WT, M22, or M23 or vector only transduced thymocytes were cultured with OP9-DL4 stromal cells and analyzed for DN to DP transition (CD4/CD8; row 1) as well as progression within DN (CD44/CD25; row 2). Absolute numbers of cells at each kinetic point in culture are given below each set of FACS plots.
Fig. S9.
Characterization of transduced thymocytes in stromal cell culture systems. (A) β-Transduced thymocytes were cultured with OP9-DL4 stromal cells and analyzed for preTCR expression using anti-Cβ mAb H-57 compared with vector-only transduced controls. Levels are quantitated using mean fluorescent intensities (MFIs). Levels in DN and DP stages after 6–7 d in culture are shown. Vector data are not available for DP, because vector-transduced thymocytes do not develop beyond DN3. (A) N15β WT, M22, or M23 or vector-transduced thymocytes. (B) N30β WT vs. N30β mutants, N15β WT, or vector. (C) N15β WT vs. β-patch mutants or vector. (D and E) AnnexinV levels are inversely correlated with proliferation in OP9-DL4–cultured, β-transduced thymocytes without regard for identity of transductant. (F) Scheme for transduction of B6 Rag2−/− thymocytes with WT or mutant β within two-color FTOC. Flow cytometry panel shows gating of DP thymocytes before quantitating CFP+ (N15β WT; control) or GFP+ cells (N15β WT, M22, or M23; test), allowing for automatic correction for variability because of size or other thymic lobe differences in FTOC. (G) Proportion of GFP+ test β-transductants (WT or mutant; green symbols) and CFP+ control transductants (WT only; gray symbols) within the DP population of doubly transduced thymocytes (n = 11). Actual percentages are given. Note that fewer M22-transduced thymocytes (P = 0.001) after a 7-d FTOC become DP thymocytes relative to WT. In contrast, M23 was not found to be significantly different from WT (P > 0.1), and there were no CFP+ control samples found to differ between groups (P > 0.1). CFP-containing vector was less effective than GFP-containing vector at supporting β WT development in this system, so that a normalized ratio to WT of 0.702 ± 0.082 for M22 and 1.117 ± 0.073 for M23 was also calculated from the mutant GFP/WT CFP ratio divided by WT GFP/WT CFP, supporting the diminished developmental progression capacity of M22.
Discussion
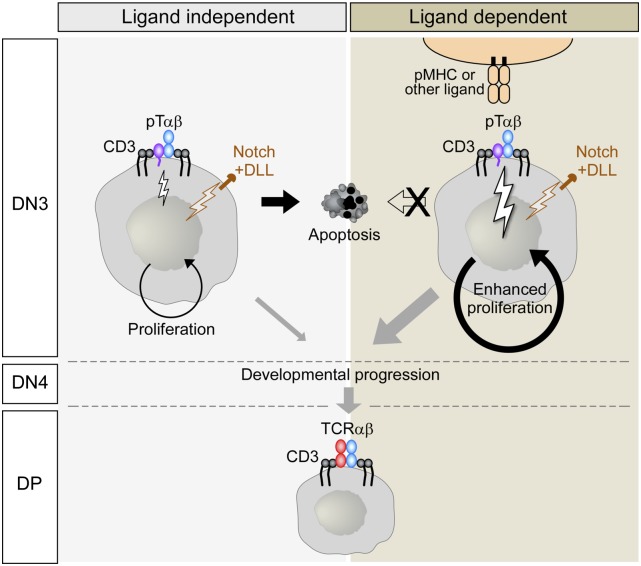
Our experiments clarify some fundamental features of early thymic development (Fig. 5). The β-chain has the interesting dual role of being a structural component of both the preTCR and the mature αβTCR. PreTCR function is critical for αβ–T-cell development but not that of the γδ–T-cell lineage (10). Clearly, β alone or within the context of the preTCR binds ligand in a specific manner as shown by several independent techniques: NMR studies (Figs. 1 and 2), 2D affinity measurement, and BFP analysis (Fig. 3 A–F). This engagement engenders Ca2+ flux (Fig. 3 G–I), which is known to be a critical step in TCR signaling. Certainly, our results do not dispute the prevailing view that productive β-gene rearrangement and expression drive development to the DP stage (Fig. 4A). Because early studies showed that this DN to DP progression proceeds in the absence of an external pMHC ligand and is observed in DN thymocytes with preTCR complexes lacking pTα and -β ectodomains, preTCR-driven DP development is not absolutely dependent on pMHC interaction (39). Rather, the nature of the repertoire may be affected by preTCR–pMHC binding. We find that a given β expressing thymocyte may proliferate more readily within the DN3 stage than another closely related variant (Fig. 4), altering the numeric representation of that particular β-clonotype during subsequent TCRα rearrangement. This finding is consistent with an initial optimization of the TCRαβ repertoire by preselecting clonotypes with a predisposition for pMHC interaction. The results presented here also importantly indicate reduced peptide stringency involved in β-selection, which was pointed to by the decreased binding of VSV8/Kb by both M22 and M23 mutants (Fig. 2 E and F), despite the comparable efficiency of M23 to WT N15β when assayed in thymic culture (Fig. 4 A–C).
Fig. 5.
Model for early DN thymocyte selection through ligand-independent and -dependent processes. Interactions with thymic ligands occur in a background of DL-4–dependent Notch signaling as well as constitutive preTCR signaling. Nonetheless, signaling is enhanced through preTCR–ligand interactions, leading to greater proliferation in the DN3 stage. Apoptosis occurs predominantly in nondividing thymocytes. Note that the possibility of non-MHC ligands is indicated, because this has not been excluded experimentally.For simplicity, CD3ζ has been omitted. DLL, Delta-like ligand.
These data underscore the broader specificities measured by BFP (Fig. 3A) as well as the force-driven changes modulating preTCR–pMHC bond lifetime. Thus, in addition to facilitating DP thymocyte progression through an apparently autonomous preTCR signaling mechanism (39), preTCR interaction with pMHC and/or additional ligands tunes selection of β-chains to be used by αβTCR-expressing DP thymocytes. Future research will show the relationships between autonomous preTCR signaling, Notch signaling, and preTCR–pMHC interactions in modulating early development under different piconewton force conditions that may be encountered intrathymically (Fig. 5). Perhaps the capacity of preTCR-expressing DN3 and -4 and early DP thymocytes to ligate multiple specificities increases the likelihood of developmental progression by promoting signaling that would otherwise be too infrequent if restricted to a single ligand. Of note, neither the previously reported superdomain of two antiparallel preTCRs model (13) nor the upright Vβ dimer model (14) represents the geometry of this pMHC binding competent receptor. Although the former’s orientation makes the CDRs inaccessible and both models occlude the hydrophobic patch implicated in ligand binding, a monomer-competent/dimer-incompetent equilibrium cannot be excluded. Nonetheless, ligand-gated signaling is essential here for preTCR-bearing cells, because spontaneous Ca2+ flux is not observed (Fig. 3 and Fig. S6).
Using optical tweezers and DNA tether spacer technology, which permit piconewton force application and nanometer-scale precision, Das et al. (19) determined how bioforces relate to self- vs. nonself-discrimination. Single-molecule analyses involving isolated αβ-heterodimers as well as complete TCR complexes on T lymphocytes revealed that the FG loop in the β-subunit constant domain allosterically controls both the variable domain module’s catch bond lifetime and peptide discrimination through force-driven conformational transition. Of interest and in contrast to integrins, the TCR interrogates its ligand through a strong force-loaded state, with release through a weakened extended state. Given the presence of the FG loop in the preTCR, a similar mechanism is likely operative. Molecular details of the role of the Vβ hydrophobic patch in ligand binding geometry will illuminate how force transduction through the β-subunit diverges relative to the mature αβTCR (19). In the preTCR, the unpaired Vβ domain is likely to behave differently under force compared with when it is in the context of the paired TCRαβ V module.
Given that β-gene rearrangement, like that in other TCR and B-cell receptor (BCR) genes, involves a stochastic process generating myriad specificities but at the cost of engendering either no pMHC reactivity or excess unwanted autoreactivity, an early competitive first-cut (i.e., coarse) selection process to enhance the incorporation of valuable β-chains into αβTCRs makes teleological sense. This preselection process imparted by the β-chain at the DN stage may relate to the propensity of certain individual β-subunits to participate in self-pMHC interactions that may be favored, expanding those preTCR-bearing cells. The fact that N30β but not N15β is incorporated into the dominant B6 response to VSV8/Kb is noteworthy (22). Whether excessively strong pMHC interactions disfavor DN development through apoptotic mechanisms is not excluded and requires additional study. Notwithstanding, our findings suggest that tuning of the αβTCR repertoire begins before the DP thymocyte stage with β-selection that is modulated by self-ligands.
Materials and Methods
Protein Expression and Purification.
β-Proteins were expressed in Escherichia coli using M9 minimal media containing 15N NH4-Cl, 2H-13C-glucose, and 99.9% (mol/mol) D2O for backbone assignments and cross-saturation experiments or 15N HN4Cl for HSQC titration experiments (23, 25). TCRβ (14), VSV8/Kb (40), and CD3γε (41) were produced as previously described. pMHC in micropipette experiments was generated with C-terminal biotin tags and produced by the NIH Tetramer Core Facility at Emory University. Mutations generated for proteins are detailed in SI Materials and Methods.
NMR.
Standard experiments were used on Bruker 900-, 800-, 750-, 600-, or 500-MHz or Agilent 600-MHz NMR machines equipped with cryogenic probes. Data were processed using NMRPipe (42), and they were analyzed and displayed using CARA (43). Molecular models were created with PyMol (44). Additional details are in SI Materials and Methods.
Micropipette Adhesion Frequency Analysis.
The micropipette adhesion frequency assay was used to measure effective 2D affinity (34, 45). In brief, monomeric pMHC was coated onto RBCs using biotin–streptavidin coupling. An RBC and an SCID.adh cell were aspirated by respective micropipettes, and contact time-dependent adhesion frequencies were measured as described in SI Materials and Methods.
BFP Force-Clamp Assay.
Two assays were conducted using BFP: a thermal fluctuation assay (34, 46, 47) for zero-force off-rate measurement and a force-clamp assay (18) for force-dependent bond lifetime measurement. Details of measurements and rate calculations are given in SI Materials and Methods.
Microfluidics-Based Calcium Flux.
For single-cell analysis, a microfluidics-based cell trap array chip was used for calcium imaging at 37 °C as described (36), with additional details included in SI Materials and Methods.
Retroviral Constructs and Transduction of Thymocytes and Fetal Liver Hematopoietic Progenitors.
Retroviral constructs coding for murine TCRβ (WT or CDR loop mutants) were inserted into the retroviral vector pLZRS-IRES-EGFP. Thymocytes originated from C57BL/6 Rag2−/− mice were transduced with N15β retroviral supernatant using Lipofectamine Reagent (Invitrogen). Additional details are given in SI Materials and Methods.
OP9-DL4 Stromal Cell Culture.
OP9 and OP9-DL4 stromal cell cultures were conducted as described (48). Generally, 2,000 transduced DN3 cells (SI Materials and Methods) were seeded into six-well culture dishes containing stromal cells and cultured for up to 10 d.
Flow Cytometry Analysis and FACS.
Data for fetal thymic organ culture samples, OP9 cultured samples, and SCID.adh samples were collected on a FACSAria I (BD Biosciences) and sorted or gated based on forward scatter or side scatter and appropriate fluorescent parameters as described in SI Materials and Methods.
Data processing and analyses for all FACS experiments used FlowJo software (TreeStar, Inc.).
SI Materials and Methods
Cellular and Protein Mutants.
Mutants used in NMR, fetal thymic organ culture (FTOC), and/or OP9 stromal cell culture are detailed in Table S1: N15β M22, Y50A/E51A; N15β M23, Q48A/Y50A/E51A; N15β mutant patch 1 (MP1), F103A; N15β MP2, L43A/F103A; N15β MP3, Q37A/L43A/F103A; N30β M1, S27A/H29A/D30A; N30β M2, D51A/E52A; N30β M3, S96G/Δ(G97-V102); N30β M12, incorporated both M1 and M2; and N30β M123, incorporated M1, M2, and M3. Numbering is according to Fig. S1.
NMR and Cross-Saturation Analysis.
The backbone was assigned using the TROSY version of standard triple-resonance experiments.
Chemical shift changes were calculated based on the formula chemical shift change = |5 × Δδ(1H)| + |Δδ(15N)|, with values greater than 1 SD from the average chemical shift change deemed significant.
Cross-saturation experiments (25) were performed using perdeuterated N15 or N30β with unlabeled VSV8/Kb in PBS (pH 7.0) in 80% (vol/vol) D2O/H2O. For N15β, a sample containing 600 μM 2H13C15N perdeuterated N15β + 700 μM unlabeled VSV8/Kb was subject to saturation pulse for 0.5, 1, 1.5, and 2.5 s. A 1-ppm-width adiabatic wideband uniform rate smooth truncation pulse (50 ms) centered at 1 ppm was used to irradiate the methyl protons for 0.5–2.5 s, with compensating delays to ensure equal relaxation delays for each experiment. Acquisitions using shaped pulse at 1 ppm were interleaved with those with off resonance-shaped pulses centered at −19 ppm to produce the reference unsaturated spectra. Because ligand binding resulted in loss of intensity at the binding interface (Fig. 2A), an additional experiment with saturation length 2 s was performed with 200 μM N15β + 200 μM VSV8/Kb to lessen this effect. Residues were ranked in order of saturation effect for each saturation time, and the residues with the highest average rank over all experiments (the top 10% overall) were considered significantly affected. For N30β, the sample contained 600 μM β + 700 μM VSV8/Kb and was subject to saturation times of 0.5, 1, 1.5, 2, and 2.5 s. Because the N30β–VSV8/Kb interaction was found to be weaker than that of N15β–VSV8/Kb, spin diffusion effects were expected to be more pronounced. We, thus, used a strategy to identify the primary contact in which intensities over increasing saturation time were fit to an exponential decay as described (49) to determine the instantaneous saturation decay rate. This strategy compensates for spin diffusion and ligand rebinding effects and decreases the impact of spectral noise. The largest 5% of cross-saturation effect was considered as being affected.
H57 Sorting of SCID.adh Transductants.
SCID.adh cells were sorted for high and comparable β-levels (Fig. S5 A–D) defined by H57-allophycocyanin (APC) or H57-phycoerythrin (PE) binding to a surface density >25/μm2 calibrated using QuantiBrite Beads (BD). N15αβ transductants were negatively sorted based on anti-pTα (2F5) staining to eliminate preTCR-coexpressing cells.
Micropipette Adhesion Frequency Analysis.
The SCID.adh cell was manipulated to move in and out of contact with the RBC repeatedly with controlled contact time (tc; from 0.1 to 10 s) and area (Ac), and the TCR and pMHC bond engagements were detected by the deflection of the RBC membrane. The contact time-dependent adhesion frequency [number of adhesions divided by number of contacts (Pa)] was measured and fitted with a probabilistic kinetic equation (45):
At sufficiently long contact time, the effective 2D affinity (AcKa) was derived from the equation
where mr and ml are TCR and pMHC densities, respectively, defined by flow cytometry.
Biomembrane Force-Probe, Force-Clamp Assay.
In the force-clamp assay, the SCID.adh cell was driven to contact the pMHC-coated bead with 15 pN impingement force for 0.2 s to allow bond formation. The TCR–pMHC bond was loaded by retracting the SCID.adh cell to a preset force ranging from 2 to 30 pN and clamped at that force until bond rupture. Bond lifetime was the duration of the clamped phase. To ensure that most binding events were mediated by single bonds, pMHC density was adjusted accordingly to maintain low-adhesion (<20%) frequencies (45). For thermal fluctuation assay, the retraction stopped when the impinging force just vanishes, and therefore, bond lifetime was measured at zero force. TCR–pMHC bond association and dissociation were indicated by the reduction and resumption of the probe bead thermal fluctuations, respectively. The duration from reduction to resumption of the thermal fluctuation was recorded as lifetime. As described previously (47), the kinetic process was modeled as a single-step first-order dissociation of a single monomeric bond that follows the equation
where Pb is the probability of a bond formed at time 0 to remain intact at time tb. Taking a natural log linearizes the exponential function on the right side of the equation; we, thus, plot the bond lifetime data as ln(number of events with a lifetime ≥ tb) vs. tb to estimate the off-rate koff from the negative slope of the line. Alternatively, off rate can be calculated from the reciprocal average bond lifetime:
The 2D on rate is calculated from equation
Calcium Flux.
SCID.adh cells were retrovirally transduced with N15 β (WT, M22, or M23) only or N15-TCRα plus -β and sorted based on the surface staining of H57-597 antibody (against the constant domain of β). SCID.adh cells (parental TCRα and -β negative control) or sorted SCID.adh transfectants were loaded with Indo-1 (1 μg/mL). Calcium flux was recorded before and subsequent to antibody addition as follows: at 30 s, anti-CD3 (145-2C11; 5 μg/mL) was added, and then, at 1 min, anti-hamster IgG (10 μg/mL) was added. Calcium flux is represented as an Indo-1 405/485-nm emission ratio. TCRαβ-positive 257–20-109 DP cells were used for the calcium flux positive control and triggered using the A23187 calcium ionophore.
Microfluidics-Based Calcium Flux.
For single-cell analysis, a microfluidics-based cell trap array was used for pMHC- or control protein (BSA) -dependent Ca2+ measurements at 37 °C. Briefly, biotinylated BSA (1 mg/mL) was first adsorbed on the device surface followed by incubation of streptavidin (0.5 mg/mL) and finally, coupling of biotinylated pMHCs or control BSA (10 μg/mL) to the streptavidin. Cells were loaded with Fluo3-AM calcium indicator dye and then, loaded into the device by gravity with simultaneous fluorescence imaging. Images were acquired every 3 s for 20 min.
Mice.
C57BL/6 mice (6 wk) were purchased from Taconic Farms Inc. Mice were mated for 18 h, and fetuses were removed from pregnant females at 14.5 d of gestation. Fetal thymic lobes were collected from these embryos. Mice for obtaining alymphoid thymic lobes postdeoxyguanosine were mated 5 d before mice were mated for obtaining fetal thymocytes for retroviral transduction. C57BL/6 Rag2−/− mice (Taconic) were used for hematopoietic stem cell transduction as described below.
Retroviral Constructs and Transduction of Thymocytes and Fetal Liver Hematopoietic Progenitors.
Retroviral constructs were made using the retroviral vector pLZRS-IRES-EGFP. Murine TCR N15β DNA (WT or CDR loop mutants) was inserted into the vector in the BamH1/EcoR1 cloning sites. Mutations in the CDR loops were made using the QuikChange Site-Directed Mutagenesis Kit (Agilent).
Retroviral supernatants were generated by transfecting DNA using Fugene 6 (Promega) into the FNX-eco ecotropic packaging cell line and grown in Iscove's modified Dulbecco's medium (IMDM) containing 10% FCS, penicillin-streptomycin (PS), and glutamine. After 48 h, cells were collected and further cultured in selection medium containing puromycin (2 mg/mL) for 4 d. At this time, cells were washed two times with fresh medium over 4–6 h and cultured for an additional 24 h before the supernatant was collected.
Analysis of Thymocyte Development by OP9-DL4 Culture.
Single-cell suspensions of fetal liver cells were isolated from E14.5 B6 Rag2−/− embryos, and B-lineage cells were removed by binding of α-CD24 (HSA) mAb (BD) and complement lysis (Cedarlane) for 30 min at 37 °C. The treated cell suspension was carefully layered onto Lympholyte-M (Cedarlane), and after centrifugation for 10 min, the viable mononuclear cells were recovered from the interface layer and washed in OP9 medium (αMEM, 15% FBS, and antibiotics). Cells were stained with T-lineage markers (Lin) αCD4-Pacific Blue and αCD8-PE as well as αScaI-FITC and αCD117 (c-Kit)−APC, and Lin-ScaI+c-Kit+ cells were sorted to a high level of purity from the initial representation of ∼0.3%. Sorted Lin-ScaI+c-Kit+ cells (∼5 × 10⁴) were layered onto 70–90% confluent OP9-DL4 cells (15) in OP9 medium supplemented with Flt-3 (5 ng/mL; R&D Systems), IL-7 (1 ng/mL; Peprotech), and gentamicin (5 ng/mL). Six days after seeding on OP9-DL4 cells, the cultures were disrupted nonenzymatically by pipetting to yield a population of dispersed thymocytes and fragments of the OP9 basal monolayer. The fragments of the adherent cell sheet were removed by filtration through a cell strainer (40 μm), and the recovered developing thymocytes were washed in OP9 medium. Aliquots of 106 cells per 0.5 mL were incubated with GFP-expressing lentivirus encoding TCR chains/lipofectamine mixture, which was preincubated at room temperature for 10 min before cell addition, in 24-well plates and centrifuged at 350 × g for 90 min at room temperature followed by overnight incubation at 37 °C. The transduced cells were washed in staining buffer (PBS + 3% FBS) and incubated with α-CD45-APC, α-CD8-PE, α-CD4-Pacific Blue, α-CD25-PE/Cy7, and α-CD44-APC/Cy7. The transduced and stained cells were sorted by GFP+CD45+ to define transduced hematopoietic lineage cells, CD4−CD8− to enrich for the DN population, and CD25+CD44− profiling to purify the DN3 thymocytes. The DN3 thymocytes (2 × 10³) were plated onto OP9-DL4 (or OP9 control) cell monolayers, which were plated the day before at 5 × 10⁴ cells per well in OP9 medium supplemented with Flt-3, IL-7, and gentamicin as described above. At varying time points from day 3 to day 10 after sorting, the developing thymocytes were disaggregated and separated from the OP9/OP9-DL4 cells as described above, and thymocyte development from DN through DP to single-positive stages was monitored by expression of GFP, CD45, CD4, CD8, CD25, and CD44. Proliferation and apoptosis were followed at discrete developmental stages using the same markers as above, except for CD45, and diminution of the Violet Proliferation Dye 450 signal (added to the culture on day 3 after the sort) was monitored to characterize proliferation and AnnexinV staining to identify apoptotic cells.
Data Analysis in Stromal Cell Culture.
Significance (P value) was determined by regression using dose–response and trend line analysis models accounting for interexperimental variability (R Statistical Software Package) (50) unless otherwise indicated.
FTOC.
To obtain fetal thymic lobes depleted of endogenous thymocytes, lobes were dissected from 14.5-d-old fetal mice and placed on Millipore membrane filters resting on a gel-foam sponge (Pfizer) in six-well culture plates with FTOC medium of Iscove’s Modified Dulbecco’s Medium supplemented with 10% FCS, 1% nonessential amino acids (NEAA) 2% glutamine, 1% PS, and 5 × 10⁻⁵ M 2-mercaptoethanol (2-ME) containing 2-deoxyguanosine (1.35 mM; Sigma dGuo). The lobes were cultured for 5 d at 37 °C within a 5% CO2 incubator. After dGuo treatment, lobes were washed three times with fresh FTOC medium without dGuo over 4–6 h and then, set up in hanging drop culture with retrovirally transduced fetal thymocytes on Terasaki plates (Nunc).
To obtain fetal thymocytes for retroviral transduction and subsequent reconstitution of alymphoid lobes, thymic lobes were collected from 14.5 days post coition (dpc) C57BL/6 Rag2−/− embryos. Fetal thymocytes were transduced with N15β retroviral supernatant using Lipofectamine Reagent (Invitrogen). Cells were cultured in FTOC medium containing 25 ng/mL murine IL-7 (Sigma) and 25 ng/mL murine stem cell factor (Sigma) in 96-well plates, centrifuged for 1.5 h at room temperature, and incubated 24 h at 37 °C. To assess transduction efficiency, the percentage of GFP+ cells was evaluated by flow cytometry. Transduced thymocytes were washed three times with fresh FTOC medium. Approximately 2 × 10⁵ transduced cells were seeded per well in Terasaki plates (Nunc) together with one alymphoid thymic lobe. After 48 h of culture in hanging drops, lobes were cultured on gel-foam filters for 4–6 d. At the end of the culture period, lobes were disrupted, and cells were counted and stained for flow cytometry analyses. In some experiments, cyan fluorescent protein (CFP) transduction was performed using an identical vector but with the GFP cassette replaced with CFP as described in Fig. S9F.
Flow Cytometry Analysis and FACS.
The following antibodies were used: α-CD8-PE, α-CD4 Pacific Blue, α-CD4-PE, ckit α-CD117-APC, α-TCRβ H57-PE, AnnexinV APC, α-pTα, α-streptavidin-PE, and α-CD44 APC/Cy7 from BD Pharmingen; α-CD25-PE Cy7, α-CD45-APC, and ScaI-FITC from eBioscience; H57-APC from BioLegend; α-CD8 Pacific Orange from Caltag; and Violet Proliferation Dye 450 from BD Horizon.
Cells were preincubated with murine Fc block 24G2 (BD Pharmingen) for 10 min before adding the labeled mAbs, incubated for 15 min, washed, and resuspended in 1× PBS/2% FCS. Measurement parameters for each fluorescent label are as follows: GFP (530/30 band-pass filter), PE (576/26 band-pass filter), 7-aminoactinomycin D (7-AAD) (695/40 band-pass filter), and PE/CY7 (780/60 band-pass filter) were all excited using a 488-nm laser; APC (660/20 band-pass filter) and APC/CY7 (780/60 band-pass filter) were both excited by a 633-nm laser; and Pacific Blue (450/40 band-pass filter), Pacific Orange (575/26 band-pass filter), and Violet Proliferation Dye 450 (450/40 band-pass filter) were all excited using a 407-nm laser. All sorts were done using a 70-μm nozzle.
Data for the FTOC samples that include CFP and calcium flux measurements were collected using an FACSAria II SORP UV (BD Biosciences). Forward scatter, side scatter, and GFP (515/20 band-pass filter) were excited using a 488-nm laser. PE (582/15 band-pass filter) and PECY7 (710/60 band-pass filter) were excited by a 561-nm laser. APC (670/30 band-pass filter) and APCCY7 (780/60 band-pass filter) were excited using a 633-nm laser. Pacific Blue (450/20 band-pass filter) and Pacific Orange (525/50 band-pass filter) were excited using a 407-nm laser. CFP (470/20 band-pass filter) was excited by a 445-nm laser.
Supplementary Material
Acknowledgments
We thank Juan Carlos Zuniga-Pflücker for OP9 and OP9-DL4 cell lines; the NIH Tetramer Core Facility at Emory University for providing biotinylated peptides bound to MHC molecules monomers; Rafael A. Irizarry for statistical consultation; Bo Zhao, Jingang Gui, Baoyu Liu, and Wei Chen for assistance with preliminary experiments; and Matthew J. Lang(M.J.L.) for discussion. This work was supported by NIH Grants R01AI088023 (to H.L.), R01AI044902 (to C.Z.), P01GM04746 (to G.W.), R01AI37581 (to G.W.), R01AI19807 (to E.L.R.), and R01AI100643 (to M.J.L. and E.L.R.) and National Science Foundation Grant CBET 0954578 (to H.L.).
Footnotes
The authors declare no conflict of interest.
This article is a PNAS Direct Submission.
See Commentary on page 8166.
This article contains supporting information online at www.pnas.org/lookup/suppl/doi:10.1073/pnas.1504971112/-/DCSupplemental.
References
- 1.Prockop S, Petrie HT. Cell migration and the anatomic control of thymocyte precursor differentiation. Semin Immunol. 2000;12(5):435–444. doi: 10.1006/smim.2000.0267. [DOI] [PubMed] [Google Scholar]
- 2.Shah DK, Zúñiga-Pflücker JC. An overview of the intrathymic intricacies of T cell development. J Immunol. 2014;192(9):4017–4023. doi: 10.4049/jimmunol.1302259. [DOI] [PubMed] [Google Scholar]
- 3.von Boehmer H. The thymus in immunity and in malignancy. Cancer Immunol Res. 2014;2(7):592–597. doi: 10.1158/2326-6066.CIR-14-0070. [DOI] [PubMed] [Google Scholar]
- 4.Mathis D, Benoist C. Aire. Annu Rev Immunol. 2009;27:287–312. doi: 10.1146/annurev.immunol.25.022106.141532. [DOI] [PubMed] [Google Scholar]
- 5.Goldrath AW, Bevan MJ. Selecting and maintaining a diverse T-cell repertoire. Nature. 1999;402(6759):255–262. doi: 10.1038/46218. [DOI] [PubMed] [Google Scholar]
- 6.Shortman K, Jackson H. The differentiation of T lymphocytes. I. Proliferation kinetics and interrelationships of subpopulations of mouse thymus cells. Cell Immunol. 1974;12(2):230–246. doi: 10.1016/0008-8749(74)90075-6. [DOI] [PubMed] [Google Scholar]
- 7.Love PE, Bhandoola A. Signal integration and crosstalk during thymocyte migration and emigration. Nat Rev Immunol. 2011;11(7):469–477. doi: 10.1038/nri2989. [DOI] [PMC free article] [PubMed] [Google Scholar]
- 8.Choi YI, et al. Dynamic control of β1 integrin adhesion by the plexinD1-sema3E axis. Proc Natl Acad Sci USA. 2014;111(1):379–384. doi: 10.1073/pnas.1314209111. [DOI] [PMC free article] [PubMed] [Google Scholar]
- 9.Halkias J, Melichar HJ, Taylor KT, Robey EA. Tracking migration during human T cell development. Cell Mol Life Sci. 2014;71(16):3101–3117. doi: 10.1007/s00018-014-1607-2. [DOI] [PMC free article] [PubMed] [Google Scholar]
- 10.Kreslavsky T, et al. β-Selection-induced proliferation is required for αβ T cell differentiation. Immunity. 2012;37(5):840–853. doi: 10.1016/j.immuni.2012.08.020. [DOI] [PMC free article] [PubMed] [Google Scholar]
- 11.Lind EF, Prockop SE, Porritt HE, Petrie HT. Mapping precursor movement through the postnatal thymus reveals specific microenvironments supporting defined stages of early lymphoid development. J Exp Med. 2001;194(2):127–134. doi: 10.1084/jem.194.2.127. [DOI] [PMC free article] [PubMed] [Google Scholar]
- 12.Yamasaki S, et al. Mechanistic basis of pre-T cell receptor-mediated autonomous signaling critical for thymocyte development. Nat Immunol. 2006;7(1):67–75. doi: 10.1038/ni1290. [DOI] [PubMed] [Google Scholar]
- 13.Pang SS, et al. The structural basis for autonomous dimerization of the pre-T-cell antigen receptor. Nature. 2010;467(7317):844–848. doi: 10.1038/nature09448. [DOI] [PubMed] [Google Scholar]
- 14.Zhou B, et al. A conserved hydrophobic patch on Vβ domains revealed by TCRβ chain crystal structures: Implications for pre-TCR dimerization. Front Immunol. 2011;2:5. doi: 10.3389/fimmu.2011.00005. [DOI] [PMC free article] [PubMed] [Google Scholar]
- 15.Desmyter A, et al. Crystal structure of a camel single-domain VH antibody fragment in complex with lysozyme. Nat Struct Biol. 1996;3(9):803–811. doi: 10.1038/nsb0996-803. [DOI] [PubMed] [Google Scholar]
- 16.Ward ES, Güssow D, Griffiths AD, Jones PT, Winter G. Binding activities of a repertoire of single immunoglobulin variable domains secreted from Escherichia coli. Nature. 1989;341(6242):544–546. doi: 10.1038/341544a0. [DOI] [PubMed] [Google Scholar]
- 17.Malchiodi EL, et al. Superantigen binding to a T cell receptor beta chain of known three-dimensional structure. J Exp Med. 1995;182(6):1833–1845. doi: 10.1084/jem.182.6.1833. [DOI] [PMC free article] [PubMed] [Google Scholar]
- 18.Liu B, Chen W, Evavold BD, Zhu C. Accumulation of dynamic catch bonds between TCR and agonist peptide-MHC triggers T cell signaling. Cell. 2014;157(2):357–368. doi: 10.1016/j.cell.2014.02.053. [DOI] [PMC free article] [PubMed] [Google Scholar]
- 19.Das DK, et al. Force-dependent transition in the T-cell receptor β-subunit allosterically regulates peptide discrimination and pMHC bond lifetime. Proc Natl Acad Sci USA. 2015;112(5):1517–1522. doi: 10.1073/pnas.1424829112. [DOI] [PMC free article] [PubMed] [Google Scholar]
- 20.Wang J, et al. Atomic structure of an alphabeta T cell receptor (TCR) heterodimer in complex with an anti-TCR fab fragment derived from a mitogenic antibody. EMBO J. 1998;17(1):10–26. doi: 10.1093/emboj/17.1.10. [DOI] [PMC free article] [PubMed] [Google Scholar]
- 21.Bentley GA, Boulot G, Karjalainen K, Mariuzza RA. Crystal structure of the beta chain of a T cell antigen receptor. Science. 1995;267(5206):1984–1987. doi: 10.1126/science.7701320. [DOI] [PubMed] [Google Scholar]
- 22.Imarai M, Goyarts EC, van Bleek GM, Nathenson SG. Diversity of T cell receptors specific for the VSV antigenic peptide (N52-59) bound by the H-2Kb class I molecule. Cell Immunol. 1995;160(1):33–42. doi: 10.1016/0008-8749(95)80006-5. [DOI] [PubMed] [Google Scholar]
- 23.Marintchev A, Frueh D, Wagner G. NMR methods for studying protein-protein interactions involved in translation initiation. Methods Enzymol. 2007;430:283–331. doi: 10.1016/S0076-6879(07)30012-8. [DOI] [PubMed] [Google Scholar]
- 24.Yin Y, Wang XX, Mariuzza RA. Crystal structure of a complete ternary complex of T-cell receptor, peptide-MHC, and CD4. Proc Natl Acad Sci USA. 2012;109(14):5405–5410. doi: 10.1073/pnas.1118801109. [DOI] [PMC free article] [PubMed] [Google Scholar]
- 25.Takahashi H, Nakanishi T, Kami K, Arata Y, Shimada I. A novel NMR method for determining the interfaces of large protein-protein complexes. Nat Struct Biol. 2000;7(3):220–223. doi: 10.1038/73331. [DOI] [PubMed] [Google Scholar]
- 26.Varani L, et al. Solution mapping of T cell receptor docking footprints on peptide-MHC. Proc Natl Acad Sci USA. 2007;104(32):13080–13085. doi: 10.1073/pnas.0703702104. [DOI] [PMC free article] [PubMed] [Google Scholar]
- 27.Scott-Browne JP, White J, Kappler JW, Gapin L, Marrack P. Germline-encoded amino acids in the alphabeta T-cell receptor control thymic selection. Nature. 2009;458(7241):1043–1046. doi: 10.1038/nature07812. [DOI] [PMC free article] [PubMed] [Google Scholar]
- 28.Adams JJ, et al. T cell receptor signaling is limited by docking geometry to peptide-major histocompatibility complex. Immunity. 2011;35(5):681–693. doi: 10.1016/j.immuni.2011.09.013. [DOI] [PMC free article] [PubMed] [Google Scholar]
- 29.Hogquist KA, et al. T cell receptor antagonist peptides induce positive selection. Cell. 1994;76(1):17–27. doi: 10.1016/0092-8674(94)90169-4. [DOI] [PubMed] [Google Scholar]
- 30.Wang JH, Reinherz EL. The structural basis of αβ T-lineage immune recognition: TCR docking topologies, mechanotransduction, and co-receptor function. Immunol Rev. 2012;250(1):102–119. doi: 10.1111/j.1600-065X.2012.01161.x. [DOI] [PMC free article] [PubMed] [Google Scholar]
- 31.Alam SM, et al. T-cell-receptor affinity and thymocyte positive selection. Nature. 1996;381(6583):616–620. doi: 10.1038/381616a0. [DOI] [PubMed] [Google Scholar]
- 32.Gascoigne NR, Zal T, Alam SM. T-cell receptor binding kinetics in T-cell development and activation. Expert Rev Mol Med. 2001;2001:1–17. doi: 10.1017/S1462399401002502. [DOI] [PubMed] [Google Scholar]
- 33.Aleksic M, et al. Dependence of T cell antigen recognition on T cell receptor-peptide MHC confinement time. Immunity. 2010;32(2):163–174. doi: 10.1016/j.immuni.2009.11.013. [DOI] [PMC free article] [PubMed] [Google Scholar]
- 34.Huang J, et al. The kinetics of two-dimensional TCR and pMHC interactions determine T-cell responsiveness. Nature. 2010;464(7290):932–936. doi: 10.1038/nature08944. [DOI] [PMC free article] [PubMed] [Google Scholar]
- 35.Shinkai Y, Alt FW. CD3 epsilon-mediated signals rescue the development of CD4+CD8+ thymocytes in RAG-2-/- mice in the absence of TCR beta chain expression. Int Immunol. 1994;6(7):995–1001. doi: 10.1093/intimm/6.7.995. [DOI] [PubMed] [Google Scholar]
- 36.Chung K, Rivet CA, Kemp ML, Lu H. Imaging single-cell signaling dynamics with a deterministic high-density single-cell trap array. Anal Chem. 2011;83(18):7044–7052. doi: 10.1021/ac2011153. [DOI] [PMC free article] [PubMed] [Google Scholar]
- 37.Mohtashami M, Shah DK, Kianizad K, Awong G, Zúñiga-Pflücker JC. Induction of T-cell development by Delta-like 4-expressing fibroblasts. Int Immunol. 2013;25(10):601–611. doi: 10.1093/intimm/dxt027. [DOI] [PubMed] [Google Scholar]
- 38.Touma M, et al. Importance of the CD3gamma ectodomain terminal beta-strand and membrane proximal stalk in thymic development and receptor assembly. J Immunol. 2007;178(6):3668–3679. doi: 10.4049/jimmunol.178.6.3668. [DOI] [PubMed] [Google Scholar]
- 39.Irving BA, Alt FW, Killeen N. Thymocyte development in the absence of pre-T cell receptor extracellular immunoglobulin domains. Science. 1998;280(5365):905–908. doi: 10.1126/science.280.5365.905. [DOI] [PubMed] [Google Scholar]
- 40.Moody AM, Xiong Y, Chang HC, Reinherz EL. The CD8alphabeta co-receptor on double-positive thymocytes binds with differing affinities to the products of distinct class I MHC loci. Eur J Immunol. 2001;31(9):2791–2799. doi: 10.1002/1521-4141(200109)31:9<2791::aid-immu2791>3.0.co;2-x. [DOI] [PubMed] [Google Scholar]
- 41.Sun Z-YJ, et al. Solution structure of the CD3epsilondelta ectodomain and comparison with CD3epsilongamma as a basis for modeling T cell receptor topology and signaling. Proc Natl Acad Sci USA. 2004;101(48):16867–16872. doi: 10.1073/pnas.0407576101. [DOI] [PMC free article] [PubMed] [Google Scholar]
- 42.Delaglio F, et al. NMRPipe: A multidimensional spectral processing system based on UNIX pipes. J Biomol NMR. 1995;6(3):277–293. doi: 10.1007/BF00197809. [DOI] [PubMed] [Google Scholar]
- 43.Keller R. Computer Aided Resonance Assignment Tutorial. Cantina; Goldau, Switzerland: 2004. [Google Scholar]
- 44. Schrödinger LLC (2010) The PyMOL Molecular Graphics System (Schrödinger LLC, Cambridge, MA), Version 1.3r1.
- 45.Chesla SE, Selvaraj P, Zhu C. Measuring two-dimensional receptor-ligand binding kinetics by micropipette. Biophys J. 1998;75(3):1553–1572. doi: 10.1016/S0006-3495(98)74074-3. [DOI] [PMC free article] [PubMed] [Google Scholar]
- 46.Chen W, Zarnitsyna VI, Sarangapani KK, Huang J, Zhu C. Measuring receptor-ligand binding kinetics on cell surfaces: From adhesion frequency to thermal fluctuation methods. Cell Mol Bioeng. 2008;1(4):276–288. doi: 10.1007/s12195-008-0024-8. [DOI] [PMC free article] [PubMed] [Google Scholar]
- 47.Chen W, Evans EA, McEver RP, Zhu C. Monitoring receptor-ligand interactions between surfaces by thermal fluctuations. Biophys J. 2008;94(2):694–701. doi: 10.1529/biophysj.107.117895. [DOI] [PMC free article] [PubMed] [Google Scholar]
- 48.Mohtashami M, et al. Direct comparison of Dll1- and Dll4-mediated Notch activation levels shows differential lymphomyeloid lineage commitment outcomes. J Immunol. 2010;185(2):867–876. doi: 10.4049/jimmunol.1000782. [DOI] [PubMed] [Google Scholar]
- 49.Angulo J, Enríquez-Navas PM, Nieto PM. Ligand-receptor binding affinities from saturation transfer difference (STD) NMR spectroscopy: The binding isotherm of STD initial growth rates. Chemistry. 2010;16(26):7803–7812. doi: 10.1002/chem.200903528. [DOI] [PubMed] [Google Scholar]
- 50.R Core Team . R; Vienna: 2014. R: A Language and Environment for Statistical Computing. [Google Scholar]


