

Significance
In contrast to canonical, stimulus-driven models of perception, recent proposals argue that perceptual experiences are constructed in an active manner in which top-down influences play a key role. In particular, predictions that the brain makes about the world are incorporated into each perceptual experience. Because forming the appropriate sensory predictions can have a large impact on our visual experiences and visually guided behaviors, a mechanism thought to be disrupted in certain neurological conditions like autism and schizophrenia, an understanding of the neural basis of these predictions is critical. Here, we provide evidence that perceptual expectations about when a stimulus will appear are instantiated in the brain by optimally configuring prestimulus alpha-band oscillations so as to make subsequent processing most efficacious.
Keywords: neural oscillations, prediction, attention, visual awareness, alpha-band phase
Abstract
The physiological state of the brain before an incoming stimulus has substantial consequences for subsequent behavior and neural processing. For example, the phase of ongoing posterior alpha-band oscillations (8–14 Hz) immediately before visual stimulation has been shown to predict perceptual outcomes and downstream neural activity. Although this phenomenon suggests that these oscillations may phasically route information through functional networks, many accounts treat these periodic effects as a consequence of ongoing activity that is independent of behavioral strategy. Here, we investigated whether alpha-band phase can be guided by top-down control in a temporal cueing task. When participants were provided with cues predictive of the moment of visual target onset, discrimination accuracy improved and targets were more frequently reported as consciously seen, relative to unpredictive cues. This effect was accompanied by a significant shift in the phase of alpha-band oscillations, before target onset, toward each participant’s optimal phase for stimulus discrimination. These findings provide direct evidence that forming predictions about when a stimulus will appear can bias the phase of ongoing alpha-band oscillations toward an optimal phase for visual processing, and may thus serve as a mechanism for the top-down control of visual processing guided by temporal predictions.
Forming appropriate perceptual predictions optimizes neural processing and behavior. One intriguing proposal is that cortical oscillations instantiate perceptual predictions by coordinating prestimulus neural activity to process the predicted stimulus optimally (1, 2). A candidate neural mechanism for such coordination is low-frequency oscillations in the alpha band (8–14 Hz) of human electroencephalography (EEG) recordings, which are suggested to route information phasically through task-relevant networks (3, 4). As evidence, recent work has demonstrated that the prestimulus alpha-band phase predicts visual detection (5, 6), the perception of phosphenes (7), the magnitude of the functional MRI (fMRI) response in visual cortex (8), successful perceptual integration across the visual field and subsequent connectivity between visual and parietal cortex (9), as well as variability in working memory performance (10). However, these effects are most often revealed in after-the-fact sorting of procedurally identical trials according to perceptual or behavioral outcome, implying that trial-by-trial performance may be stochastically determined by the oscillatory state that “just happens” to be in place at the time of the event of interest. In the present study, in contrast, we manipulated temporal prediction as an independent variable to investigate whether the top-down control of alpha-band dynamics may be a mechanism through which perceptual predictions can optimally configure prestimulus neural activity.
Specifically, we tested if cueing human observers to the time at which a target visual stimulus would appear would bias the phase of ongoing alpha-band oscillations toward an optimal phase for visual discrimination. In experiment 1, we established that cues predictive of the moment of target appearance significantly enhanced orientation discrimination and subjective visibility. This step was important because even though much work using temporal cueing paradigms has established that response times improve for targets appearing at predicted moments in time (reviewed in 11, 12), it is less clear whether temporal cueing improves perception (13–16). In a second experiment, we replicated the aforementioned behavioral effect while concurrently recording EEG, and found that temporal predictions led to a bias in the phase of ongoing alpha-band oscillations toward each participant’s optimal phase for visual discrimination.
Results
We investigated whether temporal predictions established in a top-down manner, through the use of symbolic cues, would enhance perception of briefly presented, backward-masked Gabor patches (experiment 1), and if so, whether this enhanced perception was achieved via optimization of the phase of alpha oscillations before the onset of the predicted target (experiment 2). Following an initial staircase procedure to titrate performance to ∼80% accuracy, participants were presented with colored fixation crosses that indicated whether an oriented Gabor patch would appear following a short (650 ms), long (1,400 ms), or unpredictable (randomly chosen to be 650, 900, 1,150, or 1,400 ms; Fig. 1) delay. They were instructed to indicate the Gabor’s orientation (left or right), and then to indicate their subjective visibility of the Gabor with a “seen” or “guess” judgment (experiment 1) or a rating on the four-point, perceptual awareness scale (PAS; experiment 2). The PAS was used in the second experiment to assess awareness using a more fine-grained and established scale of subjective visibility (17). The PAS consists of four ratings: (i) no experience, (ii) brief glimpse, (iii) almost clear experience, and (iv) clear experience.
Fig. 1.

Schematic of trial types and timing. Colored fixation crosses cued the appearance of target Gabor patches at a short, long, or unpredictive delay (a random selection of one of four delays). Participants provided nonspeeded, two-alternative forced-choice (2AFC) orientation judgments, followed by a seen or guess judgment (experiment 1) or using the perceptual awareness scale (experiment 2).
Behavior.
Accuracy and subjective visibility data from experiment 1 (Fig. 2A) were each submitted to a repeated-measures ANOVA with delay (short, long) and cue type (predictive, unpredictive) as within-subject factors. Accuracy was higher for targets appearing at long delays [F(1,25) = 4.77, P = 0.038, ηp2 = 0.16], and we also observed a significant interaction [F(1,25) = 8.12, P = 0.008, ηp2 = 0.25], due to higher accuracy following predictive relative to unpredictive cues for short delays [t(25) = −2.64, P = 0.014, d = 0.23, mean difference (Mdiff) = 2.5%], but not long delays [t(25) = 1.15, P > 0.250, d = 0.11]. This pattern likely reflects the “hazard rate” of these trials, which describes the probability of the target appearing, given that it has not yet appeared, which increases throughout a trial via implicit mechanisms (21, 22). Thus, the absence of a cueing benefit at long delays need not imply that top-down control is not being exerted on these trials but may reflect the fact that a second process obscures behavioral evidence for this control. (The EEG data will support this interpretation.) Regarding subjective visibility, temporally predictive targets were rated as seen more often [F(1,25) = 7.15, P = 0.013, ηp2 = 0.22]. This effect was due to an increase in visibility following predictive cues at the short delay only [(t(25) = −2.35, P = 0.027, d = 0.20].
Fig. 2.

Discrimination accuracy and subjective visibility for short and long delays following unpredictive and predictive cues from experiment 1 (A) and experiment 2 (B). Small dots linked by lines represent individual participants, and large dots indicate group means. Asterisks indicate significant (P < 0.05) paired contrasts and main effects. Error bars represent within-subject 95% confidence intervals. In line with previous findings (12, 18–20), temporal cueing improved performance for short delays but not for long delays.
Primary behavioral effects were replicated in experiment 2 (Fig. 2B). We observed a significant main effect of delay [F(1,14) = 7.31, P = 0.017, ηp2 = 0.34], indicating higher accuracy following long delays. We also observed a main effect of cue type [F(1,14) = 4.74, P = 0.047, ηp2 = 0.25], indicating more accurate responses following predictive cues, and a trend toward an interaction [F(1,14) = 3.69, P = 0.075, ηp2 = 0.21]. Accuracy increased following predictive cues at short delays [t(1, 14) = 3.12, P = 0.007, d = 0.317, Mdiff = 4.5%], but not long delays (P = 0.77). Subjective visibility (percentage of trials rating the PAS >1, corresponding to “no experience”) increased following long delays [F(1,14) = 8.31, P = 0.012, ηp2 = 0.37], and we observed a trending delay × cue type interaction [F(1,14) = 3.94, P = 0.061, ηp2 = 0.21]. Paired contrasts revealed significant increases in visibility following predictive cues after short delays [t(1, 14) = 2.29, P = 0.037, d = 0.15], but not long delays (P = 0.75).
Temporal Predictions Modulate Alpha-Band Phase.
Visual inspection of the pretarget power spectrum revealed a clear peak in the alpha band (10.6 Hz; Fig. 3B), with a posterior scalp distribution (Fig. 3A). Our first analyses of this signal tested whether temporal cueing led to any differences in the phase of posterior alpha-band oscillations as a function of cue type. We focused on electrode Pz because of the topography of alpha power we observed (Fig. 3A), and so that our analysis directly relates to previous literature using this electrode (6). Importantly, the results reported here for Pz are also seen when the signal was averaged across the 10 spatially contiguous electrodes where alpha-band power was maximal at the group level during the 400 ms before target onset (Fig. S1). To test for phase differences, we first took the circular average of the phase time series (Materials and Methods) across trials for each condition for each participant for correct trials only. At each sample during the cue–target delay, the mean phase angles for predictive and unpredictive cues were compared using the Watson–Williams test, a circular analog of the t test, which tests the hypothesis that the two samples of angles have different phase distributions (23). This test takes into consideration the mean phase angle and the circular variance of the angles in each sample, and it has been widely used to assess phase differences in electrophysiological data (24–27). We tested for phase differences separately for long and short delays across the entire period between cue and target onset. The resulting P values were corrected for multiple comparisons across time points using the false discovery rate correction at α = 0.05 (MATLAB function mafdr.m; MathWorks), which implements the correction method introduced by Storey (28). This analysis revealed significant phase differences as a function of temporal cueing at various time points across the delay period and, importantly, just before target onset for both short and long delays (Fig. 4 A and C). This prestimulus difference is unlikely to be due to temporal smearing of differences in the target-evoked response because we observed no significant differences between conditions in the magnitude of the target-evoked response at electrode Pz (SI Discussion). Furthermore, these phase effects cannot be explained by differences in alpha power, which did not differ as a function of cue type at either delay (Fig. S2). Alpha phase modulation by temporal expectations was also evident in an analysis of the intertrial phase clustering, which revealed greater clustering at target onset following predictive compared with unpredictive cues at a number of posterior sensors during both catch and noncatch trials (Fig. S3).
Fig. 3.

Spatial and frequency specificity of the alpha-band signal. (A) Scalp topography of absolute alpha power 400 ms before target onset, with electrode Pz indicated. (B) FFT of the pretarget data, indicating a peak in power at 10.6 Hz.
Fig. S1.

To assess whether our observed phase differences can be attributed to differences in alpha power, we compared power time series derived from the amplitude of the Hilbert transform (49, 50) of the same data used to analyze alpha phase. The power time series was baseline-subtracted (−200 to −50 ms) using condition-specific baselines. Repeated measures t tests conducted across the entire delay period (between cue and target onset) revealed no differences in alpha power between predictive and unpredictive cues, at either long or short delays (all uncorrected P > 0.1). Thus, our phase results cannot trivially be due to power differences between conditions. Shaded bands in plots represent ±2 SEM.
Fig. 4.

Temporal cueing modulates alpha-band phase. Each trace represents the normalized grand-averaged, alpha-filtered, event-related potential at electrode Pz for short-delay (A) and long-delay (B) trials, and for predictive (red) and unpredictive (blue) cue trials. Black squares indicate samples where phase significantly differed between the two cue types after correction for multiple comparisons. Temporal cueing led to phase differences before target onset for both long and short delays. (C) Prestimulus PAF on unpredictive cue trials predicts change in PAF following predictive cues. PAF was derived from an FFT of the data from 400 ms before target onset for long (black points) or short (gray points) delays. Although the group PAF did not differ significantly as a function of cue condition, the data varied systematically at the individual level in that predictive cues speeded up the alpha frequency of individuals with slower rhythms and slowed down the frequency of individuals with faster rhythms. This result suggests that following predictive cues, alpha oscillations converge on an ideal frequency such that the phase of the oscillation is altered by target onset. (Inset) This pattern is also evident as reduction of variance in the Gaussian-fitted histograms of PAF.
Fig. S2.
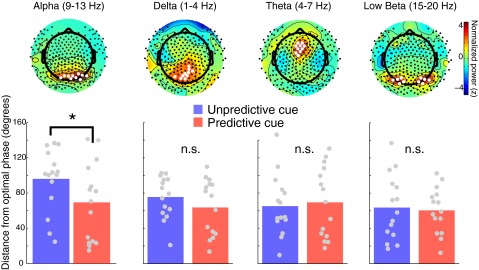
We reconducted our main analysis (testing whether predictive cueing biases alpha phase at target onset toward an optimal phase for stimulus detection; Fig. 5), this time using an empirically defined cluster of electrodes based on the topography of maximal alpha power. We averaged the alpha-filtered signal from the 10 spatially contiguous electrodes where alpha power was maximal at the group level during the 400 ms before target onset (collapsing across all trial types). We then tested whether predictive cue trials were closer to an optimal phase compared with unpredictive cue trials using the same procedure described in the main text (by computing the circular distance between the phase angle at target onset for catch trials and the mean phase angle of correct trials for each condition). Corroborating the original analysis, an ANOVA revealed a significant main effect of cue type [F(1,14) = 8.86, *P = 0.01], suggesting that at this cluster level, predictive cues led to a bias in the alpha-phase angle at target onset toward individuals’ optimal phase angle. (Upper) We applied the same analysis to identify clusters of 10 electrodes showing maximal power for delta, theta, and low beta bands during the pretarget window (400 ms before target onset). (Lower) Using the averaged response from these channel clusters, we still found no evidence of phase angle differences at target onset between correct and incorrect trials (all P > 0.2), and, importantly, no evidence for a bias toward the best phase (i.e., the mean phase angle on correct trials) following predictive cues, except in the alpha band. This finding suggests that the effects of temporal cuing on the phase of ongoing neural oscillations may be specific to the alpha band in our task. n.s., not significant.
Fig. S3.
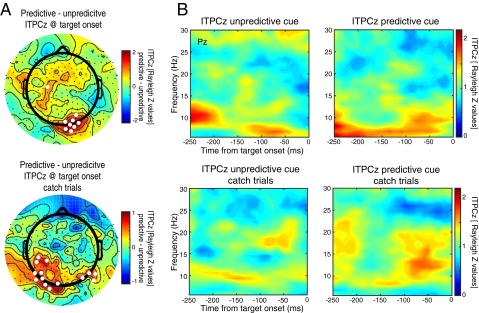
(A) Topographies of differences in intertrial phase clustering derived from the Hilbert transform (scaled to Rayleigh’s Z value; ITPCz) related to temporal predictions. Alpha-band phase clustering at target onset was significantly higher during predictive cue trials compared with unpredictive cue trials (P < 0.05, indicated by white circles) at a number of spatially contiguous posterior sensors. A similar result was found when only catch trials (during which no target was presented) were analyzed. This result suggests that the effect is not due to temporal smearing of target-related processing. (B) Time course of prestimulus ITPCz at electrode Pz for predictive and unpredictive cues (collapsed across delay type) for catch and noncatch trials derived from a wavelet analysis. Both catch (Lower) and noncatch (Upper) trials showed numerically higher ITPCz in the alpha band (8–14 Hz) in the 100 ms before target onset in the predictive cue condition compared with the unproductive cue condition, although these differences were not significant at this electrode.
Temporal Predictions Modulate Peak Alpha-Band Frequency Before Target Onset.
To assess whether these phase differences resulted from a phase reset within a single alpha cycle or from a more gradual change in peak alpha frequency (PAF), we analyzed PAF derived from a fast-Fourier transform (FFT) of the 400 ms before target onset. In effect, we expected to see a speeding up or slowing down of PAF on predictive relative to unpredictive trials. There was no evidence, however, for an increase or decrease in PAF, at the group level, at either delay (P > 0.65 for both trials). Interestingly, the direction of an individual’s shift (i.e., whether his/her PAF on predictive trials sped up or slowed down) was predicted by his/her pretarget PAF on unpredictive trials [r(28) = 0.601, P < 0.001]. Specifically, participants with a lower PAF following unpredictive cues tended to have a higher PAF following predictive cues, and vice versa. This pattern suggests that predictive cues may have led to a convergence on an ideal alpha frequency for the task.
Alpha-Band Phase During Predicted Time Windows Is Biased Toward an Optimal Phase for Perception.
To determine if the observed differences in prestimulus alpha phase were biased toward individuals’ optimal phase for target discrimination, we first tested if optimal performance on the task was associated with a particular phase of alpha. To this end, we collapsed across all trial types, excluding catch trials (20% of trials on which no target was presented), and tested for phase differences at target onset between correct and incorrect trials. This analysis revealed a significant difference [F(1,28) = 8.65, P = 0.0065] between the mean phase angle of alpha oscillations at target onset for trials subsequently answered correctly vs. incorrectly (Fig. 5A). We verified this result using a resampling procedure that equates for the number of trials in each condition (SI Discussion). This result indicates that accuracy was higher at a certain phase of prestimulus alpha oscillations, and hence that there is an optimal phase in the task. We then computed the circular distance between each individual’s mean phase angle at target onset for correct trials and his/her observed phase angle at target onset for each condition. Crucially, we used only catch trials when defining each participant’s distance from his/her optimal phase so as not to “double-dip” in the data by defining the optimal phase with the same data that would later be tested for differences. Taking the absolute value of these distances converts the data into a linear variable that can be analyzed with conventional statistics, and we submitted these distance values to a repeated-measures ANOVA with delay (short, long) and cue type (predictive, unpredictive) as within-subject factors. This analysis revealed a significant main effect of cue type [F(1,14) = 7.01, P = 0.019, ηp2 = 0.33], indicating that alpha phase at predicted, compared with unpredicted, time points was closer to each individual’s optimal phase for stimulus discrimination (Fig. 5 B and C). This finding was observed also when a cluster of electrodes, chosen according to maximal pretarget alpha power, was analyzed (Fig. S1) and was absent when tested with the same EEG data filtered for delta (1–4 Hz), theta (4–7 Hz), and low beta (15–20 Hz) bands, both at electrode Pz (Fig. S4) and at electrode clusters defined by maximal power in each frequency band (Fig. S1).
Fig. 5.

Alpha-band phase at predicted time points is biased toward individuals’ optimal phase for discrimination. (A) Phase histogram showing significant differences between the phase of alpha oscillations at target onset for correct and incorrect trials across all delays. The horizontal black line indicates the number of participants with the corresponding mean phase angle in each bin. The direction of the arrows indicates the mean phase angle, and the length of the arrows indicates the extent to which phases were clustered around the mean. (B) Main effect of temporal cueing on phase bias, demonstrating that predictive cues led to a reduction between the phase at target onset and participants’ optimal phase for stimulus discrimination. *P = 0.019. (C) Phase histograms of the circular distance between each participant’s mean phase angle on correct trials and his/her mean phase angle in each condition, demonstrating greater clustering around participants’ optimal phase (zero degrees) following predictive cues.
Fig. S4.

Because prior work suggests that the phase of delta-band oscillations (1–4 Hz) may be modulated by temporal expectations to optimize auditory detection (1, 53), we ran these same analyses on data from electrode Pz, filtered for other frequency bands. We found no evidence for an optimal delta-band phase (A) or for any phase biasing (B and C). (D) Phases at the sample just before target onset did not differ between correct and incorrect trials in the theta band (4–7 Hz) or low beta band (15–20 Hz), suggesting that these oscillations, at the same electrode and time point used to analyze the alpha data, were not related to task performance, and that our finding that temporal expectations bias the phase of ongoing oscillations toward an optimal phase for visual processing may be specific to the alpha band. n.s., not significant.
Discussion
By manipulating predictions about the time of target appearance during a visually demanding discrimination task, we provide direct evidence that top-down temporal predictions can improve visual discrimination and conscious perception, and that this improvement is accomplished, in part, via modulation of the phase of alpha-band oscillations before target onset. Alpha-phase angle at target onset predicted successful orientation discrimination, revealing an optimal phase for visual processing. Critically, temporal cueing resulted in a bias in pretarget phase toward each individual’s optimal phase angle for visual processing.
Posterior Alpha-Band Oscillations as a Substrate for the Top-Down Control of Visual Processing.
That the phase of alpha was observed to differ just before target onset might suggest that the control of alpha phase occurred in a sudden manner, just at the critical moment for target detection. Alternatively, it could be that the dominant alpha frequency changed throughout the delay period as a result of temporal cueing, such that the oscillation was more likely to be at its optimal phase when the target appeared. Our data support the latter interpretation, in that it was found that participants with slower PAF during unpredictive cue trials tended to show faster PAF during predictively cued trials, and vice versa. This result provides insight into one way in which the alpha rhythm, ubiquitous in visual circuits during all phases of wakefulness, may serve as a substrate for the implementation of top-down control of visual processing. Another example of task-related control of alpha phase has recently been described in a working memory experiment, in which alpha-phase clustering was greater before the anticipated onset of strong, relative to weak, distracting stimuli (30). These two demonstrations of the control of alpha phase add to a large extant body of literature demonstrating that alpha power is also modulated by top-down influences during a wide variety of attentional tasks (reviewed in 31).
Understanding the factors that determine which parameters of the alpha-band oscillation are sensitive to different attentional contingencies is an important goal for future research. For example, a recent study that contrasted attention to visual vs. auditory stimuli reported modality-related change in alpha power, but not phase (32). Notably, however, the two conditions in that study featured equal temporal predictability (unlike the present study) and did not explicitly contrast the strength of distraction [as did Bonnefond et al. (30)]. Interestingly, it has also recently been found that the perceptual benefit of temporal cueing depends on the predicted stimulus appearing in an attended spatial location (32). Because it is known that alpha power modulates retinotopically according to the allocation of spatial attention (33–36), one possibility is that top-down modulations of the phase or frequency of alpha oscillations may reflect temporal expectations at an attended location.
Regarding the source of control of posterior alpha oscillations, converging evidence examining alpha power implicates cortical regions in the dorsal attention network. Alteration of activity in the frontal eye field (FEF) and intraparietal sulcus (IPS) by repetitive transcranial magnetic stimulation has been found to impair spatial attention and attenuate anticipatory alpha-power desynchronization (32). More recently, recordings from simultaneous EEG and event-related optical signals have demonstrated that activity in the IPS and frontal regions, including the FEF, reliably precedes changes in perception-related alpha power (37). These same regions have also been implicated in two recent studies correlating attention-related alpha modulations with simultaneously recorded fMRI responses (38, 39). Whether these regions contribute to the control of the phase of alpha oscillations remains an import question for future research.
Prediction, Attention, and Awareness.
The results presented here touch on two theoretical domains that are currently in flux: One is the domain of temporal prediction vs. temporal attention, and the second is the domain of the independence of attention and consciousness. With regard to the former, although we have used the term “temporal prediction” to refer to the information provided by the cue in our experiments, many others have referred to similar manipulations as temporal attention (18–20, 40). It has recently been suggested that predictive processes can be distinguished from attention processes on the basis that the former reflect the probability of a known event happening, whereas the latter reflect the task relevance of that event (41, 42). Under this interpretation, both attention and prediction are at play in our task because the time window in which the target appears is both predictable and task-relevant (i.e., a response is required). Because a conceptual distinction between attention and prediction is a relativity recent proposal, virtually no studies have independently manipulated temporal attention and temporal prediction, and examined subsequent effects on visual perception and neural processing.
Our data also touch on the putative independence of attention and consciousness, by virtue of recording not only discrimination accuracy but also participants’ subjective visual awareness. It has recently been argued that attention and consciousness are distinct processes, as evinced by experiments demonstrating that spatial attention can independently modulate discrimination performance and subjective visibility (43, 44). In experiment 1, we found that temporal predictions, with short delays, increased both subject and objective measures of perception, revealing no indication of independent modulation. Similarly, in experiment 2, using a more fine-grained scale of subjective awareness, we found that temporal cueing had the same pattern of statistical effects on accuracy as it did on subjective awareness, again failing to reveal dissociation. Because this topic has received virtually no investigation, future work independently manipulating stimulus visibility, temporal attention, and temporal prediction could possibly reveal another dimension along which consciousness dissociates from other high-level cognitive processes.
Conclusions
Our findings demonstrate that well-known effects of temporal cueing on response time extend to accuracy and subjective visibility and that temporal prediction biases alpha phase toward an optimal phase for visual processing during predicted moments. Whereas prior work has demonstrated the importance of alpha oscillations by examining how spontaneous fluctuations in phase affect perception, we show here that the phase of alpha oscillations has an active role in information processing, serving as a mechanism for the implementation of the top-down control of visual processing based on temporal predictions.
Materials and Methods
Participants.
Twenty-six participants (eight male, age range: 18–29 y) completed experiment 1, and 17 completed experiment 2. Data from two participants in experiment 2 were excluded, one due to fatigue (performance fell to chance) and one due to excessive movement artifacts, leaving 15 participants in the final sample (four male; age range: 19–30 y). All were recruited from the University of Wisconsin-Madison community and were compensated monetarily. All participants reported right-handedness and normal or normal-to-corrected visual acuity and color vision. None reported any medical, neurological, or psychiatric illness. The University of Wisconsin-Madison Institutional Review Board approved the studies.
Stimuli.
Stimulus presentation was controlled with PsychoPy (45) and presented on a 53-cm iMac monitor (resolution, 1,920 × 1,080; refresh rate, 60 Hz) at a viewing distance of ∼61 cm. Targets were backward-masked Gabor patches that were 80 × 80 pixels in size and were presented at the center of the monitor atop a gray background. Gabors had a spatial frequency of one cycle every 10 pixels, and were rotated either 45° or 135° from horizontal, right and left, respectively. Novel masks were generated for each trial by filling in a circular aperture the size of each Gabor with randomly arranged black and white pixels. Centrally presented fixation crosses colored blue, yellow, or green served as symbolic cues indicating the temporal predictability between the cue and target.
Procedure.
In experiment 1, the participant’s task was to make a two-alternative, forced-choice orientation discrimination of a Gabor patch rotated to the left or right (see SI Materials and Methods). On each experimental trial (Fig. 1), a Gabor was presented for 50 ms, followed by a 50-ms stimulus onset asynchrony (SOA) and then a 50-ms mask. To stress accuracy over speed for each response, the text “Left or Right?” was presented 300 ms after the offset of the mask and participants were instructed to provide a nonspeeded left/right decision using the left and right arrow keys, respectively. After each discrimination response, a second query with the text “Seen or Guess?” prompted participants to indicate if they saw the stimulus or if they were guessing (46) by using the left and right arrow keys, respectively. Participants used their right hand to make both responses. Responses were followed by a blank-screen intertrial interval of random duration bounded by 1,000 ms and 1,500 ms.
We manipulated temporal predictions by presenting symbolic cues (colored fixation crosses) for 100 ms that indicated with 100% reliability whether target Gabors would appear after a short (650 ms), long (1,400 ms), or unpredictable (randomly chosen to be 650, 900, 1,150, or 1,400 ms) delay following the cue. Only two cue types were presented in any block, such that each block contained only short and unpredictable cues or long and unpredictable cues. Participants were informed of which color corresponded to which delay length at the start of each block. A block consisted of 40 predictable and 40 unpredictable cue trials presented in random order. Each participant completed six blocks, resulting in a total of 120 predictable short-delay trials, 120 predictable long-delay trials, and 60 of each of the four unpredictable-delay durations.
In the following analyses, we considered only trials in which targets appeared after the same short or long delay following a cue, but were preceded by either predictive or unpredictive cues. In other words, the two intermediate unpredictive cue delays (900 and 1,150 ms) were not used in any analysis but served to make the unpredictive cue less temporally informative. This comparison was chosen to control for the duration of the delay between the cue and the target. Block order and cue color assignments were counterbalanced across participants. Before the experimental task, each participant completed 20 reversals of an up-down adaptive staircase procedure in which the contrast of the Gabor was adjusted to achieve a task difficulty of ∼84% discrimination accuracy using only unpredictive cue trials. The average contrast during the last of the six reversals was used as the target contrast for the remainder of the experiment. Task time was approximately 1 h. The task used in experiment 2 was identical to the task used in experiment 1 with a few exceptions, which are noted in SI Materials and Methods.
EEG Recording and Analysis.
EEG data were recorded using a high-impedance 256-electrode net with an EGI amplifier and Netstation acquisition software. The impedance of each electrode was kept below 100 kΩ, and the sampling rate was 500 Hz. Data were recorded with an online bandwidth of 0.1–200 Hz, and originally referenced to electrode Cz. Offline processing and analysis were performed using EEGLAB (47) and custom scripts in MATLAB (MathWorks). First, trials containing visually identified eye movement or muscle artifacts within 300 ms before or after cue or target onset were excluded. Visually identified noisy electrodes (on average, 2.6% of electrodes) were spherically interpolated. Data were then rereferenced to the average reference. The following analysis was conducted at electrode Pz, based on the topography of alpha power we observed (Fig. 3A) and on where alpha-phase effects on visual perception were previously reported (6). A further analysis of a cluster of 10 electrodes based on maximal delay period alpha power showed comparable effects (Fig. S1). For each trial, data from −1.5 to 2.5 s centered on cue onset were band-pass–filtered with a Hamming windowed-sinc finite impulse response zero-phase filter (EEGLAB function pop_eegfiltnew.m) between 9 and 13 Hz. The filter order was defined to be 25% of the lower passband edge. Instantaneous phase was extracted from the single-trial–filtered data by taking the phase angle (MATLAB function angle.m) of the Hilbert transformed data (MATLAB function hilbert.m). This method of estimating phase is comparable to wavelet and FFT approaches (48) and has been used in a number of prior electrophysiology experiments (24, 49, 50). This procedure resulted in a time series of phase values from −1.5 s before to 2.5 s following cue onset that is equal in size to the input data. Circular statistics were computed using the Circular Statistics Toolbox for MATLAB (23). We also conducted an FFT analysis in which a zero-padded FFT was applied to each participant’s averaged alpha time series for each condition from 400 ms before target onset. From this analysis, we extracted the PAF for each condition and participant, defined as the frequency at which amplitude was maximal.
SI Materials and Methods
The task was identical to the task used in experiment 1 with a few exceptions. We increased the number of blocks from six to eight (for a total of 160 predictable short-delay trials, 160 predictable long-delay trials, and 80 of each of the four unpredictable-delay durations), and 20% of all trials were made into catch trials in which a mask but no target was presented. Additionally, the interval between mask offset and the two-alternative forced-choice (2AFC) response screen was extended from 300 to 400 ms, to afford analysis of the EEG response to the target without contamination from the onset of the response screen. We also used a more difficult staircase before the main task, aimed at achieving 79% accuracy to ensure that some participants were not at ceiling level. Lastly, we replaced the seen or guess judgment with the four-point perceptual awareness scale to obtain a more fine-grained assessment of subjective visibility using an established scale. Participants performed the 2AFC response with the “9” or “0” key, using their right hand, and the PAS rating with the “1”, “2,” “3,” or “4” key, using their left hand.
SI Discussion
Alpha-Phase Clustering at Target Onset Increases Following Predictive Cues.
To test further whether predictive cues led to alpha-band phase biasing at target onset, we computed intertrial phase clustering (ITPC; also known as the phase-locking factor or intertrial coherence) at target onset for predictive and unpredictive cues (Fig. S3A). We computed ITPC separately for correct trials and for catch trials using the same alpha-filtered, Hilbert-transformed data that were used in all other analyses. ITPC is a measure of the phase consistency across trials at a given time point, and it varies from 0 to 1, where 0 corresponds to no phase clustering and 1 to perfect clustering across trials. For each subject and condition, IPTC values were transformed into Rayleigh’s Z values to correct for differences in trial numbers between conditions (51) according to the formula ITPCz = n⋅ITPC2, where n equals the number of trials that went into each ITPC calculation. Differences in ITPCz at target onset were then tested at each electrode using paired-sample t tests. Fig. S3A shows the topography of differences between predictive and unpredictive cues, with electrodes displaying significantly higher ITPCz following predictive compared with unpredictive cues highlighted in white (thresholded at P < 0.05). Two sensors in the catch trial analysis showed significantly lower ITPCz for predictive trials, but they were nonspatially contiguous and likely reflect spurious effects. We performed this analysis for both correct trials in which a target was presented and for catch trials during which no target was presented. Both analyses revealed clusters of posterior sensors that showed significantly elevated ITPCz at target onset following predictive compared with unpredictive cues. The topography of the effect was somewhat different during catch trials, perhaps because there were many fewer trials (catch trials occurred on 20% of trials) in this analysis. This finding demonstrates that posterior alpha-band phase was significantly more clustered as a result of temporal predictions.
We also computed ITPCz in the prestimulus time window at frequencies between 5 and 30 Hz. Time-frequency decompositions were performed in EEGLAB for 25 linearly spaced frequencies between 5 Hz and 30 Hz, extracted from epochs spanning −1,000 to 500 ms centered on target onset and using wavelets of three cycles at the lowest frequency to 10 cycles at the highest frequency. Only the 250 ms before target onset is shown here (Fig. S3B) to avoid saturation of the color map from the cue-evoked and target-evoked responses. There was nonzero alpha-band ITPCz in the unpredictive cue trials, suggesting some phase locking as a result of the cue, and numerically higher (although nonsignificant at this electrode) prestimulus ITPC in the alpha band following predictive cues. We collapsed across short and long delays in these analyses to maximize the number of catch trials and because the statistical effect observed in our prior analysis (Fig. 5B) was a main effect of predictability.
Target-Evoked Responses Cannot Account for Prestimulus Phase Differences.
Recent work has suggested caution in interpreting prestimulus phase differences because they can potentially arise as an artifact of temporal smearing of the stimulus-evoked response, due to common filtering procedures (52). To ensure that target-evoked responses could not account for the pretarget phase differences we observed, we analyzed the magnitude of the evoked responses to the targets as a function of cue type and delay. Paired t tests at each posttarget time point (0–600 ms, centered at target onset) revealed no significant differences between predictive and unpredictive cues for both short and long delays (all uncorrected P > 0.20). Thus, target-evoked differences could not likely account for our pretarget phase effects. Furthermore, systematic investigation of the issue with real and simulated data (52) only found evidence for artifactual smearing in slower, less time-resolved frequency ranges (i.e., below 7 Hz). We did not observe artifacts in the alpha band. The fact that we did not observe differences in the pretarget phase biasing in the lower frequency bands (delta or theta; Figs. S1 and S4), where they would be expected if posttarget data were driving the effect, further suggests that the evoked response is not responsible for the pretarget phase differences.
Alpha Phase at Target Onset Differs as a Function of Task Accuracy When Controlling for the Number of Trials in Each Condition.
To ensure that our observation that alpha phase at target onset differed between correct and incorrect trials was not due to the difference in the number of trials used in each condition, we conducted a resampling analysis in which we equated for the number of trials (similar to the analysis used by ref. 9). Trials were randomly sampled from each condition so that the minimum number of trials in each condition was matched within each subject. Phase angle differences were then assessed at the group level (as was done in the original analysis), based on the average phase angles of seen and unseen trials. This procedure was iterated 80,000 times to ensure that all trials were used and that reliable estimates were obtained. The F statistic was recorded after each iteration, and the resulting average F value from this analysis was 4.91, which resulted in a significant P value of 0.043. This analysis was repeated five times, and the first three decimal places of the resulting P value remained unchanged. Thus, when the number of trials is equated for, we still observe a significant difference in the phase angle of alpha at target onset as a function of task accuracy.
Supplementary Material
Footnotes
The authors declare no conflict of interest.
This article is a PNAS Direct Submission.
This article contains supporting information online at www.pnas.org/lookup/suppl/doi:10.1073/pnas.1503686112/-/DCSupplemental.
References
- 1.Arnal L-H, Giraud A-L. Cortical oscillations and sensory predictions. Trends Cogn Sci. 2012;16(7):390–398. doi: 10.1016/j.tics.2012.05.003. [DOI] [PubMed] [Google Scholar]
- 2.Summerfield C, de Lange FP. Expectation in perceptual decision making: Neural and computational mechanisms. Nat Rev Neurosci. 2014;15(11):745–756. doi: 10.1038/nrn3838. [DOI] [PubMed] [Google Scholar]
- 3.Jensen O, Mazaheri A. Shaping functional architecture by oscillatory alpha activity: Gating by inhibition. Front Hum Neurosci. 2010;4:186. doi: 10.3389/fnhum.2010.00186. [DOI] [PMC free article] [PubMed] [Google Scholar]
- 4.Mathewson KE, et al. Pulsed out of awareness: EEG alpha oscillations represent a pulsed-inhibition of ongoing cortical processing. Front Psychol. 2011;2:99. doi: 10.3389/fpsyg.2011.00099. [DOI] [PMC free article] [PubMed] [Google Scholar]
- 5.Busch NA, Dubois J, VanRullen R. The phase of ongoing EEG oscillations predicts visual perception. J Neurosci. 2009;29(24):7869–7876. doi: 10.1523/JNEUROSCI.0113-09.2009. [DOI] [PMC free article] [PubMed] [Google Scholar]
- 6.Mathewson KE, Gratton G, Fabiani M, Beck D-M, Ro T. To see or not to see: Prestimulus alpha phase predicts visual awareness. J Neurosci. 2009;29(9):2725–2732. doi: 10.1523/JNEUROSCI.3963-08.2009. [DOI] [PMC free article] [PubMed] [Google Scholar]
- 7.Dugué L, Marque P, VanRullen R. The phase of ongoing oscillations mediates the causal relation between brain excitation and visual perception. J Neurosci. 2011;31(33):11889–11893. doi: 10.1523/JNEUROSCI.1161-11.2011. [DOI] [PMC free article] [PubMed] [Google Scholar]
- 8.Scheeringa R, Mazaheri A, Bojak I, Norris DG, Kleinschmidt A. Modulation of visually evoked cortical FMRI responses by phase of ongoing occipital alpha oscillations. J Neurosci. 2011;31(10):3813–3820. doi: 10.1523/JNEUROSCI.4697-10.2011. [DOI] [PMC free article] [PubMed] [Google Scholar]
- 9.Hanslmayr S, Volberg G, Wimber M, Dalal SS, Greenlee M-W. Prestimulus oscillatory phase at 7 Hz gates cortical information flow and visual perception. Curr Biol. 2013;23(22):2273–2278. doi: 10.1016/j.cub.2013.09.020. [DOI] [PubMed] [Google Scholar]
- 10.Myers NE, Stokes MG, Walther L, Nobre AC. Oscillatory brain state predicts variability in working memory. J Neurosci. 2014;34(23):7735–7743. doi: 10.1523/JNEUROSCI.4741-13.2014. [DOI] [PMC free article] [PubMed] [Google Scholar]
- 11.Nobre A, Correa A, Coull J. The hazards of time. Curr Opin Neurobiol. 2007;17(4):465–470. doi: 10.1016/j.conb.2007.07.006. [DOI] [PubMed] [Google Scholar]
- 12.Correa A. Enhancing behavioural performance by visual temporal orienting. In: Nobre AC, Coull JT, editors. Attention and Time. Oxford Univ Press; New York: 2010. pp. 357–370. [Google Scholar]
- 13.Martens S, Johnson A. Timing attention: Cuing target onset interval attenuates the attentional blink. Mem Cognit. 2005;33(2):234–240. doi: 10.3758/bf03195312. [DOI] [PubMed] [Google Scholar]
- 14.Correa A, Lupiáñez J, Tudela P. Attentional preparation based on temporal expectancy modulates processing at the perceptual level. Psychon Bull Rev. 2005;12(2):328–334. doi: 10.3758/bf03196380. [DOI] [PubMed] [Google Scholar]
- 15.Correa A, Sanabria D, Spence C, Tudela P, Lupiáñez J. Selective temporal attention enhances the temporal resolution of visual perception: Evidence from a temporal order judgment task. Brain Res. 2006;1070(1):202–205. doi: 10.1016/j.brainres.2005.11.094. [DOI] [PubMed] [Google Scholar]
- 16.Vangkilde S, Coull JT, Bundesen C. Great expectations: Temporal expectation modulates perceptual processing speed. J Exp Psychol Hum Percept Perform. 2012;38(5):1183–1191. doi: 10.1037/a0026343. [DOI] [PubMed] [Google Scholar]
- 17.Ramsøy TZ, Overgaard M. Introspection and subliminal perception. Phenom Cogn Sci. 2004;3(1):1–23. [Google Scholar]
- 18.Correa A, Lupiáñez J, Milliken B, Tudela P. Endogenous temporal orienting of attention in detection and discrimination tasks. Percept Psychophys. 2004;66(2):264–278. doi: 10.3758/bf03194878. [DOI] [PubMed] [Google Scholar]
- 19.Griffin IC, Miniussi C, Nobre AC. Multiple mechanisms of selective attention: Differential modulation of stimulus processing by attention to space or time. Neuropsychologia. 2002;40(13):2325–2340. doi: 10.1016/s0028-3932(02)00087-8. [DOI] [PubMed] [Google Scholar]
- 20.Miniussi C, Wilding EL, Coull JT, Nobre AC. Orienting attention in time. Modulation of brain potentials. Brain. 1999;122(Pt 8):1507–1518. doi: 10.1093/brain/122.8.1507. [DOI] [PubMed] [Google Scholar]
- 21.Los SA, van den Heuvel CE. Intentional and unintentional contributions to nonspecific preparation during reaction time foreperiods. J Exp Psychol Hum Percept Perform. 2001;27(2):370–386. doi: 10.1037//0096-1523.27.2.370. [DOI] [PubMed] [Google Scholar]
- 22.Coull JT, Nobre AC. Where and when to pay attention: The neural systems for directing attention to spatial locations and to time intervals as revealed by both PET and fMRI. J Neurosci. 1998;18(18):7426–7435. doi: 10.1523/JNEUROSCI.18-18-07426.1998. [DOI] [PMC free article] [PubMed] [Google Scholar]
- 23.Berens P. CircStat: A MATLAB toolbox for circular statistics. J Stat Softw. 2009;31:1–21. [Google Scholar]
- 24.Arnal LH, Doelling KB, Poeppel D. Delta-beta coupled oscillations underlie temporal prediction accuracy. Cereb Cortex 2014 doi: 10.1093/cercor/bhu103. , 10.1093/cercor/bhu103. [DOI] [PMC free article] [PubMed] [Google Scholar]
- 25.Busch NA, VanRullen R. Spontaneous EEG oscillations reveal periodic sampling of visual attention. Proc Natl Acad Sci USA. 2010;107(37):16048–16053. doi: 10.1073/pnas.1004801107. [DOI] [PMC free article] [PubMed] [Google Scholar]
- 26.Britz J, Díaz Hernàndez L, Ro T, Michel CM. EEG-microstate dependent emergence of perceptual awareness. Front Behav Neurosci. 2014;8:163. doi: 10.3389/fnbeh.2014.00163. [DOI] [PMC free article] [PubMed] [Google Scholar]
- 27.Diederich A, Schomburg A, van Vugt M. Fronto-central theta oscillations are related to oscillations in saccadic response times (SRT): An EEG and behavioral data analysis. PLoS ONE. 2014;9(11):e112974. doi: 10.1371/journal.pone.0112974. [DOI] [PMC free article] [PubMed] [Google Scholar]
- 28.Storey JD. A direct approach to false discovery rates. J R Stat Soc Series B Stat Methodol. 2002;64:479–498. [Google Scholar]
- 29.Bonnefond M, Jensen O. Alpha oscillations serve to protect working memory maintenance against anticipated distracters. Curr Biol. 2012;22(20):1969–1974. doi: 10.1016/j.cub.2012.08.029. [DOI] [PubMed] [Google Scholar]
- 30.Foxe JJ, Snyder AC. The role of alpha-band brain oscillations as a sensory suppression mechanism during selective attention. Front Psychol. 2011;2:154. doi: 10.3389/fpsyg.2011.00154. [DOI] [PMC free article] [PubMed] [Google Scholar]
- 31.van Diepen RM, Cohen MX, Denys D, Mazaheri A. Attention and temporal expectation modulate power, not phase, of ongoing alpha oscillations. J Cogn Neurosci 2015 doi: 10.1162/jocn_a_00803. , 10.1162/jocn_a_00803. [DOI] [PubMed] [Google Scholar]
- 32.Rohenkohl G, Gould IC, Pessoa J, Nobre AC. Combining spatial and temporal expectations to improve visual perception. J Vis. 2014;14(4):8. doi: 10.1167/14.4.8. [DOI] [PMC free article] [PubMed] [Google Scholar]
- 33.Capotosto P, Babiloni C, Romani GL, Corbetta M. Frontoparietal cortex controls spatial attention through modulation of anticipatory alpha rhythms. J Neurosci. 2009;29(18):5863–5872. doi: 10.1523/JNEUROSCI.0539-09.2009. [DOI] [PMC free article] [PubMed] [Google Scholar]
- 34.Worden MS, Foxe JJ, Wang N, Simpson GV. Anticipatory biasing of visuospatial attention indexed by retinotopically specific α-band electroencephalography increases over occipital cortex. J Neurosci. 2000;20(6):RC63. doi: 10.1523/JNEUROSCI.20-06-j0002.2000. [DOI] [PMC free article] [PubMed] [Google Scholar]
- 35.Sauseng P, et al. A shift of visual spatial attention is selectively associated with human EEG alpha activity. Eur J Neurosci. 2005;22(11):2917–2926. doi: 10.1111/j.1460-9568.2005.04482.x. [DOI] [PubMed] [Google Scholar]
- 36.Kelly SP, Lalor EC, Reilly RB, Foxe JJ. Increases in alpha oscillatory power reflect an active retinotopic mechanism for distracter suppression during sustained visuospatial attention. J Neurophysiol. 2006;95(6):3844–3851. doi: 10.1152/jn.01234.2005. [DOI] [PubMed] [Google Scholar]
- 37.Mathewson KE, et al. Dynamics of alpha control: Preparatory suppression of posterior alpha oscillations by frontal modulators revealed with combined EEG and event-related optical signal. J Cogn Neurosci. 2014;26(10):2400–2415. doi: 10.1162/jocn_a_00637. [DOI] [PMC free article] [PubMed] [Google Scholar]
- 38.Zumer JM, Scheeringa R, Schoffelen JM, Norris DG, Jensen O. Occipital alpha activity during stimulus processing gates the information flow to object-selective cortex. PLoS Biol. 2014;12(10):e1001965. doi: 10.1371/journal.pbio.1001965. [DOI] [PMC free article] [PubMed] [Google Scholar]
- 39.Liu Y, Bengson J, Huang H, Mangun GR, Ding M. Top-down modulation of neural activity in anticipatory visual attention: Control mechanisms revealed by simultaneous EEG-fMRI. Cereb Cortex 2014 doi: 10.1093/cercor/bhu204. , 10.1093/cercor/bhu204. [DOI] [PMC free article] [PubMed] [Google Scholar]
- 40.Correa A, Lupiáñez J, Madrid E, Tudela P. Temporal attention enhances early visual processing: A review and new evidence from event-related potentials. Brain Res. 2006;1076(1):116–128. doi: 10.1016/j.brainres.2005.11.074. [DOI] [PubMed] [Google Scholar]
- 41.Kok P, Jehee JFM, de Lange FP. Less is more: Expectation sharpens representations in the primary visual cortex. Neuron. 2012;75(2):265–270. doi: 10.1016/j.neuron.2012.04.034. [DOI] [PubMed] [Google Scholar]
- 42.Kok P, Rahnev D, Jehee JFM, Lau HC, de Lange FP. Attention reverses the effect of prediction in silencing sensory signals. Cereb Cortex. 2012;22(9):2197–2206. doi: 10.1093/cercor/bhr310. [DOI] [PubMed] [Google Scholar]
- 43.Rahnev D, et al. Attention induces conservative subjective biases in visual perception. Nat Neurosci. 2011;14(12):1513–1515. doi: 10.1038/nn.2948. [DOI] [PubMed] [Google Scholar]
- 44.van Boxtel JJA, Tsuchiya N, Koch C. Consciousness and attention: On sufficiency and necessity. Front Psychol. 2010;1:217. doi: 10.3389/fpsyg.2010.00217. [DOI] [PMC free article] [PubMed] [Google Scholar]
- 45.Peirce JW. PsychoPy-Psychophysics software in Python. J Neurosci Methods. 2007;162(1-2):8–13. doi: 10.1016/j.jneumeth.2006.11.017. [DOI] [PMC free article] [PubMed] [Google Scholar]
- 46.Lau HC, Passingham RE. Relative blindsight in normal observers and the neural correlate of visual consciousness. Proc Natl Acad Sci USA. 2006;103(49):18763–18768. doi: 10.1073/pnas.0607716103. [DOI] [PMC free article] [PubMed] [Google Scholar]
- 47.Delorme A, Makeig S. EEGLAB: An open source toolbox for analysis of single-trial EEG dynamics including independent component analysis. J Neurosci Methods. 2004;134(1):9–21. doi: 10.1016/j.jneumeth.2003.10.009. [DOI] [PubMed] [Google Scholar]
- 48.Bruns A. Fourier-, Hilbert- and wavelet-based signal analysis: Are they really different approaches? J Neurosci Methods. 2004;137(2):321–332. doi: 10.1016/j.jneumeth.2004.03.002. [DOI] [PubMed] [Google Scholar]
- 49.Wang L, Saalmann YB, Pinsk MA, Arcaro MJ, Kastner S. Electrophysiological low-frequency coherence and cross-frequency coupling contribute to BOLD connectivity. Neuron. 2012;76(5):1010–1020. doi: 10.1016/j.neuron.2012.09.033. [DOI] [PMC free article] [PubMed] [Google Scholar]
- 50.Voytek B, D’Esposito M, Crone N, Knight RT. A method for event-related phase/amplitude coupling. Neuroimage. 2013;64:416–424. doi: 10.1016/j.neuroimage.2012.09.023. [DOI] [PMC free article] [PubMed] [Google Scholar]
- 51.Fisher NI. Statistical Analysis of Circular Data. Cambridge Univ Press; Cambridge, UK: 1993. [Google Scholar]
- 52.Zoefel B, Heil P. Detection of near-threshold sounds is independent of EEG phase in common frequency bands. Front Psychol. 2013;4:262. doi: 10.3389/fpsyg.2013.00262. [DOI] [PMC free article] [PubMed] [Google Scholar]
- 53.Stefanics G, et al. Phase entrainment of human delta oscillations can mediate the effects of expectation on reaction speed. J Neurosci. 2010;30(41):13578–13585. doi: 10.1523/JNEUROSCI.0703-10.2010. [DOI] [PMC free article] [PubMed] [Google Scholar]