

Significance
Although β-amyloid (Aβ) peptides participate in the pathogenesis of Alzheimer’s disease (AD), the mechanisms that regulate Aβ production are poorly understood. Here, we demonstrate that activation of the nuclear receptor peroxisome proliferator-activated receptor α (PPARα) upregulates transcription of the “a disintegrin and metalloproteinase” 10 (Adam10) gene and shifts APP processing toward the α-secretase pathway. These findings suggest PPARα could be a therapeutic target for reducing Aβ burden in AD.
Keywords: PPARalpha, ADAM10, APP, Alzheimer's disease
Abstract
Amyloid precursor protein (APP) derivative β-amyloid (Aβ) plays an important role in the pathogenesis of Alzheimer’s disease (AD). Sequential proteolysis of APP by β-secretase and γ-secretase generates Aβ. Conversely, the α-secretase “a disintegrin and metalloproteinase” 10 (ADAM10) cleaves APP within the eventual Aβ sequence and precludes Aβ generation. Therefore, up-regulation of ADAM10 represents a plausible therapeutic strategy to combat overproduction of neurotoxic Aβ. Peroxisome proliferator-activated receptor α (PPARα) is a transcription factor that regulates genes involved in fatty acid metabolism. Here, we determined that the Adam10 promoter harbors PPAR response elements; that knockdown of PPARα, but not PPARβ or PPARγ, decreases the expression of Adam10; and that lentiviral overexpression of PPARα restored ADAM10 expression in Ppara−/− neurons. Gemfibrozil, an agonist of PPARα, induced the recruitment of PPARα:retinoid x receptor α, but not PPARγ coactivator 1α (PGC1α), to the Adam10 promoter in wild-type mouse hippocampal neurons and shifted APP processing toward the α-secretase, as determined by augmented soluble APPα and decreased Aβ production. Accordingly, Ppara−/− mice displayed elevated SDS-stable, endogenous Aβ and Aβ1–42 relative to wild-type littermates, whereas 5XFAD mice null for PPARα (5X/α−/−) exhibited greater cerebral Aβ load relative to 5XFAD littermates. These results identify PPARα as an important factor regulating neuronal ADAM10 expression and, thus, α-secretase proteolysis of APP.
Alzheimer’s disease (AD) is the most prevalent neurodegenerative disease. Although the precise physiologic changes that trigger development of AD remain unknown, abnormal metabolism of the type 1 transmembrane amyloid precursor protein (APP) into amyloid-β (Aβ) plays a causative role in AD (1). Sequential proteolytic processing of APP by the aspartic proteases β-secretase 1 (BACE1) and γ-secretase (reviewed in ref. 2) at ectodomain and intramembrane sites, respectively, generates pathogenic Aβ fragments between residues 36 and 43. Conversely, juxtamembrane cleavage of APP between K16/L17 residues by α-secretase precludes Aβ generation and results in clearance of APP (3).
Several proteases have been suggested as AD-relevant α-secretases, many of which belong to the “a disintegrin and metalloproteinase” (ADAM) Zn2+ sheddase family (reviewed in ref. 4) and include ADAM9, ADAM10, and ADAM17. However, ADAM10 has emerged as the constitutive and inducible APP α-secretase in neurons (5). Of note, ADAM9 and ADAM17 do not recover α-secretase proteolysis of APP in the absence of ADAM10 (5), neuron-specific overexpression of ADAM10 decreases Aβ load in a mouse model of AD (6), and impaired ADAM10 trafficking to the synapse generates a model of sporadic AD (7). Similarly, human studies have observed deficits in ADAM10 expression (8), trafficking (9), and activity (10) in AD. Therefore, dysregulation of ADAM10 may play a significant role in the establishment of Aβ pathology. However, little is known about the genetic regulation of ADAM10.
Peroxisome proliferator-activated receptor (PPAR)-α is a transcription factor that regulates genes involved in fatty acid transport and catabolism. Although the hippocampus does not metabolize fat, recently we have demonstrated that PPARα is constitutively expressed in the hippocampus and hippocampal neurons (11). Here, we describe that activation of PPARα induces the expression of ADAM10 and subsequent α-secretase proteolysis of APP. Furthermore, 5XFAD mice null for PPARα (5X/α−/−) exhibited exacerbated brain Aβ load relative to traditional 5XFAD mice. These results highlight the importance of PPARα in reducing endogenous Aβ production by shifting APP processing toward the α-secretase pathway.
Results
PPARα Modulates ADAM10 Expression.
To determine the roles of PPAR family members in the expression of APP-relevant secretases, expression of the α-secretases ADAM9, ADAM10, and ADAM17; the β-secretase BACE1; and the γ-secretase catalytic component presenilin-1 were measured in the hippocampus and frontal cortex of transgenic mice null for PPARα (Ppara−/−) and PPARβ (Pparb−/−) and in wild-type (WT) neurons transduced with PPARγ shRNA (PpargKD) (Fig. S1A), as PPARγ-null mutations are embryonically lethal (12). Expression of Adam10 (Fig. 1A), but not Adam9 (Fig. S1B), Adam17 (Fig. 1B), Bace1 (Fig. 1C), and Psen1 (Fig. 1D), mRNA was significantly reduced in the hippocampus [F(2,6) = 18.480; P = 0.003] and frontal cortex [F(2,6) = 20.302; P = 0.002] of 4-mo-old Ppara−/−, but not Pparb−/−, animals relative to WT controls or in WT neurons silenced for PPARγ relative to empty vector-transduced neurons. Next, we determined the subcellular expression of ADAM10 and ADAM17. After removal of the prodomain, enzymatically mature ADAMs are transported to the cell membrane. Accordingly, mature ADAM10 (mA10) and ADAM17 (mA17) were enriched in membrane fractions prepared from hippocampi extracted from 4-mo-old WT mice (Fig. 1E). Nondenaturing solubilization of the membrane pellet (or the hippocampus as a whole) in 1% CHAPS buffer greatly increased the extraction of a truncated, transmembrane C-terminal ADAM10 fragment (A10CTF) (13). Using a subcellular prefractionation protocol, we found that membrane expression of precursor A10 (pA10) (Fig. 1 F and G), mA10 (Fig. 1 F and H), and A10CTF (Fig. 1F and Fig. S1C), but not pA17 (Fig. 1 F and I), mA17 (Fig. 1 F and J), and A17CTF (Fig. 1F and Fig. S1D), was significantly impaired in the hippocampus [pA10, F(2,6) = 19.418 (P = 0.002); mA10, F(2,6) = 14.707 (P = 0.005); A10CTF, F(2,6) = 15.690 (P = 0.004)] and frontal cortex [pA10, F(2,6) = 19.519 (P = 0.002); mA10, F(2,6) = 34.704 (P = 0.001); A10CTF, F(2,6) = 12.369 (P = 0.007)] of 4-mo-old Ppara−/−, but not Pparb−/−, animals relative to WT controls or in WT neurons silenced for PPARγ relative to empty vector-transduced neurons. In contrast, Pparα−/− mice did not differ significantly from WT mice in terms of hippocampal, CHAPS-soluble BACE1 (Fig. 1K) or presenilin-1 (PS1) (Fig. 1L) expression. These results suggest that transcription and subcellular localization of ADAM10 is impaired in animals null for PPARα.
Fig. S1.
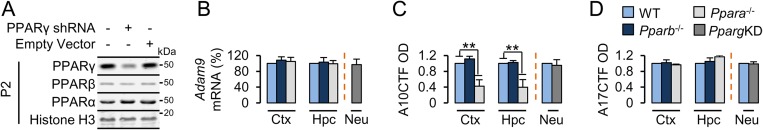
(A) Representative immunoblots of PPARγ, PPARβ, and PPARα in nuclear extracts prepared from 18DIV WT neurons transfected for 48 h with a PPARγ-shRNA plasmid (OriGene #TG320459) or empty vector (OriGene #TR30013). Histone H3 served as loading control. (B) Quantitative PCR results of Adam9 mRNA expression in the hippocampus and cortex of 4-mo-old WT, Ppara−/−, and Pparb−/− animals or in 18DIV WT neurons knocked down for PPARγ (PpargKD). Values are corrected for Gapdh and are expressed as percentage of WT. (C and D) Quantification of C-terminal-cleaved ADAM10 (A10CTF; C) and ADAM17 (A17CTF; D) membrane expression in the hippocampus and cortex of 4-mo-old WT, Ppara−/−, and Pparb−/− animals or in 18DIV PpargKD neurons. Representative immunoblots are presented in Fig. 1F. Values are corrected for β-tubulin, indicate the mean ± SEM relative to WT, and represent n = 3 or 4 for each condition. **P < 0.01, using two-way ANOVA. Ctx, cortex; Hpc, hippocampus; KD, knockdown; Neu, neurons; OD, relative optical density.
Fig. 1.

PPARα deficiency results in impaired ADAM10 expression. (A–D) Quantitative PCR results of Adam10 (A), Adam17 (B), Bace1 (C), and Psen1 (D) mRNA expression in the hippocampus and cortex of 4-mo-old WT Ppara−/− and Pparb−/− animals or in WT neurons knocked down for PPARγ (PpargKD). Values are corrected for Gapdh and are expressed as percentage of WT. (E) Subcellular and detergent-soluble (1% CHAPS) expression of precursor (pA10) and mature (mA10) ADAM10 and COOH terminus cleaved ADAM10 (A10CTF) or precursor (pA17) and mature (mA17) ADAM17 in hippocampi from 4-mo-old WT animals. (F–J) Representative immunoblots (F) and quantification of pA10 (G), mA10 (H), A10CTF, pA17 (I), mA17 (J), and A17CTF membrane expression in the hippocampus and cortex of 4-mo-old WT, Ppara−/− and Pparb−/− animals or in 18DIV PpargKD neurons. (K and L) Representative immunoblots of detergent-soluble BACE1 (K), N-terminal and C-terminal presenilin-1 (PS1NT and PS1CT, respectively) (L) expression in the hippocampus of 4-mo-old Ppara WT (+/+) and null (−/−) animals. Values are corrected for α-tubulin, indicate the mean ± SEM relative to WT, and represent n = 3 or 4 for each genotype. *P < 0.05 and **P < 0.01 using one-way ANOVA. Ctx, cortex; Hpc, hippocampus; KD, knockdown; Neu, neurons; OD, relative optical density. ●, nonspecific band.
Next, we examined whether PPARα agonists could augment ADAM10 levels. Using serially isolated neurons [18 d in vitro (DIV)], astrocytes (14DIV), and microglia (16DIV) from the same E18 WT hippocampi, an enrichment of membrane-bound ADAM10 in neurons and astrocytes was observed (Fig. S1A), suggesting these cells as primary sources of brain ADAM10. Because it was suggested that neuronal activity regulates Aβ generation (14) and a majority of the brain PPARα is localized to neurons (15), we determined the relationship between PPARs and ADAM10 in neurons. Agonists specific for PPARα (WY14643), but not PPARβ/δ (GW501516) or PPARγ (GW1929), significantly elevated membrane-bound pA10 [F(6,14) = 56.240; P < 0.001], mA10 [F(6,14) = 21.088; P < 0.001], and A10CTF [F(6,14) = 17.949; P < 0.001] expression in hippocampal neurons (Fig. 2 A and B). Gemfibrozil (Gem), a known PPARα agonist, activated PPAR-driven luciferase activity in a dose-dependent manner in hippocampal neurons, with maximal transcriptional activation achieved at 25 µM (Fig. S1B). In line with this finding, Gem significantly induced surface immunoreactivity of ADAM10 [Fig. 2 C and D; F(1,76) = 4.231; P = 0.043], but not APP [Fig. 2 D and E; F(1,76) = 0.079; P = 0.779], in fully differentiated (as determined by MAP-2 immunolabeling in adjacent cultures), unpermeabilized WT, but not Ppara−/−, hippocampal neurons. There was also a main effect of Ppara genotype on ADAM10 [Fig. 2D; F(1,76) = 21.242; P < 0.001], but not APP [Fig. 2E; F(1,76) = 2.444; P = 0.070], surface expression. Interestingly, ADAM10 and APP puncta were 1.78 times more likely to colocalize in WT neurons treated with Gem (r2 = 0.742) relative to DMSO (r2 = 0.416) (Fig. S1C). To support these findings, WT and Ppara−/− hippocampal neurons were treated with Gem or 9-cis-retinoic acid (9cRA), an agonist of the PPARα allosteric heterodimer partner retinoid x receptor (RXR) (16). The main effects of Gem and 9cRA treatments and Ppara−/− genotype on expression of membrane-bound pA10 (Fig. 2G) [treatment, F(2,12) = 13.940 (P = 0.001); genotype, F(1,12) = 116.353 (P < 0.001)], mA10 (Fig. 2H) [treatment, F(2,12) = 19.312 (P < 0.001); genotype, F(1,12) = 217.105 (P < 0.001)], and A10CTF (Fig. 2I) [treatment, F(2,12) = 3.974 (P = 0.047); genotype, F(1,12) = 26.746 (P < 0.001)], but not pA17 and mA17 or cellular APP (Fig. 2J) expression in 18DIV WT, and not Ppara−/−, hippocampal neurons, highlight the importance of PPARα in Gem- and 9cRA-induced ADAM10 expression.
Fig. 2.

PPARα agonists induce the expression of ADAM10 in primary hippocampal neurons. (A and B) Representative immunoblots (A) and quantification (B) of pA10, mA10, and A10CTF membrane expression in 18DIV neurons after 24 h treatment with DMSO or agonists of PPARα (WY14643), PPARβ/δ (GW501516), or PPARγ (GW1929). (C–E) Representative immunocytochemical images (C) and quantification of ADAM10 (D) and APP (E) surface expression in live-stained, unpermeabilized WT and Ppara−/− neurons treated with DMSO or 25 µM Gem for 24 h. (F–J) Representative immunoblots (F) and quantification of pA10 (G), mA10 (H), A10CTF (I), and APP (J) membrane expression in WT and Ppara−/− neurons treated with DMSO, 25 µM Gem, or 0.2 µM 9-cis-retinoic acid (9cRA) for 24 h. (K) Representative immunoblots of membrane-bound ADAM10 expression in hippocampi from 2-mo-old Ppara WT (+/+), heterozygous (+/−), and null (−/−) mice. (L and M) Representative immunoblots (L) and quantification (M) of pA10 and mA10 membrane expression in WT neurons transduced with GFP alone and in Ppara−/− neurons transduced with GFP alone or with flPPARα. (N) Quantification of surface ADAM10 expression in live-stained, unpermeabilized, 18DIV WT neurons transduced with GFP alone and in Ppara−/− neurons transduced with GFP alone or with flPPARα. The corresponding immunocytochemical images are presented in Fig. S2D. All values are corrected for β- or α-tubulin, indicate the mean ± SEM relative to control, and represent n = 3 or 4 for each treatment with the exception of E, F, and N, in which n ≥ 20. *P < 0.05 and **P < 0.01, using two-way (B, D, E, M) or one-way (N) ANOVA. (Scale bar, 5 µm.) n.s., not statistically significant; OD, relative optical density.
We next asked whether recovery of PPARα in Ppara−/− tissues restored ADAM10 expression. Ppara−/− mice were backcrossed with WT C57BL/6J mice to create cogenic Ppara WT (Ppara+/+), heterozygous (Ppara+/−), and null (Ppara−/−) animals. Ppara+/− mice expressed roughly half and twice as much membrane-bound ADAM10 in the hippocampus relative to Ppara+/+ and Ppara−/− mice, respectively (Fig. 2K), suggesting a gene–dose effect of PPARα on ADAM10 expression. To support these findings, transduction of 18DIV Ppara−/− hippocampal neurons with lentiviruses coexpressing GFP and WT, full-length PPARα (flPPARα) significantly restored membrane-bound pA10 [F(2,6) = 5.448; P = 0.045] and mA10 [F(2,12) = 33.550; P = 0.001] to levels comparable with WT neurons expressing GFP-fused empty vector alone (Fig. 2 L and M). In addition, introduction of flPPARα to 18DIV Ppara−/− hippocampal neurons resulted in significant recovery of surface ADAM10 immunoreactivity relative to Ppara−/− neurons transfected with GFP alone [Fig. 2N and Fig. S2D; F(2,57) = 7.549; P = 0.003]. These results suggest that overexpression of PPARα is necessary and sufficient to recover ADAM10 levels in Ppara−/− hippocampal neurons.
Fig. S2.

(A) Representative immunoblots of precursor (pA10), mature (mA10), and CTF (A10CTF) ADAM10 expression in membranes (30 and 15 µg) prepared from mixed cultures and serially isolated neurons (18DIV), astrocytes (14DIV), and microglia (16DIV). NeuN, glial fibrillary acidic protein (GFAP), and ionized calcium-binding adapter molecule 1 (Iba1) served as markers for neurons, astrocytes, and microglia, respectively. (B) Relative PPRE firefly luciferase luminescence units in 18DIV neurons treated with increasing concentrations of Gem for 2 h after 48 h transfection with 100 or 200 ng PPRE-x3-TK-luc DNA. (C) Colocalization probability (Pearson’s r2) of ADAM10 (y axis) and APP (x axis) surface immunoreactivity in 18DIV WT and Pparα−/− neurons treated for 24 h with DMSO or 25 µM Gem. Red boxes represent puncta within empirically determined thresholds between 100 and 200 arbitrary fluorescence units. (D) Representative immunocytochemical images of surface ADAM10 and GFP expression in live-stained, unpermeabilized 18DIV WT neurons transduced with GFP alone and in Ppara−/− neurons transduced with GFP alone or with flPPARα. Corresponding quantification is presented in Fig. 2N. (Scale bar, 5 µm.) All values represent the mean ± SEM relative to control and represent n = 3 or 4 for each treatment, except for C, where n ≥ 20. µg, micrograms protein.
Gem Induces the Recruitment of PPARα to the Adam10 Promoter.
Five experimentally verified Adam10 promoter variants were analyzed for PPRE with higher-than-chance consensus index vectors, using MatInspector (17). A number of PPREs are located upstream of the transcription start site (Fig. 3A), and the PPRE nucleotide distributions varied depending on whether the sequences are responsive to PPAR/RXR heterodimers (Fig. 3 B and C) or PPARγ (Fig. 3 D and E). We then extracted the full promoter sequences with ElDorado and designed flanking primers (Table S1) upstream and downstream of all seven PPRE. Gem significantly induced the promoter enrichment of PPARα [203.1, t(6) = 6.981 (P = 0.005); 203.2, t(6) = 9.014 (P = 0.002)] and its heterodimer RXRα [203.1, t(6) = 10.281 (P = 0.001); 203.2, t(6) = 12.336 (P < 0.001)], cAMP response element-binding protein (CBP) [203.1, t(6) = 3.787 (P = 0.024); 203.2, t(6) = 4.033 (P = 0.019)], and p300 [203.1, t(6) = 6.213 (P = 0.009); 203.2, t(6) = 3.989 (P = 0.023)], and the RNA Pol II [203.1, t(6) = 11.453 (P < 0.001); 203.2, t(6) = 8.890 (P = 0.002)], at two direct repeat 1 PPRE located in one Adam10 promoter variant in 18DIV WT, but not Ppara−/−, hippocampal neurons relative to DMSO (Fig. 3 F,1 and F,2). PGC1α was not involved, and promoter occupancy of transcriptional corepressor NcoR1 was significantly abrogated [203.1, t(6) = 3.648 (P = 0.031); 203.2, t(6) = 6.703 (P = 0.006)] in the presence of Gem relative to DMSO (Fig. 3 F,1 and F,2). As expected, Gem did not induce the recruitment of any of these factors to a likely PPARγ response element (Fig. 3F,3), indicating specificity of binding. Amplification of the other direct repeat 1 PPRE did not occur, possibly because of the absence of these promoter variants in neurons.
Fig. 3.

Gem augments the recruitment of PPARα to the Adam10 promoter. (A) Cartoon depicting alignment of PPRE located upstream of the transcription start site in ADAM10 promoter sequences (GXPs). (B–E) Global PPAR/RXR (B and C) and PPARγ (D and E) response element nucleotide probability distributions and consensus frequencies represented by sequence logos (D) and index vectors (consensus index vector; E), respectively. (F) Quantitative PCR results for PPREs 203.1 (1), 203.2 (2), and 207.1 (3) after chromatin immunoprecipitation with antibodies against PPARα, RXRα, CBP, p300, PGC1α, NcoR1, and RNA Pol II (x-axis, left to right) from 18DIV WT and Ppara−/− neurons treated with DMSO or 25 µM Gem for 2 h. (G) Cartoon depicting DNA binding of the PPARα transcriptional complex to the Adam10 promoter in the absence or presence of Gem. All values are corrected for input DNA and are relative to IgG, indicate the mean ± SEM relative to control, and represent n = 4 for each treatment. *P < 0.05 and **P < 0.01 using Student’s t test. bp, base pairs; ChIP, chromatin immunoprecipitation; IP, immunoprecipitating antibody.
Table S1.
DNA and mRNA primers used in this article
| Forward primer (5′ to 3′) | Reverse primer (5′ to 3′) | |
| Promoter ID | ||
| GXP_220203 | ||
| PPRE 1 | GAGGCCCCGAGAGAGTTATC | GCAGATGATGACTTAACAGG |
| PPRE 2 | CAGCTTTTGCCTTGGTTCTT | ATTGGGTTCCTTTTCCATCC |
| GXP_220204 | ||
| PPRE 1 | TGCCTTGGAATTATGTTGGA | GGGAAAACAACGTCGAAAAA |
| GXP_220205 | ||
| PPRE 1 | CTGAATGCCCCTCACTCTTT | TCACCTTTTAAATCCCTTCACC |
| PPRE 2 | GGTGAAGGGATTTAAAAGGTGA | TTCCTGCCATTAACATAGCAAA |
| PPRE 1+2 | ACGCAGTGTCTTGCTGACAA | AAAGAGTGAGGGGCATTCAG |
| PPRE 3 | TTTTTCAGGGACCATTAATGTTTTA | CCCCCAGAGCTTCCTAATTC |
| GXP_220207 | ||
| PPRE 1 | CAGAGCCTGGGAAAGACAAG | TGTTACGGATTCCGGAGAAG |
| Gene | ||
| Adam9 | CAGGGGGCCCAGGTGT | ATAAAGGAGGTGCAGGAGCG |
| Adam10 | GGGCCCCTGAAGTGGAGC | CCGCGGTGCATCGATCCT |
| Adam17 | TCCGGGGACGTGAGCCTAGC | GGGGTGGCCAGGACGAAAGGC |
| Bace1 | GACCACTCGCTATACACGGG | GAGGCTGCCTTGATGGACTT |
| Cbp | CTGTCCTGTTTGCCTCCCTT | CGTCTGAGGCTGGTTCATGT |
| Gapdh | GCACAGTCAAGGCCGAGAAT | GCCTTCTCCATGGTGGTGAA |
| Ncor1 | AGCAGGTCAGCAGCAGTTAG | GTAGTCTTCCCTCGGGTCCT |
| Ncor2 | GGTTCCATCATCCAGCCACA | GTGTCAGACGGCTGGTTGTA |
| p300 | AGCATTGAAGGCCAGGTCTC | AATGATACCTGTTCTGGTAACTGTA |
| Pgc1α | GCAGCCAAGACTCTGTATGG | TTCCGATTGGTCGCTACACC |
| Psen1 | TGCATGGTCGTCGTCGTG | TCCTGTGTCTCGTCTCTCCTGGC |
| Rxrα | CTGTCGAGCCCAAGACTGAG | TGAGTAAAGATGGCGAGAGTGG |
| Src1 | CCAGAGGACCCAGGTACTGA | GGCGCTAAGCATTGTCCCAT |
PPARα Modulates APP Processing.
We devised an in vitro assay to reliably detect murine APP fragments and circumvent the need for transgenic overexpression of nonendogenous APP (18) or its rate-limiting secretases. Murine soluble APPα (sAPPα; ∼110 kDa) and monomeric Aβ (∼4 kDa) were immunoprecipitated from conditioned media harvested from WT 18DIV hippocampal neurons with antibody M3.2 (Fig. 4A, first panel), the murine analog to human-specific 6E10 (Fig. 4A, third panel). Oligomeric Aβ was not enriched with antibody A11 (Fig. 4A, second panel), likely because murine Aβ lacks the propensity to rapidly self-associate, especially under cell culture conditions. M3.2 precipitation of sAPPα and Aβ from neuronal media was confirmed by precipitation of human APP fragments from the hippocampus of 6-mo-old 5XFAD mice, using antibody 6E10 before or after samples were immunodepleted with an antibody specific for the N terminus of all APP species (antibody 22C11) (Fig. 4A, third panel). Precipitated proteins were detected (immunoblot) with antibodies against M3.2 (first panel), D54D2 (second panel), or 6E10 (third panel). Please see Table S2 for antibodies and concentrations.
Fig. 4.

Activation of PPARα attenuates endogenous Aβ generation. (A) Representative immunoblots of APP species IP from 18DIV neuronal culture media using antibodies M3.2 and A11 or from the hippocampal TBS fraction (TBS Frac) of 6-mo-old 5XFAD mice with antibody 6E10. (B–G) Representative immunoblots (B) and quantification of murine sAPPβ (C), sAPPα (D), and Aβ (E) immunoprecipitated from conditioned media, and β-secretase cleaved APP C-terminal fragments (CTFβ) (F) and α-secretase cleaved APP C-terminal fragments (CTFα) (G) immunoprecipitated from lysates harvested from WT and Ppara−/− neurons treated with DMSO, 25 µM GEM, or 0.2 µM all-trans retinoic acid (9cRA) for 24 h. All values are corrected for IgG, indicate the mean ± SEM relative to control, and represent n = 3 or 4 for each treatment. *P < 0.05 and **P < 0.01, using two-way ANOVA. IB, immunoblot; Beads, protein G beads alone; IgGHC/LC, IgG heavy chain and light chain; Media, unconditioned media; OD, relative optical density. ●, nonspecific band.
Table S2.
Antibodies, sources, applications, and dilutions used in this article
| Target and antibody (clone) | Epitope/immunogen | Application/dilution | Source; catalog |
| α-Tubulin | |||
| Mouse monoclonal (TU-02) | a.a. 1–451 of procine α-Tubulin | WB/1:1,200 | Santa Cruz; sc-8035 |
| ADAM10 | |||
| Rabbit polyclonal | CT a.a. 732–745 of human ADAM10 | WB/1:1,000 | Millipore; AB19026 |
| Mouse monoclonal | NT a.a. 1–300 of human ADAM10 | ICC/1:500 | Santa Cruz, sc-28358 |
| ADAM17 | |||
| Rabbit polyclonal | CT a.a. 807–823 of human ADAM10 | WB/1:1,100 | Abcam; ab2051 |
| APP | |||
| Mouse monoclonal (22C11) | NT a.a. 66–81 of pre-A4 | ICC/1:700 | Millipore; MAB348 |
| WB/1:1,000 | |||
| IP/1:150 | |||
| Goat polyclonal | NT a.a. 44–63 of APP | ICC/1:500 | Millipore; AB1593 |
| Rabbit polyclonal (Poly8134) | β-secretase-cleaved neoepitope | WB/1:500 | BioLegend; 813401 |
| Mouse monoclonal (C1/6.1) | CT a.a. 676–695 of APP | WB/1:1,000 | BioLegend; 802802 |
| β-Actin | |||
| Mouse monoclonal (AC-15) | a.a. 1–15 of Xenopus laevis β-actin | WB/1:5,000 | Abcam; ab6276 |
| β-Amyloid | |||
| Mouse monoclonal (M3.2) | a.a. 10–15 of murine Aβ | WB/1:800 | BioLegend; 805701 |
| IP/1:300 | |||
| Rabbit polyclonal (A11) | Oligomer specific | WB/1:600 | Millipore; AB9234 |
| Mouse monoclonal (6E10) | a.a. 1–16 of human Aβ | IHC/1:300 | BioLegend; 803015 |
| IP/1:400 | |||
| WB/1:1,200 | |||
| Rabbit monoclonal (D54D2) | NT of human Aβ | WB/1:1,000 | Cell Signaling; 8243 |
| β-Tubulin | |||
| Rabbit polyclonal (H-235) | a.a. 210–444 of human β-Tubulin | WB/1:1,200 | Santa Cruz; sc-9104 |
| BACE1 | |||
| Rabbit monoclonal (EPR3965) | Synth peptide to human BACE1 | WB/1:1,000 | Epitomics; 2882–1 |
| CBP | |||
| Rabbit polyclonal (A-22) | NT of human CBP | ChIP/1:150 | Santa Cruz; sc-369x |
| GAPDH | |||
| Mouse monoclonal (6C5) | Synth peptide against rabbit GAPDH | WB/1:2,000 | Santa Cruz; sc-32233 |
| GFAP | |||
| Rabbit polyclonal | Synth peptide to cow GFAP | WB/1:1,500 | Dako; z0334 |
| GFP | |||
| Goat polyclonal | FL Aequorea victoria sequence | WB/1:1,000 | Rockland; 600–101-215 |
| ICC/1:500 | |||
| Histone H3 | |||
| Goat polyclonal (C-16) | CT of human H3 | WB/1:400 | Santa Cruz; sc-8654 |
| Iba1 | |||
| Goat polyclonal | CT a.a. 135–147 of human Iba-1 | WB/1:900 | Abcam; ab5076 |
| MAP-2 | |||
| Rabbit polyclonal | Purified rat MAP-2 | ICC/1:700 | Millipore; AB5622 |
| NcoR1 | |||
| Rabbit polyclonal | a.a. 2427–2443 of mouse NcoR1 | ChIP/1:300 | Abcam; ab3482 |
| NeuN | |||
| Mouse monoclonal (A60) | Purified mouse brain nuclei | WB/1:1,000 | Millipore; MAB377 |
| p300 | |||
| Mouse monoclonal (NM11) | a.a. 2071–2091 | ChIP/1:150 | Abcam; ab3164 |
| PGC1α | |||
| Rabbit polyclonal (H-300) | NT a.a. 1–300 of human PGC1α | ChIP/1:150 | Santa Cruz; sc-13067 |
| PPARα | |||
| Rabbit polyclonal | NT of mouse PPARα | WB/1:600 | Rockland; 600–401-421 |
| Mouse monoclonal (3B6) | Recombinant FL protein | ChIP/1:200 | Abcam; ab2779 |
| PPARβ | |||
| Rabbit polyclonal (H-74) | a.a. 2–75 of human PPARβ | WB/1:300 | Santa Cruz; sc-7197 |
| PPARγ | |||
| Mouse monoclonal (E-8) | a.a. 480–505 of human PPARγ | WB/1:300 | Santa Cruz; sc-7273 |
| Presenilin-1 | |||
| Rabbit polyclonal | CT a.a. 275–367 of human PSEN1 | WB/1:1,000 | Millipore; AB5308 |
| Rabbit polyclonal | NT of Human PSEN1 (Bleed #13) | WB/1:4,000 | Gift of Robert Vassar |
| RNA Pol II | |||
| Mouse monoclonal (CTD4H8) | CT (YSPT[pS]PS) of hu. RNA Pol II | ChIP/1:200 | Millipore; 05–623 |
| RXRα | |||
| Rabbit polyclonal (d-20) | Synth peptide to NT of hu. RXRα | ChIP/1:200 | Santa Cruz; sc-553x |
ICC, immunocytochemistry; IHC, immunohistochemistry; WB, Western blot.
Using this assay, we found that Gem or 9cRA significantly elevated sAPPα (Fig. 4 B and D) [F(2,12) = 8.400; P = 0.005] and reduced Aβ (Fig. 4 B and E) [F(2,12) = 4.594; P = 0.033] and sAPPβ (Fig. 4 B and C) [F(2,12) = 3.940; P = 0.048] release into culture media in WT, but not Ppara−/−, neurons. Accordingly, Gem and 9cRA treatments reduced the production of cell-bound β-secretase-cleaved APP C-terminal fragments (CTFβ; Fig. 4 B and F) [F(2,12) = 4.265; P = 0.040] and increased the production of CTFα (Fig. 4 B and G) [F(2,12) = 14.735; P = 0.001] in WT, but not Ppara−/−, neurons. Importantly, there was also a strong main effect of Ppara−/− genotype on baseline sAPPα [F(1,12) = 81.114; P < 0.001], sAPPβ [F(1,12) = 124.822; P < 0.001], Aβ [F(1,12) = 212.166; P < 0.001], CTFβ [F(1,12) = 125.371; P < 0.001], and CTFα [F(1,12) = 128.399; P < 0.001], but not APP, expression (Fig. 4 C–G).
To validate these in vitro findings, 6- and 18-mo-old WT and Ppara−/− mice were subjected to subcellular prefractionation (lysate) or solubilized in Tris-buffered saline (TBS) for immunoblotting (Fig. 5A). Again, we found that membrane expression of pA10 (Fig. 5 A and B), mA10 (Fig. 5 A and C), and A10CTF (Fig. 5 A and D) was significantly impaired in the hippocampus of 6-mo-old [pA10, t(6) = 9.084 (P < 0.001); mA10, t(6) = 13.834 (P < 0.001); A10CTF, t(6) = 3.808 (P = 0.009)] and 18-mo-old [pA10, t(6) = 3.726 (P = 0.010); mA10, t(6) = 6.892 (P < 0.001); A10CTF, t(6) = 2.771 (P = 0.032)] Ppara−/− mice relative to age-matched WT mice. Interestingly, significantly elevated and reduced expression of sAPPα (Fig. 5 A and K) and Aβ (Fig. 5 A and L), respectively, was observed in the TBS fraction in 6-mo-old [sAPPα, t(6) = 9.307 (P < 0.001); Aβ, t(6) = −2.572 (P = 0.042)] and 18-mo-old [sAPPα, t(6) = 10.707 (P < 0.001); Aβ, t(6) = −2.832 (P = 0.030)] Ppara−/− mice relative to age-matched WT mice. We also observed significantly reduced CTFα (Fig. 5 A and G) and elevated CTFβ (Fig. 5 A and F) and sAPPβ (Fig. 5 A and H) levels in hippocampal lysates from 6-mo-old [CTFα, t(6) = 3.449 (P = 0.014); CTFβ, t(6) = −7.840 (P < 0.001); sAPPβ, t(6) = −4.213 (P = 0.006)] and 18-mo-old [CTFα, t(6) = 4.716 (P = 0.003); CTFβ, t(6) = −20.374 (P < 0.001); sAPPβ, t(6) = −4.282 (P = 0.005)] Ppara−/− mice relative to age-matched WT mice. Immunoblotting for CTFα with antibody C1/6.1 was performed in lysates immunodepleted with M3.2. Conversely, and in agreement with previous data, expression of APP (Fig. 5 A and E), C-terminal presenilin-1 (PS1CT) (Fig. 5 A and I), and BACE1 (Fig. 5 A and J) did not differ between genotypes at either age.
Fig. 5.

APP processing is shifted away from the α-secretase pathway in Ppara−/− mice. (A–L) Representative immunoblots (A) and quantification of precursor ADAM10 (pA10) (B), mature ADAM10 (mA10) (C), COOH terminus-cleaved ADAM10 (A10CTF) (D), APP (E), β-secretase-cleaved APP C-terminal fragment (CTFβ) (F), α-secretase-cleaved APP CTFα (G), β-secretase-cleaved soluble APP (sAPPβ) (H), C-terminal-cleaved PS1 (PS1CT) (I), BACE1 (J), and immunoprecipitated, α-secretase-cleaved soluble APP (sAPPα) (K) and Aβ (L) expression in hippocampi from 6- and 18-mo-old WT and Ppara−/− mice. (M) ELISA quantification of murine Aβ1–42 expression in serially extracted TBS (Left) and TBS+1% Triton X-100 (TBS-Tx; Right) fractions from 6- and 18-mo-old WT and Pparα−/− hippocampi. All values are corrected for α-tubulin or IgG, indicate the mean ± SEM relative to WT, and represent n = 4 for each genotype and age, except for (M), where n = 5. *P < 0.05 and **P < 0.01, using Student’s t test. IgGHC/LC, IgG heavy chain and light chain; OD, optical density. ●, nonspecific band.
Next, as antibody M3.2 nonselectively recognizes both 40(1–40) and 42(1–42) Aβ peptides, we used highly sensitive, murine-specific sandwich ELISAs to quantify Aβ1–42 species in serially isolated aqueous (TBS) and detergent-soluble (TBS-Tx) hippocampal fractions (Fig. 5K). Relative to their age-matched WT controls, Ppara−/− mice expressed significantly higher levels of aqueous (Left) and detergent-soluble (Right) Aβ1–42 at 6 mo of age [TBS, t(6) = 2.854 (P = 0.029); TBS-Tx, t(6) = 6.815 (P < 0.001)] and 18 mo of age [TBS, t(6) = 5.337 (P = 0.002); TBS-Tx, t(6) = 6.742 (P = 0.001)] (Fig. 5M). Taken together, these findings describe that PPARα plays a vital role in the regulation of Aβ generation.
Ablation of PPARα Propagates Cerebral Aβ Load and Augments Lethality in 5XFAD Mice.
To examine the effect of deleting endogenous PPARα on the production of transgenically derived Aβ, we crossed Ppara−/− mice with 5XFAD mice overexpressing familial AD-linked human APP and presenelin 1 (PSEN1) mutations (19) to create bigenic 5XFAD mice null for Pparα (5X/α−/−). As expected, the Ppara disruption did not alter insertion or expression of the 5XFAD transgenes, and vice versa (Fig. S3A). Six-month-old WT, Ppara−/−, 5XFAD, and 5X/α−/− mice did not differ significantly with respect to wet brain or gross body weight (Fig. S3 B and C), and we did not observe any overt phenotypic differences, including diet, fecal boli, social interaction, and agitation across genotypes at this age.
Fig. S3.

(A) Representative PCR of Ppar, App695, and Psen1 transgene DNA expression in the hippocampus of 4-mo-old WT, Pparα−/−, 5XFAD (5X), and 5X/α−/− mice. (B and C) Average wet brain weight (B) and gross body weight (C) for WT, Pparα−/−, 5X, and 5X/α−/− mice. For wet brain weight, the olfactory lobes and brainstem were removed. ●, internal positive control.
We monitored brain Aβ load in two cohorts of 5XFAD and 5X/α−/− mice by colabeling coronal sections for the β-pleated-sheet marker thioflavin-S (Thio-S) and the N-terminal Aβ antibody 6E10 (Fig. 6A). As expected, robust Thio-S and Aβ fluorescence was observed throughout the cortex and hippocampus in 5- to 6-mo-old 5XFAD (Fig. 6A,1) and 5X/α−/− (Fig. 6A,2) mice and in 10- to 12-mo-old 5XFAD (Fig. 6A,3) and 5X/α−/− (Fig. 6A,4) mice, but not 5- to 6- or 10- to 12-mo-old Ppara−/− mice (Fig. S4B). Quantification of Thio-S staining area revealed significantly more amyloid deposition in the cortex and hippocampus of 5X/α−/− mice relative to age-matched 5XFAD mice at 5–6 mo of age [cortex, t(25) = −4.012 (P = 0.001); hippocampus, t(25) = −4.769 (P < 0.001)] and 10–12 mo of age [cortex, t(35) = −7.603 (P < 0.001); hippocampus, t(35) = −5.768 (P < 0.001)] (Fig. 6B). Further characterization of Thio-S staining revealed a significantly greater number of plaques in the hippocampus of 5X/α−/− mice relative to age-matched 5XFAD mice at 5–6 mo of age [t(25) = −3.524; P = 0.001] and in the hippocampus and cortex at 10–12 mo of age [cortex, t(35) = −2.591 (P = 0.014); hippocampus, t(35) = −4.534 (P < 0.001)], and larger plaque size in the hippocampus and cortex of 5X/α−/− mice relative to age-matched 5XFAD mice at 5–6 mo of age [cortex, t(25) = −3.207 (P = 0.004); hippocampus, t(25) = −6.006 (P < 0.001)] and in the cortex at 10–12 mo of age [t(35) = −3.136 (P = 0.003)] (Fig. S4 C and D).
Fig. 6.

Disruption of PPARα exacerbates cerebral Aβ load and decreases lifespan in 5XFAD mice. (A) Representative images of coronal sections from 5- to 6-mo-old 5XFAD (A1), 5- to 6-mo-old 5X/Pparα−/− (A2), 10- to 12-mo-old 5XFAD (A3), and 10- to 12-mo-old 5X/Pparα−/− (A4) mice colabeled with thioflavin-S (Thio-S, green) and 6E10 (red). (B) Quantification of Thio-S-positive area as a percentage of total area in the cortex (CTX) and hippocampus (HPC) of 5XFAD and 5X/Ppara−/− mice. All values represent the mean ± SEM and represent n = 14, 13, 19, and 18 for 5- to 6-mo-old 5XFAD, 5- to 6-mo-old 5X/Ppara−/−, 10- to 12-mo-old 5XFAD, and 10- to 12-mo-old 5X/Ppara−/− mice, respectively. (C and D) Representative immunoblots (C) and quantification of 6E10-detected Aβ (D) expression in TBS fractions from 2- and 6-mo-old WT, 5XFAD (5X), and 5X/Pparα−/− (5X/α−/−) hippocampi. Values are corrected for α-tubulin and indicate the mean ± SEM relative to WT. (E) ELISA quantification of human Aβ1–42 in serially extracted TBS (Top) and TBS+1% Triton X-100 (TBS-Tx; Bottom) fractions from 5XFAD and 5X/α−/− hippocampi. (F) Kaplan–Meier survival analysis of WT (n = 15), Pparα−/− (n = 13), 5XFAD (n = 19), and 5X/α−/− (n = 16) animals across 24 mo. Plus (+) symbols represent censored cases. All values represent the mean ± SEM and represent n = 4 (C and D) or 5 (E) for each genotype and age. *P < 0.05, **P < 0.01, and ***P < 0.001, using Student’s t test, and #P < 0.01, using Breslow Generalized Wilcoxon χ2. (Scale bar, 500 µm.) IB, immunoblot; OD, optical density. ●, nonspecific band.
Fig. S4.

(A) Representative images of adjacent 5- to 6-mo-old 5XFAD hippocampal (Left) and cortical (Right) sections incubated in the absence and presence of primary and secondary antibodies, respectively. For visual reference, the inset sections were incubated with both primary and secondary antibodies. (B) Representative Thio-S (green) and 6E10 (red) images of coronal sections from 5- to 6-mo-old and 10- to 12mo-old Pparα−/− mice. (C and D) Quantification of total Thio-S puncta number (C) and average Thio-S puncta size (pixels) (D) in the cortex (CTX) and hippocampus (HPC) of 5- to 6-mo-old and 10- to 12-mo-old 5XFAD and 5X/Pparα−/− mice. All values represent the mean ± SEM and represent n = 14, 13, 19, and 18 for 5- 6-mo-old 5XFAD, 5- to 6-mo-old 5X/Pparα−/−, 10- to 12-mo-old 5XFAD and 10- to 12-mo-old 5X/Pparα−/− mice, respectively. *P < 0.05, **P < 0.01, and ***P < 0.001, using Student’s t test. [Scale bar, 500 µm in A (Left) and B; 50 µm in A (Right).] Merge, merged image.
Next, we prepared serially isolated aqueous (TBS) and detergent-soluble (TBS-Tx) fractions from hippocampi from 2- and 6-mo-old 5XFAD (5X), 5X/α−/−, and WT mice (Fig. 6 A–C). Relative to 5XFAD littermates, 5X/α−/− mice expressed significantly more aqueous, low-n, SDS-stable Aβ at 2 mo of age [t(6) = 4.826; P = 0.003] and 6 mo of age [t(6) = 4.394; P = 0.020] (Fig. 6 A and B). In agreement with this, 5X/α−/− mice expressed significantly higher levels of aqueous (Left) and detergent-soluble (Right) Aβ1–42 at 2 mo of age [TBS, t(8) = 4.211 (P = 0.003); TBS-Tx, t(8) = 4.975 (P < 0.001)] and 6 mo of age [TBS, t(8) = 4.446 (P = 0.002); TBS-Tx, t(8) = 8.491 (P < 0.001)] relative to age-matched 5X mice. Furthermore, Kaplan–Meier estimates (Fig. 6F) revealed significantly different survival distributions for both 5X (16.2 ± 1.22 mo) and 5X/α−/− (13.9 ± 1.283 mo) mice relative to WT (22.0 ± 0.685 mo) and Pparα−/− (21.846 ± 0.862 mo) mice [χ2(3) = 27.688; P < 0.001] and revealed that 5X/α−/− mice displayed significantly shorter lifespans relative to their 5X littermates[(χ2(2) = 13.955; P = 0.001].
Discussion
One of the pathologic hallmarks of AD is the presence of extracellular amyloid plaques containing Aβ peptides, which originate from the amyloidogenic proteolytic processing of APP, through the sequential action of β- and γ-secretases. In contrast, APP can also be cleaved by a nonamyloidogenic pathway by α-secretase, precluding the formation of Aβ peptides. Accordingly, mutations in the α-secretase ADAM10 prodomain are associated with exacerbated Aβ generation and AD susceptibility (20). Therefore, understanding the mechanistic regulation of ADAM10 is an important area of research. This study reveals a pathway for the up-regulation of ADAM10 involving the lipid-lowering transcription factor PPARα. Our conclusion is based on the following: First, we demonstrated that brains and neurons null for PPARα, but not PPARβ/δ or PPARγ, were deficient for membrane-bound, catalytic ADAM10. In contrast, we failed to observe any deficits in ADAM17, an enzyme with potential APP α-secretase functional redundancy, the β-secretase BACE1, and the γ-secretase catalytic protease (PSEN1) in Pparα−/− brains. Second, lentiviral delivery of WT, full-length PPARα to Ppara−/− neurons was necessary and sufficient to restore ADAM10 expression. Third, WY14643, a specific agonist of PPARα, but neither the PPARβ/δ-specific agonist GW501516 nor the PPARγ-specific agonist GW1929, increased expression of ADAM10 in hippocampal neurons. Similarly, Gem, a lipid-lowering drug approved by the US Food and Drug Administration and an agonist of PPARα, also elevated the expression of ADAM10 in hippocampal neurons isolated from WT, but not Ppara−/−, mice. Fourth, Gem treatment led to the recruitment of PPARα and RXRα to two direct repeat 1 PPREs in the Adam10 promoter. This inducible transcriptional mechanism also involved the histone acetyltransferases CBP and p300. Although PGC1α has been identified as an important transcriptional coactivator being involved in diverse cellular functions including metabolism of lipids and carbohydrates, mitochondrial biogenesis and function, and cholesterol homeostasis (21), we did not observe recruitment of PGC1α to the Adam10 promoter upon Gem treatment, indicating the specificity of this process. Fifth, earlier studies have shown a role of RXR (22) and retinoic acid receptor (23) in the induction of ADAM10 in neuronal cell lines. We found that RXR agonists were unable to up-regulate ADAM10 in Ppara−/− neurons, indicating an obligatory role of PPARα in this process.
Can PPARα modulate APP processing and, therefore, generation of Aβ? This is an important question depending on the fact that ADAM10 favors the nonamyloidogenic pathway. We found evidence that APP processing was shifted toward the β-secretase-mediated pathway in the hippocampus of Ppara−/− mice. Crossing 5XFAD mice with Ppara−/− mice led to robust elevations in plaque area, number, and size in the hippocampus and cortex of both young and aged mice. Biochemically, we observed drastically exacerbated Aβ1–42 accumulation and aggregation in the hippocampus and cortex relative to traditional 5XFAD littermates. In addition, 5XFAD mice null for PPARα displayed significantly shorter life spans (by ∼2 mo) compared with their traditional 5XFAD littermates. Although there is no definitive correlation between Aβ and lifespan per se, there is evidence that increased Aβ burden induces early mortality in mice (24) and lower organisms (25). There is also evidence that elevated Aβ levels are associated with reduced lifespan in the human disease (26).
In summary, we describe that activation of PPARα induces α-secretase proteolysis of APP in hippocampal neurons via transcriptional induction of ADAM10. Therefore, the outcome of this investigation highlights undiscovered properties of PPARα, describes a mechanism for reducing Aβ generation, and fuels interest in understanding the link between APP processing and lipid metabolism pathways.
Methods and Materials
Animals.
Mice were maintained and experiments conducted in accordance with National Institute of Health guidelines and were approved by the Rush University Medical Center Institutional Animal Care and Use Committee. C57BL/6J, Ppara−/−, and 5XFAD (19) mice were obtained from Jackson. Ppara−/− and Pparβ/δ−/− mice (27) were maintained homozygous for the mutations unless otherwise indicated.
Immunocytochemistry and Quantification.
Primary hippocampal neurons were double-immunostained and quantified according to Glynn and McAllister (28), with modification (SI Materials and Methods).
Subcellular Prefractionation, Immunoblotting, Densitometry, and ELISA.
Subcellular prefractionation of cultured neurons and brain tissue was performed as described elsewhere (29), except the membrane pellet was solubilized in 1% CHAPS buffer (30 mM Tris⋅HCl at pH 7.5, 150 mM NaCl, 1% CHAPS) + protease and phosphatase inhibitors (Sigma) instead of PBS. For immunoblotting, densitometry and ELISA details, please see SI Materials and Methods.
Conditioned Media Preparation and Immunoprecipitation of APP Fragments.
Endogenous APP fragments were detected in conditioned neuronal media according to Shankar et al. (30), with modification (SI Materials and Methods).
An extended section is provided in SI Materials and Methods.
SI Materials and Methods
Reagents and Antibodies.
Antibodies and their applications, sources, and dilutions are listed in Table S2. Cell culture materials (Neurobasal, phenol red-free Neurobasal, B27, L-glutamine, antibiotic/antimycotic) were purchased from Life Technologies. All molecular biology-grade reagents and chemicals were obtained from Sigma or Bio-Rad. Alexa-fluor secondary antibodies used for immunocytochemistry were obtained from Jackson ImmunoResearch, and IR-Dye-labeled secondary antibodies used for immunoblotting were from Li-Cor Biosciences.
Cell Culture.
Hippocampi were dissected under a microscope from embryonic day (E)16–E18 pups of either sex (C57BL/6J and Pparα−/−), mechanically dissociated, washed with media by centrifugation three times at 1,460 × g for 10 min and seeded on poly-d-lysine coated glass coverslips and 10-mm tissue culture dishes for immunofluorescence and biochemistry, respectively. Half the culture media was replaced with fresh media every 3 d, and all pharmacologic treatments were conducted in serum-free Neurobasal.
Immunocytochemistry and Quantification.
Eighteen DIV cells were live labeled at room temperature in artificial cerebrospinal fluid with monoclonal and polyclonal antibodies against the N terminus of ADAM10 (B-3; amino acids 1–300) and APP (22C11; amino acids 44–63), respectively (Table S2). Cells were washed four times with artificial cerebrospinal fluid, fixed in 4% (wt/vol) paraformaldehyde/4% sucrose in PBS for 10 min, washed again, and incubated with anti-mouse Cy2-conjugated and anti-goat Cy5-conjugated secondary antibodies. To assess cell morphology and health, neurons on adjacent coverslips were fixed as described earlier, permeabilized in 0.25% Triton X-100 + PBS for 5 min, blocked in 10% (wt/vol) BSA, and stained [in 3% (wt/vol) BSA] with rabbit anti-MAP-2 and anti-rabbit Cy5-conjugated secondary antibodies. Coverslips were rinsed in H2O, mounted on slides in Fluoromount (Sigma), and imaged using an Olympus BX41 fluorescent microscope equipped with a Hamamatsu ORCA-03G camera.
For quantification of ADAM10 and APP puncta, neurons were selected at random and defined with respect to polarity. Dendritic segments were visualized with a 100× objective, and raw images were split by color channel and converted to binary in Fiji to reduce visual bias. Regions of interest, which were the same size for each dendrite and equidistant from the soma, were used to distinguish background fluorescence (determined by selecting a range of diffuse staining intensities) from focal signals. After subtracting average background fluorescence, postprocessed puncta included in the analysis had a grayscale intensity value between 100 and 200 arbitrary fluorescence units. Subthreshold (<100) and saturated (>200) puncta were not included in the analysis. Imaged dendrites were divided into 20-µm segments, and the puncta per segment was quantified. Colocalization probability of ADAM10 and APP puncta was quantified using the Coloc 2 plug-in.
DNA Constructs and Lentiviral Transductions.
Generation of the pCMV6-AC-GFP lentiviral backbone expressing TurboGFP (OriGene #PS100010) and full-length PPARα has been described before (11). For biochemical experiments, 10DIV neurons were transduced with lentiviral particles for 24 h at 37 °C with a multiplicity of infection of ∼7.5. After 24 h, transduction media was removed and fresh media was added to cells. Viral integration was monitored by live GFP imaging, and neurons were transduced at ∼85% efficiency at the time of biochemical experimentation (18DIV). Immunoblotting for GFP served as a second transduction control.
Real-Time Quantitative PCR.
Total RNA was isolated using the Biotecx ULTRASPEC reagent, according to manufacturer protocol, and quantitative PCR was performed using the ABI-Prism7700 sequence detection system (Applied Biosystems), as described (11). CDNA was created using oligo-dT, dNTP, 0.1M DTT, M-MLV RT, RNaseOUT, and 5X First Strand Buffer (all Life Technologies) and amplified with SYBR Green-conjugated PCR master mix (Applied Biosystems) and the primers listed in Table S1.
Immunoblotting, Densitometry, and ELISA.
For whole-cell and tissue lysates, samples were homogenized in 1% CHAPS buffer + protease and phosphatase inhibitors (Sigma), passed 10 times through a 26-gauge needle, rotated end over end for 30 min at 4 °C, and centrifuged for 10 min at 18,000 × g. The supernatant was aliquotted and stored at −80 °C until use. Protein concentrations were determined using a NanoDrop 2000 (Thermo Fisher), and 15–30 µg sample was heat-denatured and resolved on 8% or 10% polyacrylamide-SDS gels in Mes buffer (50 mM Mes, 50 mM Tris base, 0.1% SDS, 1 mM EDTA at pH 7.3). Proteins were transferred to 0.45 µm nitrocellulose membranes in Towbin Buffer [25 mM Tris, 192 mM glycine, 20% (wt/vol) methanol] under semidry conditions (15V for 12 min). Membranes were blocked for 1 h with blocking buffer (Li-Cor), incubated with primary antibodies (Table S2) overnight at 4 °C under shaking conditions, washed, incubated with IR-dye-labeled secondary antibodies (1:17,000; Li-Cor) for 45 min at room temperature, washed, and visualized with the Odyssey Infrared Imaging System (Li-Cor). Blots were converted to grayscale and then binary, analyzed using Fiji, and normalized to appropriate loading controls. For Aβ ELISAs, whole hippocampi were homogenized in 4 volumes of TBS buffer and pelleted for 30 min at 150,000 × g, and the supernatant was recovered and stored (TBS soluble fraction). The pellet was resuspended in 3 volumes (wt/vol original tissue weight) of TBS+1% Triton X-100 (TBS-Tx) and pelleted for 30 min at 150,000 × g, and the supernatant was recovered and stored (TBS-Tx soluble). Samples were assayed for protein concentration and diluted 10-fold before performing ELISA according to manufacturer’s instruction (BioLegend, SIG-38952).
Conditioned Media Preparation and Immunoprecipitation of APP Fragments.
At 16DIV, growth media was replaced with phenol red- and serum-free Neurobasal for pharmacological treatment of neurons. Then, 48 h later, media (6 mL) was collected, supplemented with protease and phosphatase inhibitors (Sigma), and centrifuged at 3,500 × g for 10 min at 4 °C to pellet cellular debris. Media was concentrated with Amicon 3K centrifugal filters (Millipore) in a fixed-angle rotor (7,500 × g, 35 min, 4 °C) and precleared for 1 h at 4 °C with protein A/G agarose (Santa Cruz). sAPPα and Aβ were immunoprecipitated using the murine-specific antibody M3.2. Coprecipitates were resolved on 10–20% (wt/vol) Tris-tricine gels in a discontinuous tricine buffer system and transferred to nitrocellulose membranes in Towbin Buffer under semidry conditions (12V for 20 min). Membranes were boiled in PBS for 5 min before blocking, and antibodies M3.2 or D54D2 were used to detect immunoprecipitated APP species. Soluble APPβ was precipitated from M3.2 immunodepleted media, using antibody 22C11, and detected with an antibody specific to a β-secretase-cleaved APP neoepitope (Poly8134). CTFβ were first immunoprecipitated from membrane fractions prepared as earlier and detected with M3.2. To circumvent downstream IgG interference, CTFα were immunoprecipitated from M3.2-immunodepleted membrane lysates using antibody C1/6.1 coupled to resin (Thermo-Pierce Direct IP kit).
Luciferase Assay.
Briefly, 100 and 200 ng PPAR luciferase reporter DNA (PPRE-x3-TK-luc; Addgene, plasmid #1015) (11) and GFP (OriGene) were cotransfected into 18DIV neurons, using Lipofectamine 3000 (Life Technologies). Transfection efficiency was monitored by GFP imaging. Two days after transfection, neurons were incubated with DMSO or Gem for 2 h, and luciferase bioluminescence was monitored using a commercially available kit (Promega), according to manufacturer’s instruction.
Promoter Mapping and Chromatin Immunoprecipitation.
The ADAM10 promoter was analyzed for predicted transcription factor binding sites, using MatInspector (17), with the matrix threshold set at 0.80. Targeted transcription factor binding sequences and core elements were obtained and aligned within the entire promoter sequences extracted using Gene2Promoter (Genomatix). Flanking primers sets (Table S1) were then designed upstream and downstream of each predicted transcription factor binding sites to amplify immunoprecipitated DNA. Chromatin was prepared and immunoprecipitated as described earlier (11). Briefly, protein–chromatin complexes were fixed in 37% (vol/vol) formaldehyde (diluted to 1% in culture media), washed with PBS, and harvested in chromatin IP buffer (50 mM Tris⋅HCl at pH 7.5, 150 mM Nacl, 5 mM EDTA, 0.5% Nonidet P-40, 1.0% Triton X-100) + protease and phosphatase inhibitors (Sigma). Cells were pelleted, washed, resuspended in IP (chromatin IP) buffer, and sonicated 15 × 1 s at output 2 with a sonic dismembrator (Fisher model 100). This method repeatedly produced DNA fragments of between 400 and 800 base pairs. Sonicated protein–DNA complexes were incubated with ChIP-grade antibodies (Table S2) or IgG at 4 °C overnight and precipitated with preblocked Protein G agarose (MicroProtein Technologies) for 1.5 h at 4 °C. DNA was eluted with Chelex-100 resin, quantified using the PicoGreen assay (Life Technologies) and amplified by quantitative PCR, using the primers listed in Table S1.
Tissue Preparation, Immunohistochemistry, and Thio-S Quantification.
Deeply anesthetized animals were transcardially perfused with ice-cold artificial cerebrospinal fluid (125 mM NaCl, 2.5 mM KCl, 1.25 mM NaH2PO4, 25 mM NaHCO3, 2 mM CaCl2, 2 mM MgCl2, 10 mM dextrose, 1.3 mM ascorbic acid, 3 mM Na-Pyruvate), brains were excised, and one hemisphere was immersion fixed in 4% paraformaldehyde. Hemibrains were then postfixed in a sucrose gradient (5–30%) and sectioned at 40 µm with a sliding microtome. Free-floating sections were blocked in 2% BSA (wt/vol) and 3% normal donkey serum (Jackson), made up in dilution media (TBS + 0.05% Triton-X 100) for 1 h, and then incubated with antibody 6E10 (1:300) in 0.4% Triton-X100, 1% BSA (wt/vol), and 1% normal donkey serum made up in PBS for 18 h at room temperature. After washing and incubation with donkey anti-mouse Alexa-Fluor 647 secondary antibodies (Jackson) for 1 h, free-floating sections were stained with 0.002% Thio-S (Sigma) made up in TBS for 8 min. Sections were washed twice in 50% EtOH for 1 min and twice in TBS for 5 min before drying and mounting in Fluoromount (Sigma).
Thio-S quantification was performed on >13 sections representing every sixth coronal serial section spanning the anterior to posterior hippocampal axis, including the overlying cortical regions. First, grayscale images were uniformly thresholded and made binary with Fiji. Regions of interest specific to the entire hippocampal formation and cortex were empirically defined. Using the analyze particles function, total plaque area, average plaque size, and average puncta count were determined to quantify amyloid area fraction and plaque numbers.
Statistical Analysis.
Unless otherwise stated, one-way ANOVA followed by Tukey’s or Scheffé’s post hoc tests, two-way ANOVA or Student’s t tests and Kaplan–Meier survival estimators (χ2) were used for data analyses, using SPSS 19. Data represent mean ± SE (SEM), and P < 0.05 was considered statistically significant.
Supplementary Material
Acknowledgments
We thank Dustin Wakeman and Benjamin Hiller for their assistance with histological preparation. A portion of this work was completed while G.T.C. was supported by a National Institutes on Aging Predoctoral training Grant (5T32 AG000269). This work was supported by grants from National Institutes of Health (AT6681 and NS083054) and a merit award from Veteran Affairs (I01BX003033-01).
Footnotes
The authors declare no conflict of interest.
This article is a PNAS Direct Submission.
This article contains supporting information online at www.pnas.org/lookup/suppl/doi:10.1073/pnas.1504890112/-/DCSupplemental.
References
- 1.LaFerla FM, Green KN, Oddo S. Intracellular amyloid-beta in Alzheimer’s disease. Nat Rev Neurosci. 2007;8(7):499–509. doi: 10.1038/nrn2168. [DOI] [PubMed] [Google Scholar]
- 2.O’Brien RJ, Wong PC. Amyloid precursor protein processing and Alzheimer’s disease. Annu Rev Neurosci. 2011;34:185–204. doi: 10.1146/annurev-neuro-061010-113613. [DOI] [PMC free article] [PubMed] [Google Scholar]
- 3.Allinson TM, Parkin ET, Turner AJ, Hooper NM. ADAMs family members as amyloid precursor protein alpha-secretases. J Neurosci Res. 2003;74(3):342–352. doi: 10.1002/jnr.10737. [DOI] [PubMed] [Google Scholar]
- 4.Seals DF, Courtneidge SA. The ADAMs family of metalloproteases: Multidomain proteins with multiple functions. Genes Dev. 2003;17(1):7–30. doi: 10.1101/gad.1039703. [DOI] [PubMed] [Google Scholar]
- 5.Kuhn PH, et al. ADAM10 is the physiologically relevant, constitutive alpha-secretase of the amyloid precursor protein in primary neurons. EMBO J. 2010;29(17):3020–3032. doi: 10.1038/emboj.2010.167. [DOI] [PMC free article] [PubMed] [Google Scholar]
- 6.Postina R, et al. A disintegrin-metalloproteinase prevents amyloid plaque formation and hippocampal defects in an Alzheimer disease mouse model. J Clin Invest. 2004;113(10):1456–1464. doi: 10.1172/JCI20864. [DOI] [PMC free article] [PubMed] [Google Scholar]
- 7.Epis R, et al. Blocking ADAM10 synaptic trafficking generates a model of sporadic Alzheimer’s disease. Brain. 2010;133(11):3323–3335. doi: 10.1093/brain/awq217. [DOI] [PubMed] [Google Scholar]
- 8.Colciaghi F, et al. Platelet APP, ADAM 10 and BACE alterations in the early stages of Alzheimer disease. Neurology. 2004;62(3):498–501. doi: 10.1212/01.wnl.0000106953.49802.9c. [DOI] [PubMed] [Google Scholar]
- 9.Marcello E, et al. Endocytosis of synaptic ADAM10 in neuronal plasticity and Alzheimer’s disease. J Clin Invest. 2013;123(6):2523–2538. doi: 10.1172/JCI65401. [DOI] [PMC free article] [PubMed] [Google Scholar]
- 10.Colciaghi F, et al. [alpha]-Secretase ADAM10 as well as [alpha]APPs is reduced in platelets and CSF of Alzheimer disease patients. Mol Med. 2002;8(2):67–74. [PMC free article] [PubMed] [Google Scholar]
- 11.Roy A, et al. Regulation of cyclic AMP response element binding and hippocampal plasticity-related genes by peroxisome proliferator-activated receptor α. Cell Reports. 2013;4(4):724–737. doi: 10.1016/j.celrep.2013.07.028. [DOI] [PMC free article] [PubMed] [Google Scholar]
- 12.Barak Y, et al. PPAR gamma is required for placental, cardiac, and adipose tissue development. Mol Cell. 1999;4(4):585–595. doi: 10.1016/s1097-2765(00)80209-9. [DOI] [PubMed] [Google Scholar]
- 13.Tousseyn T, et al. ADAM10, the rate-limiting protease of regulated intramembrane proteolysis of Notch and other proteins, is processed by ADAMS-9, ADAMS-15, and the gamma-secretase. J Biol Chem. 2009;284(17):11738–11747. doi: 10.1074/jbc.M805894200. [DOI] [PMC free article] [PubMed] [Google Scholar]
- 14.Kamenetz F, et al. APP processing and synaptic function. Neuron. 2003;37(6):925–937. doi: 10.1016/s0896-6273(03)00124-7. [DOI] [PubMed] [Google Scholar]
- 15.Gofflot F, et al. Systematic gene expression mapping clusters nuclear receptors according to their function in the brain. Cell. 2007;131(2):405–418. doi: 10.1016/j.cell.2007.09.012. [DOI] [PubMed] [Google Scholar]
- 16.Heyman RA, et al. 9-cis retinoic acid is a high affinity ligand for the retinoid X receptor. Cell. 1992;68(2):397–406. doi: 10.1016/0092-8674(92)90479-v. [DOI] [PubMed] [Google Scholar]
- 17.Cartharius K, et al. MatInspector and beyond: Promoter analysis based on transcription factor binding sites. Bioinformatics. 2005;21(13):2933–2942. doi: 10.1093/bioinformatics/bti473. [DOI] [PubMed] [Google Scholar]
- 18.Podlisny MB, et al. Aggregation of secreted amyloid beta-protein into sodium dodecyl sulfate-stable oligomers in cell culture. J Biol Chem. 1995;270(16):9564–9570. doi: 10.1074/jbc.270.16.9564. [DOI] [PubMed] [Google Scholar]
- 19.Oakley H, et al. Intraneuronal beta-amyloid aggregates, neurodegeneration, and neuron loss in transgenic mice with five familial Alzheimer’s disease mutations: Potential factors in amyloid plaque formation. J Neurosci. 2006;26(40):10129–10140. doi: 10.1523/JNEUROSCI.1202-06.2006. [DOI] [PMC free article] [PubMed] [Google Scholar]
- 20.Suh J, et al. ADAM10 missense mutations potentiate β-amyloid accumulation by impairing prodomain chaperone function. Neuron. 2013;80(2):385–401. doi: 10.1016/j.neuron.2013.08.035. [DOI] [PMC free article] [PubMed] [Google Scholar]
- 21.Villena JA. New insights into PGC-1 coactivators: Redefining their role in the regulation of mitochondrial function and beyond. FEBS J. 2015;282(4):647–672. doi: 10.1111/febs.13175. [DOI] [PubMed] [Google Scholar]
- 22.Prinzen C, Müller U, Endres K, Fahrenholz F, Postina R. Genomic structure and functional characterization of the human ADAM10 promoter. FASEB J. 2005;19(11):1522–1524. doi: 10.1096/fj.04-3619fje. [DOI] [PubMed] [Google Scholar]
- 23.Tippmann F, Hundt J, Schneider A, Endres K, Fahrenholz F. Up-regulation of the alpha-secretase ADAM10 by retinoic acid receptors and acitretin. FASEB J. 2009;23(6):1643–1654. doi: 10.1096/fj.08-121392. [DOI] [PubMed] [Google Scholar]
- 24.Héraud C, et al. Increased misfolding and truncation of tau in APP/PS1/tau transgenic mice compared to mutant tau mice. Neurobiol Dis. 2014;62:100–112. doi: 10.1016/j.nbd.2013.09.010. [DOI] [PubMed] [Google Scholar]
- 25.Greeve I, et al. Age-dependent neurodegeneration and Alzheimer-amyloid plaque formation in transgenic Drosophila. J Neurosci. 2004;24(16):3899–3906. doi: 10.1523/JNEUROSCI.0283-04.2004. [DOI] [PMC free article] [PubMed] [Google Scholar]
- 26.Mayeux R, et al. Plasma A[beta]40 and A[beta]42 and Alzheimer’s disease: Relation to age, mortality, and risk. Neurology. 2003;61(9):1185–1190. doi: 10.1212/01.wnl.0000091890.32140.8f. [DOI] [PubMed] [Google Scholar]
- 27.Peters JM, et al. Growth, adipose, brain, and skin alterations resulting from targeted disruption of the mouse peroxisome proliferator-activated receptor beta(delta) Mol Cell Biol. 2000;20(14):5119–5128. doi: 10.1128/mcb.20.14.5119-5128.2000. [DOI] [PMC free article] [PubMed] [Google Scholar]
- 28.Glynn MW, McAllister AK. Immunocytochemistry and quantification of protein colocalization in cultured neurons. Nat Protoc. 2006;1(3):1287–1296. doi: 10.1038/nprot.2006.220. [DOI] [PubMed] [Google Scholar]
- 29.Guillemin I, Becker M, Ociepka K, Friauf E, Nothwang HG. A subcellular prefractionation protocol for minute amounts of mammalian cell cultures and tissue. Proteomics. 2005;5(1):35–45. doi: 10.1002/pmic.200400892. [DOI] [PubMed] [Google Scholar]
- 30.Shankar GM, Welzel AT, McDonald JM, Selkoe DJ, Walsh DM. Isolation of low-n amyloid β-protein oligomers from cultured cells, CSF, and brain. Methods Mol Biol. 2011;670:33–44. doi: 10.1007/978-1-60761-744-0_3. [DOI] [PubMed] [Google Scholar]