

Significance
The structure of chromatin is critical for processes such as transcription, DNA replication, and DNA repair. The most commonly used techniques for analyzing chromatin structure involve the use of enzymes such as micrococcal nuclease (MNase) and DNase I. These enzymes, however, have distinct characteristics that can at some times be an advantage but in other situations be a drawback. Here we describe methidiumpropyl-EDTA sequencing (MPE-seq), a method in which we use the chemical MPE-Fe(II) for the genome-wide analysis of chromatin structure. MPE-Fe(II) cleaves chromatin with minimal DNA sequence bias. Moreover, MPE-seq reveals noncanonical chromatin structures in active promoter regions that are not seen with standard MNase-seq conditions. MPE-seq provides insights into chromatin structure that complement the information gained from MNase-seq.
Keywords: MPE-Fe(II), chromatin, genome-wide analysis, promoter, micrococcal nuclease
Abstract
The analysis of chromatin structure is essential for the understanding of transcriptional regulation in eukaryotes. Here we describe methidiumpropyl-EDTA sequencing (MPE-seq), a method for the genome-wide characterization of chromatin that involves the digestion of nuclei withMPE-Fe(II) followed by massively parallel sequencing. Like micrococcal nuclease (MNase), MPE-Fe(II) preferentially cleaves the linker DNA between nucleosomes. However, there are differences in the cleavage of nuclear chromatin by MPE-Fe(II) relative to MNase. Most notably, immediately upstream of the transcription start site of active promoters, we frequently observed nucleosome-sized (141–190 bp) and subnucleosome-sized (such as 101–140 bp) peaks of digested chromatin fragments with MPE-seq but not with MNase-seq. These peaks also correlate with the presence of core histones and could thus be due, at least in part, to noncanonical chromatin structures such as labile nucleosome-like particles that have been observed in other contexts. The subnucleosome-sized MPE-seq peaks exhibit a particularly distinct association with active promoters. In addition, unlike MNase, MPE-Fe(II) cleaves nuclear DNA with little sequence bias. In this regard, we found that DNA sequences at RNA splice sites are hypersensitive to digestion by MNase but not by MPE-Fe(II). This phenomenon may have affected the analysis of nucleosome occupancy over exons. These findings collectively indicate that MPE-seq provides a unique and straightforward means for the genome-wide analysis of chromatin structure with minimal DNA sequence bias. In particular, the combined use of MPE-seq and MNase-seq enables the identification of noncanonical chromatin structures that are likely to be important for the regulation of gene expression.
In eukaryotes, transcription is regulated by the interplay between transcription factors and chromatin. The nucleosome, the basic building block of chromatin, can occlude the access of transcription factors and hinder transcription by RNA polymerases (1, 2). The positions of nucleosomes can, in turn, be influenced by the DNA sequence, transcription factors, ATP-driven chromatin remodelers, and RNA polymerases (see, for example, refs. 3, 4). Thus, the positions and properties of nucleosomes are important for the regulation of transcription in the chromatin landscape.
Micrococcal nuclease (MNase) has been a useful reagent for mapping nucleosome positions because it preferentially cleaves the linker DNA between nucleosomes and can yield core particles upon extensive digestion (5). Analyses of MNase-generated fragments by hybridization to high-density DNA microarrays or by using massively parallel sequencing technologies have made it possible to map genome-wide positions of nucleosomes (6–14). However, MNase has a bias for AT-rich sequences (15, 16), and whether or not this sequence bias affects the interpretation of nucleosome positions and occupancies has been a matter of debate (17–19).
To gain additional insights into chromatin structure, several alternative methods have been developed to map nucleosomes without the use of MNase. A method that relies on the chemical modification of engineered histone H4 has been developed to map nucleosomes in yeast (20), but this technique requires the genetic modification of histone H4. Nucleosome occupancy and methylome sequencing (NOMe-seq) infers nucleosome positions by analyzing methylation by a GpC methylase (M.CviPI) (21), but it relies on the presence of GpC residues. DNase I–released fragment-length analysis of hypersensitivity (DNase-FLASH) uses fragments generated by DNase I to map nucleosomes (22); however, DNase I cuts DNA within nucleosomes and has its own sequence bias (23, 24). DNase I also exhibits a distinct preference for accessible chromatin, such as at promoters and enhancers (for example, see refs. 25, 26). Assay for transposase-accessible chromatin with high-throughput sequencing (ATAC-seq) uses hyperactive Tn5 transposase to probe nucleosome positions and transcription factor binding (27). Like DNase I, the transposase mainly targets accessible chromatin regions. This characteristic can be an advantage for studying gene regulatory regions but also a disadvantage for the broader analysis of chromatin structure.
Here we report methidiumpropyl-EDTA sequencing (MPE-seq), a genome-wide method for the analysis of chromatin structure that uses a small synthetic molecule, MPE, to map nucleosome positions with little sequence bias. MPE forms a complex with ferrous iron to give MPE-Fe(II), which binds to DNA via intercalation of the methidium moiety and then generates single- and double-stranded DNA breaks in the presence of oxygen (28). MPE-Fe(II) cleaves naked DNA with little sequence specificity (29). It has also been used to map nucleosome positions in vivo (30–35). MPE-Fe(II) exhibits a preference for cleaving the linker DNA between nucleosomes, probably because it does not intercalate efficiently into DNA that is associated with histones. MPE-seq combines digestion of chromatin with MPE-Fe(II) and massively parallel sequencing of the resulting DNA fragments. Here we establish that MPE-Fe(II) cleaves chromatin with low sequence specificity and demonstrate that MPE-seq can be used to map nucleosome positioning genome-wide in vivo. There are, however, notable differences in the results obtained with MPE-seq and MNase-seq, particularly at promoters and splice sites. We also observed that MPE-seq can be used to detect sequence-specific DNA binding by some transcription factors. These findings reveal that MPE-seq, particularly when used in conjunction with MNase-seq, is a useful method for obtaining unique and important insights into chromatin structure.
Results and Discussion
MPE-Fe(II) Cleavage of Chromatin Exhibits Little DNA Sequence Bias.
To map nucleosome positions with MPE-Fe(II), nuclei from J1 mouse embryonic stem cells were treated with MPE-Fe(II). For comparison, nuclei were also digested in parallel with MNase. We isolated the resulting DNA fragments and analyzed their size distributions by agarose gel electrophoresis (Fig. 1A). As previously reported (30, 31, 33, 34), MPE-Fe(II) generates DNA fragments with lengths that are multiples of ∼180–200 bp due to the double-stranded cleavage of the linker DNA between nucleosomes.
Fig. 1.
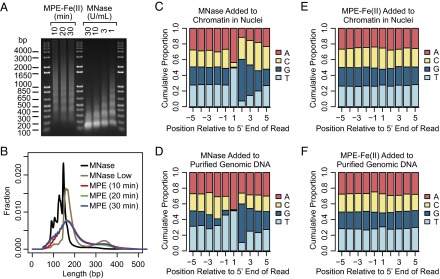
Comparison of fragments generated by MPE-Fe(II) and MNase. (A) DNA fragments generated by digestion of J1 mouse embryonic stem cell nuclei with MPE-Fe(II) or MNase. For MPE-Fe(II) digestion, the nuclei were incubated with 50 μM of MPE-Fe(II) for the indicated times before quenching the reaction. For MNase digestion, the nuclei were incubated with the indicated concentrations of MNase for 10 min. The DNA was isolated from the digested samples and then analyzed by agarose gel electrophoresis. (B) The size distributions of sequenced DNA fragments. Sequencing libraries prepared from MPE-Fe(II)– or MNase-generated fragments were subjected to paired-end sequencing, and the sizes of the fragments were inferred from the positions of the mapped ends. (C–F) Cumulative base compositions of residues at positions relative to the mapped ends.
The average length of DNA in the mononucleosomal species generated by MPE-Fe(II) was larger than that obtained with MNase (∼147 bp). Also, unlike MNase, MPE-Fe(II) did not digest chromatin into predominantly mononucleosomal species (Fig. 1A). For our genome-wide studies, we did not use higher concentrations of MPE-Fe(II) because we observed a more general cleavage of DNA, including nucleosomal DNA, under such conditions (Fig. S1). Hence, our reaction conditions were chosen to be selective for the cleavage of the linker DNA.
Fig. S1.

DNA fragments generated by different MPE-Fe(II) concentrations. Nuclei were digested for 20 min by using different MPE-Fe(II) concentrations as indicated. DNA was isolated and analyzed by agarose gel electrophoresis.
We prepared libraries from the MPE-Fe(II)-digested samples and performed paired-end sequencing with Illumina HiSeq sequencers. By mapping reads from both ends to the mouse genome, we were able to obtain size distributions of the fragments that were sequenced (Fig. 1B). Consistent with the agarose gel electrophoresis data (Fig. 1A), the peak size of MPE-Fe(II)–generated fragments (165 bp) is larger than the peak sizes obtained for MNase-generated fragments [147 bp for samples digested with 30 U/mL MNase (designated as “MNase”) and 158 bp for samples digested with 1 U/mL MNase (designated as “MNase Low”)]. We note that there are peaks of MPE-Fe(II)–generated fragments below 147 bp that are separated by regular intervals of ∼10 bp. This effect is probably due to the periodic cleavage of nucleosomal DNA that is facing outward from the octamer and is thus more accessible for digestion. We also observed subnucleosome-sized peaks in MNase-digested samples. This effect is consistent with the previously described ability of MNase to cut within nucleosomes (36, 37). For the subsequent analysis below, we pooled the MPE-Fe(II)–derived data from samples obtained by treatment for 10, 20, and 30 min.
To compare the sequence biases of MNase and MPE-Fe(II), we analyzed the base compositions of nucleotides in the vicinity of the 5′ ends of the uniquely mapped reads (Fig. 1 C–F). With chromatin isolated from MNase-digested nuclei, over 90% of the 5′ ends of the DNA fragments were A or T (Fig. 1C), and the following few bases were depleted in A and T. A closely related pattern was seen with naked genomic DNA (Fig. 1D); hence, this effect appears to be due to the intrinsic sequence specificity of MNase. This MNase digestion preference was also observed in data obtained from nuclei digested with a lower concentration of MNase (MNase Low; Fig. S2A) as well as in results from previous reports of MNase digestion of chromatin or genomic DNA (Fig. S2 B–E).
Fig. S2.

Cumulative base compositions of residues at positions relative to the mapped ends. (A) Data from samples digested with the low (1 U/mL) concentration of MNase (this study). (B) Data from MNase digestion of human granulocyte nuclei by Valouev et al. (10). (C) Data from MNase digestion of human granulocyte genomic DNA by Valouev et al. (10). (D) Data from MNase digestion of mouse embryonic stem cell nuclei by Teif et al. (12). (E) Data from MNase digestion of mouse embryonic stem cell nuclei by Li et al. (13). (F) Data from DNase I digestion by Vierstra et al. (22). (G) Data from ATAC-seq by Buenrostro et al. (27).
In contrast, MPE-Fe(II) digestion of nuclei or genomic DNA yielded fragments with an even distribution of bases at each position near the 5′ ends (Fig. 1 E and F). Hence, the sequence bias of MPE-Fe(II) is substantially less than that of MNase, DNase I (Fig. S2F, based on data from ref. 22; also see refs. 23, 24), or the Tn5 transposase used in ATAC-seq (Fig. S2G, based on data from ref. 27). We also analyzed the distributions of all combinations of dinucleotides in the vicinity of the 5′ ends of the uniquely mapped reads (Fig. S3). The MPE-Fe(II) data revealed small peaks and troughs near the 5′ ends, but this effect was much less pronounced than that seen with MNase. Thus, the use of MPE-Fe(II) enables the mapping of nucleosomes with minimal sequence bias.
Fig. S3.

Occurrence of different dinucleotides at positions relative to the 5′ ends of mapped reads. (A) Data from samples digested with MPE-Fe(II). (B) Data from samples digested with MNase.
MPE-Seq Reveals Noncanonical Chromatin Structures in Active Promoter Regions.
There are characteristic patterns of nucleosome occupancy and positioning that have been observed at transcriptional promoter regions (3, 4, 7, 8, 10). The area that is immediately upstream of the transcription start site (TSS) is often found to be depleted of canonical nucleosomes and is referred to as a nucleosome-free region (NFR) or a nucleosome-depleted region (NDR). Well-positioned nucleosomes are commonly seen downstream of the TSS in the transcribed region, and the precision of this positioning decays as distance from the TSS increases.
To analyze nucleosome positioning with the MPE-seq and MNase-seq data, we selected DNA fragments that were from 141 to 190 bp in length (corresponding to DNA lengths that could be obtained from mononucleosomes) and assigned each nucleotide in the middle 60 bp of each fragment a value of 1. Then, for each position, the sum of the values normalized to the genome-wide average was plotted as the Nucleosome Positioning Index (Nucleosome Positioning Analysis and Fig. 2A). The peaks thus obtained would generally be expected to indicate the positions of nucleosomes or nucleosome-like species.
Fig. 2.

Analysis of chromatin structure with MPE-seq. (A) Diagram of nucleosome positioning and cutting site analyses. Fragments generated by MPE-Fe(II) or MNase digestion are indicated by the gray lines. The cutting sites were inferred from the positions of the DNA sequences at the ends of the fragments, which are denoted by squares. In the cutting site analyses, we used DNA fragments of all size ranges. The ends of forward and reverse reads were analyzed separately and then normalized to the genome-wide average. Nucleosome positioning analysis was performed as follows: We used fragments that are 141–190 bp in length because this size range is comparable to the amount of DNA that is typically associated with a single nucleosome. We assigned a value of 1 to each of the middle 60 bp of such fragments, as depicted by the yellow bars. For fragments with an odd-numbered length, we assigned a value of 1 to each of the middle 59 bp and a value of 0.5 to the bp on each end, as shown. The Nucleosome Positioning Index for each position is defined to be the sum of the values normalized to the genome-wide average. (B) Comparison of MNase-seq and MPE-seq data. Representative screenshots are shown for data obtained from J1 mouse embryonic stem cell nuclei that were digested by MNase under standard conditions (MNase), a low concentration of MNase (MNase Low), or MPE-Fe(II). The MPE-Fe(II) peaks labeled a, b, c, and d are discussed in the text.
Comparison of the MPE-seq data with the MNase-seq data at standard or low (MNase Low; Fig. 1B) concentrations of MNase revealed many similarities in the nucleosome positioning peaks at promoters, such as in the regions downstream of the TSSs in which a few positioned nucleosomes are often observed. However, immediately upstream of the TSSs, we commonly observed a peak with MPE-seq but not with MNase-seq (for specific examples, see peaks labeled a, b, c, and d in Fig. 2B). This MPE-seq–specific peak can also be observed in the averaged analysis of nucleosome positioning with 20,195 well-annotated promoters (Fig. 3 A–C). In contrast, the downstream and farther upstream peaks with MPE-seq and MNase-seq correlate well (Fig. 3D). Thus, nucleosome positioning analysis with MPE-seq reveals peaks in the upstream promoter region that are not seen with MNase-seq.
Fig. 3.

Genome-wide analysis of the chromatin structure of promoters with MPE-Fe(II). (A–C) Averaged Nucleosome Positioning Index of chromatin digested with (A) MPE-Fe(II), (B) the standard concentration of MNase, or (C) the low concentration of MNase (MNase Low) at positions within 1 kb of the TSS with 20,195 promoters. The estimated average positions of nucleosomes are indicated by ovals. (D) Comparison of nucleosome positioning data with MPE-Fe(II), MNase, and MNase Low. (E–G) Averaged cutting site analysis of chromatin digested with (E) MPE-Fe(II), (F) the standard concentration of MNase, or (G) MNase Low for each strand at positions within 1 kb of the TSS with 20,195 promoters. (H) Cutting site analysis of forward reads. (I) Cutting site analysis of reverse reads. (J–L) Analysis of fragments of the indicated size ranges in chromatin digested with (J) MPE-Fe(II), (K) the standard concentration of MNase, or (L) the low concentration of MNase. The Fragment Positioning Index was calculated in a manner that is analogous to the Nucleosome Positioning Index (Fig. 2A) (SI Materials and Methods).
To gain a different perspective on MPE-Fe(II)– versus MNase-mediated cleavage of chromatin in promoter regions, we also carried out “cutting site analysis” (Fig. 2A), in which we assigned the nucleotide at the end of each digested fragment (of all size ranges) a value of 1 and then plotted the sum obtained from all sequenced fragments at each position normalized to the genome-wide average. As shown in Fig. 3 E and F, there are striking differences in the digestion of chromatin at promoters with MPE-Fe(II) relative to MNase. In particular, upstream of the TSS, the MNase-seq signal is much lower than that seen with MPE-seq. This effect appears to be due, in part, to the extensive digestion of the upstream promoter chromatin by MNase under standard conditions, as suggested by fragment midpoint versus length plots (38) (Fig. S4). In further support of this notion, the use of a lower MNase concentration (MNase Low; Fig. 1B) resulted in less digestion of the upstream promoter chromatin and yielded a profile (Fig. 3G) with some similarity to that obtained with MPE-Fe(II) (Fig. 3E). Overlays of the cutting site data reveal that MPE-Fe(II) and MNase cleavage patterns are different upstream of the TSS, but are similar downstream of the TSS (Fig. 3 H and I).
Fig. S4.
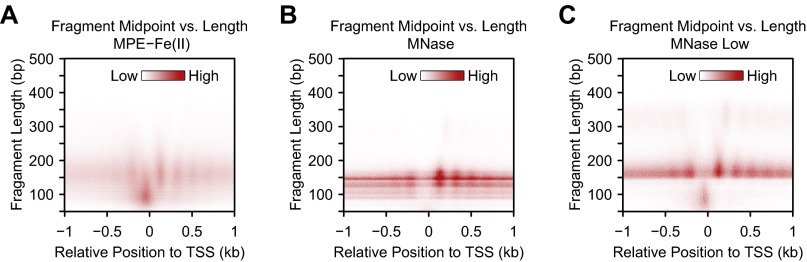
Fragment midpoint versus length plots of chromatin digested with (A) MPE-Fe(II), (B) the standard concentration of MNase, or (C) the low concentration of MNase. The fragments were classified according to their lengths and the positions of their midpoints relative to the TSS. The densities of fragments of specific lengths at their midpoint positions were then plotted.
We further sought to investigate the MPE-specific peaks in the nucleosome positioning index in the upstream promoter region (Figs. 2B and 3 A–D). Because the nucleosome positioning index is limited to 141–190 bp DNA fragments (Fig. 2A), we analyzed the localization of different lengths of DNA fragments in the promoter region. We observed that short (50–100 bp; 101–140 bp) DNA fragments exhibit a sharp peak in the immediate upstream promoter region with MPE-seq and MNase Low-seq but not with standard MNase-seq (Fig. 3 J–L). These findings are consistent with the fragment midpoint versus length plots (Fig. S4) and indicate that MNase-sensitive particles are present in the upstream promoter region.
Next, to examine the relationship between transcriptional activity and chromatin structure, we ranked the promoters according to the transcript levels from RNA-seq data and generated heat maps of cutting site and nucleosome positioning data from MPE-Fe(II) and MNase experiments (Fig. 4A). At highly transcribed genes, the nucleosome positions and cutting sites are much more distinct than those at less transcribed genes. We additionally examined the 101–140 bp DNA-containing particles that were generated by MPE-seq, MNase-seq, and MNase Low-seq (Fig. 4B). The resulting heat maps revealed a strikingly strong signal of 101–140 bp DNA-containing particles in the upstream promoter region with MPE-seq and MNase Low-seq relative to MNase-seq. Moreover, the intensity of the signal of these 101–140 bp particles correlates with the RNA-seq level.
Fig. 4.

MPE-Fe(II) and MNase digestion patterns at 16,800 promoters. The promoters were ranked according to their transcript levels [fragments per kilobase of exon per million fragments mapped (FPKM)] from RNA-seq data. The asterisks denote the position of the signal that is immediately upstream of the TSS. (A) Heat maps from the cutting site and nucleosome positioning analyses (140–191 bp DNA fragments). (B) Heat maps of the Fragment Positioning Index of subnucleosome-sized particles (101–140 bp) generated by digestion with MPE-Fe(II), MNase, or MNase Low conditions.
We then examined whether these MNase-sensitive particles contain core histones. To address this question, we carried out histone H2B and histone H3 ChIP-seq experiments with the soluble chromatin particles that were generated by digestion with MPE-Fe(II) or MNase Low. [Technical note: The ChIP-seq input DNA samples, which were prepared from soluble chromatin fragments, are not identical to the DNA fragments in the MPE-seq and MNase Low-seq experiments, which were performed with total (soluble and insoluble) chromatin.] With nucleosome-sized DNA lengths (141–190 bp), we observed a peak of H2B as well as H3 in the upstream promoter region with MPE-ChIP-seq but not with MNase Low-ChIP-seq (Fig. 5 A and B). With shorter subnucleosomal DNA lengths (50–100 bp and 101–140 bp), upstream promoter peaks of histones H2B and H3 were seen with both MPE-ChIP-seq as well as MNase Low-ChIP-seq (Fig. 5 C–F).
Fig. 5.
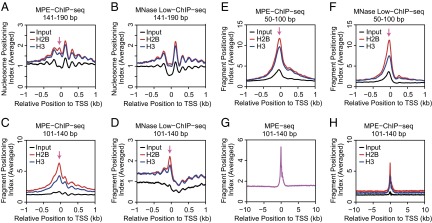
ChIP-seq analysis of histones H2B and H3 with chromatin digested with MPE-Fe(II) versus MNase Low conditions. The ChIP-seq experiments were performed with soluble chromatin that was generated by digestion with MPE-Fe(II) or MNase Low conditions; hence, the ChIP-seq input DNA samples are not identical to the DNA fragments in the MPE-seq and MNase Low-seq experiments, which were performed with total (soluble and insoluble) chromatin. To distinguish between nucleosome- and subnucleosome-sized particles, we analyzed the data in separate groups that correspond to 141–190 (nucleosome-sized) bp, 101–140 bp, and 50–100 bp DNA fragments. The peak of histone H2B and H3 localization in the upstream promoter region is indicated by the arrow. This analysis was performed with 20,195 RefSeq TSSs. (A, C, and E) MPE-ChIP-seq (A) 140–191 bp, (C) 101–140 bp, and (E) 50–100 bp DNA fragments. (B, D, and F) MNase Low-ChIP-seq analysis with (B) 140–191 bp, (D) 101–140 bp, and (F) 50–100 bp DNA fragments. (G) MPE-seq (101–140 bp DNA fragments) analysis from –10 kb to +10 kb relative to the TSS. (H) MPE-ChIP-seq (101–140 bp DNA fragments) of histones H2B and H3 from –10 kb to +10 kb relative to the TSS.
It is notable that subnucleosomal chromatin particles (e.g., 101–140 bp) yielded a stronger histone ChIP signal in the upstream promoter region than nucleosome-sized chromatin particles. These findings suggest the existence of histone-containing subnucleosomal particles in the upstream promoter region. Heat maps of the ChIP-seq data further revealed that the intensity of the histone ChIP signal at the promoter correlates with the transcript levels, as assessed by RNA-seq (Fig. S5).
Fig. S5.

MPE-ChIP-seq and MNase Low-ChIP-seq with histones H2B and H3 at 16,800 promoters. The promoters were ranked according to their transcript levels (FPKM values) from RNA-seq data. The red dots denote the position of the signal that is immediately upstream of the TSS. (A) Heat maps of the nucleosome positioning analyses of 140–191 bp DNA fragments. (B) Heat maps of the Fragment Positioning Index of subnucleosome-sized particles (101–140 bp).
These experiments revealed, in particular, that the MPE-Fe(II)–generated subnucleosomal particles (101–140 bp DNA) exhibited the most striking correlation with the promoter region and transcriptional activity (Figs. 3J, 4B, and 5C and Fig. S5B). To determine the specificity of these particles for the promoter region, we plotted the averaged occurrence (n = 20,195) of the 101–140 bp MPE-seq fragments from –10 kb to +10 kb relative to the TSS and found a strong and specific enrichment at the promoter (Fig. 5G). In addition, we observed a parallel enrichment of the core histones H2B and H3 in 101–140 bp subnucleosomal fragments by MPE-ChIP-seq (Fig. 5H). Hence, altogether, the MPE-seq and MPE-ChIP-seq data reveal that there are subnucleosome-sized histone-containing particles in the upstream promoter region of active genes and that the presence of these particles correlates with transcript levels of the corresponding genes.
In the context of these data, it is useful to consider that extensive digestion of chromatin by MNase yields canonical core particles. In other words, canonical core particles are highly resistant to MNase (see, for example, ref. 5). This property of MNase enables the identification of stable canonical nucleosomes in chromatin. However, there have also been reports of noncanonical chromatin particles that are more sensitive to MNase digestion than canonical nucleosomes. These noncanonical particles include “fragile” (MNase-sensitive) and salt-labile nucleosomes (see, for example, refs. 39–42), which have been seen at active promoters in vivo, as well as “prenucleosomes” (nonnucleosomal histone-DNA particles) (43), which have been observed in vitro. The MNase-sensitive particles that are detected at promoters by MPE-seq may be related to these fragile and salt-labile nucleosomes.
The analysis of noncanonical chromatin structures is at an early stage, and the precise nature of these species has not yet been determined. Here, we have found that the combined use of MNase-seq and MPE-seq reveals the presence of histone-containing subnucleosomal particles at active promoters. It is intriguing to consider that these species may have an important and integral role in the transcription process.
Analysis of Chromatin at Exon–Intron Junctions.
Several studies have reported distinct nucleosome positioning at exon–intron junctions (44–47). However, exon–intron junctions contain specific splice donor or acceptor DNA sequences that could affect the efficiency of DNA cleavage by MNase (Fig. 6A for 3′ splice sites and Fig. S6A for 5′ splice sites). Indeed, we observed sharp peaks of cutting by MNase at exon–intron junctions (Fig. 6B for 3′ splice sites and Fig. S6B for 5′ splice sites). This effect is also observed when naked genomic DNA was digested with MNase (Fig. 6C for 3′ splice sites and Fig. S6C for 5′ splice sites). In contrast to the results seen with MNase, there were only small peaks and troughs of cutting by MPE-Fe(II) around exon–intron junctions (Fig. 6 D and E for 3′ splice sites and Fig. S6 D and E for 5′ splice sites).
Fig. 6.

MPE-seq versus MNase-seq analyses of 3′ splice sites of internal exons. (A) The average AT content at positions relative to the 3′ splice sites of internal exons was plotted. (B) Cutting site analysis of MNase-digested chromatin around 3′ splice sites. (C) Cutting site analysis of MNase-digested genomic DNA around 3′ splice sites. (D) Cutting site analysis of MPE-Fe(II)–cleaved chromatin around 3′ splice sites. (E) Cutting site analysis of MPE-Fe(II)–cleaved genomic DNA around 3′ splice sites. (F) Averaged Nucleosome Positioning Index around 3′ splice sites.
Fig. S6.

MPE-seq versus MNase-seq analyses of 5′ splice sites of internal exons. (A) The average AT content at positions relative to the 5′ splice sites of internal exons was plotted. (B) Cutting site analysis of MNase-digested chromatin around 5′ splice sites. (C) Cutting site analysis of MNase-digested genomic DNA around 5′ splice sites. (D) Cutting site analysis of MPE-Fe(II)–cleaved chromatin around 5′ splice sites. (E) Cutting site analysis of MPE-Fe(II)–cleaved genomic DNA around 5′ splice sites. (F) Averaged Nucleosome Positioning Index around 5′ splice sites.
To see if there is an enrichment of nucleosomes on the exons, we performed nucleosome positioning analysis with the MPE-seq and MNase-seq data (Fig. 6F for 3′ splice sites and Fig. S6F for 5′ splice sites). There is a striking enrichment of signals from MNase-generated fragments on exons, as has been described in previous studies (44–47). MPE-Fe(II)–generated fragments also show slight enrichment of signals on exons, but this effect is not as pronounced as that seen with MNase-generated fragments. These data indicate that the sequence specificity of MNase cleavage may have affected the analysis of nucleosome positioning at exon–intron junctions.
MPE-Seq Reveals Positioned Nucleosomes Around CTCF Binding Sites.
To determine whether MPE-seq can detect nucleosomes that are positioned next to sequence-specific DNA binding factors, we examined MPE-seq data in the vicinity of the 21,470 CCCTC-binding factor (CTCF) binding sites that contain a single CTCF motif within 1 kb of the flanking DNA. It might also be noted that only 1,018 of these 21,470 CTCF sites are within 1 kb of an annotated RefSeq TSS. Cutting site analysis (Fig. 2A) revealed an oscillatory pattern with an amplitude that decays with the distance from the CTCF binding motif (Fig. 7A). This pattern is similar to that seen with MNase-seq (Fig. 7 B and C; see also refs. 10, 12, 48) and is consistent with the presence of positioned arrays of nucleosomes in the vicinity of CTCF binding sites. A fragment midpoint versus length plot (38) yielded a V-shaped pattern of depleted signals in the middle, indicating protection from cleavage by the bound CTCF (Fig. 7D). In addition, fragments that are comparable in size to mononucleosomes (∼140–190 bp) are enriched at the expected positions of the positioned nucleosomes. We also observed enrichment of small fragments at the center, which were likely generated from the NDR flanking the CTCF motif. These small fragments are probably analogous to those found to be due to CTCF via RNAi knockdown followed by MNase analysis (14) as well as those seen with DNase I (22). For comparison, we have additionally included analogous plots with MNase and MNase Low digestion (Fig. 7 E and F).
Fig. 7.

MPE-Fe(II) and MNase digestion patterns in the vicinity of CTCF binding sites. (A–C) Cutting site analysis. A total of 21,470 CTCF ChIP-seq peaks with a single CTCF motif within 1 kb were aligned according to the positions and orientations of the CTCF motif. Of these 21,470 CTCF peaks, 1,018 are within 1 kb of an annotated RefSeq TSS. The number of cuts for each strand at each position relative to the CTCF motif was averaged, normalized, and then plotted. (D–F) Fragment midpoint versus length plots. MPE-Fe(II)–, MNase-, or MNase Low-generated fragments were classified according to the lengths and the positions of their midpoints relative to the midpoints of the CTCF motif. The densities of fragments of specific lengths and relative midpoint positions were then plotted. (G and H) Detection of sequence-specific binding of CTCF to chromatin via cutting site analysis with MPE-seq. The CTCF binding sites were classified into five groups based on the relative enrichment of CTCF ChIP-seq signals, with the first quintile having the highest CTCF enrichment. For each quintile, the averaged profile of cuts generated by MPE-Fe(II) (G) or MNase (H) at positions within 50 bp of the middle of CTCF motif was plotted for the chromatin sample and the genomic DNA (control) sample. The CTCF motif used for this analysis and the average AT content at positions relative to the middle of CTCF motif are shown at the bottom of the figure.
To visualize the MPE-seq–based nucleosome positions around individual CTCF peaks, we ranked them based on relative CTCF enrichment from the ChIP-seq data and generated heat maps of cutting site and nucleosome positioning analyses (Fig. S7A). We also prepared analogous heat maps from the MNase-seq data (Fig. S7B). Both the MPE-seq and MNase-seq results show a correlation between the degree of enrichment by CTCF and the clarity of the pattern of nucleosome positioning. In this particular respect, the MPE-seq data are similar to the MNase-seq data.
Fig. S7.

Cutting site and nucleosome positioning analyses of MPE-Fe(II) and MNase digestion patterns in the vicinity of CTCF binding sites. The heat maps display 21,470 CTCF binding sites that were ranked based on their relative enrichment of CTCF ChIP-seq signals. (A) MPE-seq data. (B) MNase-seq data.
We further used the cutting site analysis to determine whether CTCF footprints can be detected with MPE-seq. In Fig. 7G, we classified CTCF peaks into five groups based on the relative enrichment of CTCF ChIP-seq signals and then plotted the averaged profile of cutting for each group from –50 bp to +50 bp relative to the middle of the motif. This plot shows the protection of residues within the CTCF motif and enhanced cutting at positions flanking the motif that correlate with CTCF enrichment. In contrast, MNase generated sharp peaks of cuts at AT-rich positions within and around the CTCF motif (Fig. 7H.). These results show that the binding of CTCF to chromatin can be seen with MPE-seq. We also similarly analyzed the MPE-seq data for the sequence-specific DNA binding by repressor element-1 silencing transcription factor (REST; also known as NRSF, for neuron-restrictive silencer factor) (Fig. S8), which had been previously examined by MNase-sEq. (10). These results indicate that MPE-seq can potentially be used to detect the binding of sequence-specific factors to chromatin.
Fig. S8.

MPE-Fe(II) and MNase digestion patterns in the vicinity of REST binding sites. (A and B) Cutting site analysis. A total of 1,478 REST ChIP-seq peaks with a single REST motif within 1 kb were aligned according to the positions and orientations of the REST motif. The number of cuts for each strand at each position relative to the REST motif was averaged, normalized, and then plotted. (C and D) Fragment midpoint versus length plots. MPE-Fe(II)–, or MNase-generated fragments were classified according to the lengths and the positions of their midpoints relative to the midpoints of the REST motif. The densities of fragments of specific lengths and relative midpoint positions were then plotted. (E and F) Detection of sequence-specific binding of REST to chromatin via cutting site analysis with MPE-seq. The REST binding sites were classified into five groups based on the relative enrichment of REST ChIP-seq signals, with the first quintile having the highest REST enrichment. For each quintile, the averaged profile of cuts generated by MPE-Fe(II) (E) or MNase (F) at positions within 50 bp of the middle of REST motif was plotted for the chromatin sample and the genomic DNA control sample. The REST motif used for this analysis and the average AT content at positions relative to the middle of REST motif are shown at the bottom of the figure.
Summary and Perspectives.
MPE-Fe(II) is a small molecule (molecular mass of 729.5 g/mol) that cleaves DNA with little sequence bias and has been previously used for mapping nucleosome positions at individual genes. In this study, we combined MPE-Fe(II) digestion and massively parallel sequencing of the resulting DNA fragments to map nucleosomes and subnucleosomal particles genome-wide. By carrying out MPE-Fe(II) versus MNase digestion of chromatin and genomic DNA in parallel, we were able to compare MNase-seq with MPE-seq. We observed notable differences between these methods, such as at promoters and splice sites.
One key feature of MNase is that it efficiently generates canonical nucleosome core particles. Thus, nucleosome positioning analysis peaks observed with MNase are likely to represent canonical nucleosomes. Like MNase, MPE-Fe(II) cleaves the linker DNA between nucleosomes, but unlike MNase, MPE-Fe(II) generated peaks of DNA fragments immediately upstream of TSSs. The most striking differences between MPE-seq and MNase-seq were observed with subnucleosomal histone-containing particles in the upstream proximal promoter region of active genes (Figs. 3–5 and Fig. S5). These species may be related to noncanonical chromatin particles that are often seen at gene regulatory regions such as promoters (39–42) but are not revealed by standard MNase-seq protocols. Thus, MPE-seq may be useful for the identification and characterization of these noncanonical chromatin structures at promoters. In this manner, the combined use of MNase-seq and MPE-seq would provide insights into chromatin structure that would not be obtained from either method alone.
In these studies, we also found that MPE-Fe(II) can be used to detect the binding of some sequence-specific DNA binding proteins. Although there are a number of useful chromatin immunoprecipitation (ChIP)-based methods for identifying the presence of proteins in the vicinity of specific DNA sequences, MPE-Fe(II) is a high-resolution probe of the accessibility of the DNA template itself. Such information could be used to complement data from ChIP-based techniques.
In conclusion, MPE-seq is a straightforward method for the genome-wide analysis of chromatin structure that can be used directly with cells without complicated genetic modifications. MPE-seq reveals the accessibility of chromatin with little DNA sequence bias. We further propose that MPE-seq would be particularly useful when used in conjunction with MNase-seq, as the two methods provide complementary data on chromatin structure that would likely be useful for the study of gene expression.
Materials and Methods
Digestion with MPE-Fe(II).
In a typical experiment, 160 μL of J1 mouse embryonic stem cell nuclei (at a concentration that, upon 40-fold dilution, gives an A260 nm of 0.2; prepared as described in SI Materials and Methods) were used for digestion with MPE-Fe(II). MPE-Fe(II) complex was prepared by mixing 20 μL of 2.5× digestion buffer [1× digestion buffer, 10 mM Tris, pH 7.5, 15 mM NaCl, 60 mM KCl, 0.15 mM spermine, 0.5 mM spermidine, complete EDTA-free protease inhibitor mixture (Roche)], 12.5 μL of 1 mM MPE, and 12.5 μL of freshly prepared 1 mM ammonium iron(II) sulfate. Immediately before initiating the reaction, 2 μL of 100 mM hydrogen peroxide was added to the mouse embryonic stem cell nuclei, and 5 μL of 100 mM DTT was added to the MPE-Fe(II). The reaction was initiated by adding 40 μL of the activated MPE-Fe(II) (250 μM) to the mouse embryonic stem cell nuclei [to a final MPE-Fe(II) concentration of 50 μM]. The reaction was incubated at 25 °C. We took 60 μL samples after 10, 20, and 30 min of incubation, and the reaction was quenched by the addition of 6 μL of 60 mM bathophenanthroline. To each sample, 200 μL of buffer (20 mM EDTA, 200 mM NaCl, 1% SDS, 0.25 mg/mL glycogen) and 10 μL of 20 mg/mL proteinase K were added, and the mixture was incubated at 37 °C for 3–4 h. Then each sample was extracted twice with 300 μL of phenol, extracted once with 300 μL of 24:1 chloroform/isoamyl alcohol, and precipitated by the addition of 40 μL of 3 M sodium acetate (pH 5.2) followed by 1 mL ethanol. The pellet was washed with 1 mL 75% (vol/vol) ethanol, dried, and resuspended in 200 μL TE. We added 2 μL of 10 mg/mL RNase A to each sample, and the sample was digested by incubation at 37 °C for 3–4 h. The samples were extracted with phenol and 24:1 chloroform/isoamyl alcohol and were precipitated again as described above. The resulting DNA was used for sequencing. A detailed description of the other methodology and data analysis is provided in SI Materials and Methods. The data have been deposited in the Gene Expression Omnibus (accession no. GSE69098).
SI Materials and Methods
Cell Culture and Isolation of Nuclei.
J1 mouse embryonic stem cells were maintained on a feeder layer of irradiated mouse embryonic fibroblasts (Global Stem) on gelatin-coated plates in medium composed of DMEM with 4.5 g/L glucose, l-glutamine, and sodium pyruvate (Corning 10–013-CV), supplemented with 15% (vol/vol) heat-inactivated FBS (HyClone), 0.1 mM 2-mercaptoethanol, 0.1 mM nonessential amino acids (Gibco), 2 mM l-alanyl-l-glutamine dipeptide (Gibco), penicillin–streptomycin (Gibco), and 1,000 units/mL Leukemia Inhibitory Factor (EMD Millipore). Before the experiments, J1 cells were passaged twice on feeder-free gelatin-coated plates.
Cells were washed with ice-cold PBS once and were collected by scraping in ice-cold PBS. The cells were centrifuged for 5 min at 500 × g, and the supernatant was removed. The cells were resuspended in PBS, centrifuged for 5 min at 500 × g, and the supernatant was removed again. The cells were resuspended in reticulocyte standard buffer (RSB) [10 mM Tris, pH 7.5, 3 mM MgCl2, 10 mM NaCl, complete EDTA-free protease inhibitor mixture (Roche)]. Then an equal volume of RSB containing 1% Nonidet P-40 was added and mixed to make the final concentration of Nonidet P-40 to ∼0.5% (vol/vol). The cells were incubated on ice for 5 min and then passed through a 22-gauge needle once. The lysed cells were centrifuged at 500 × g for 5 min, and the supernatant was removed. The nuclear pellet was resuspended in Digestion Buffer [10 mM Tris, pH 7.5, 15 mM NaCl, 60 mM KCl, 0.15 mM spermine, 0.5 mM spermidine, complete EDTA-free protease inhibitor mixture (Roche)]. The concentration of the resuspended nuclei was adjusted such that a 40-fold dilution (5 μL of nuclei combined with 195 μL of a solution of 5 M urea and 2 M NaCl) gives an A260nm of 0.2. These nuclei were digested with MPE-Fe(II) or MNase for the MPE-seq and MNase-seq analyses.
Digestion with MNase.
In a typical experiment, 160 μL aliquots of the diluted J1 cell nuclei described in the main text were digested by different concentrations of MNase. We prepared 5, 15, 50, or 150 units/mL MNase (Sigma, N-5386) in Digestion Buffer supplemented with 5 mM CaCl2. The digestion reaction was started by adding 40 μL of MNase solution of a given concentration to a 160 μL aliquot of nuclei. The final concentrations of MNase were 1, 3, 10, or 30 units/mL, and the final CaCl2 concentration was 1 mM. The reaction was incubated at 25 °C for 10 min, and the reaction was stopped by addition of 200 μL Stop Solution (20 mM EDTA, 200 mM NaCl, 1% SDS, and 0.25 mg/mL glycogen). The proteins were removed and DNA was isolated as described for MPE-Fe(II)–digested samples.
Digestion of Genomic DNA.
Genomic DNA was isolated from J1 mouse ES cell nuclei without digestion with MPE-Fe(II) or MNase and processed to remove proteins and RNA.
For MPE-Fe(II) digestion, genomic DNA was adjusted to 125 ng/μL in 10 mM Tris, pH 8.0, 3 mM MgCl2, and 10 mM NaCl, and 100 μL (12.5 μg) was used for digestion. MPE-Fe(II) complex was prepared by mixing 8 μL 25 mM Tris, pH 7.5, 5 μL 1 mM MPE, and 5 μL of freshly prepared 1 mM ammonium iron(II) sulfate. Just before initiating the reaction, 1 μL of 100 mM hydrogen peroxide was added to the genomic DNA solution, and 2 μL 100 mM DTT was added to the MPE-Fe(II). The reaction was initiated by adding 10 μL of the activated MPE-Fe(II) (250 μM) to the genomic DNA [final MPE-Fe(II) concentration of 23 μM]. The reaction was incubated at 25 °C. We took 20-μL samples after 5, 10, 20, and 30 min of incubation, and the reaction was quenched by addition of 2 μL 60 mM bathophenanthroline. DNA was precipitated with ethanol, and the sample digested for 5 min was sequenced.
For MNase digestion, genomic DNA was adjusted to 125 ng/μL in 10 mM Tris, pH 8.0, 3 mM MgCl2, and 10 mM NaCl, and 20 μL (2.5 μg) aliquots were used for digestion. MNase (0.15 units/mL) was prepared in 10 mM Tris, pH 8.0, 3 mM MgCl2, 10 mM NaCl, and 5 mM CaCl2. We added 5 μL of MNase to the 20 μL genomic DNA (final MNase concentration of 0.03 units/mL). The sample was incubated for 10 min at 25 °C, and the reaction was stopped by addition of 100 μL Stop Solution (20 mM EDTA, 200 mM NaCl, 1% SDS, and 0.25 mg/mL glycogen). The sample was digested with proteinase K, extracted with phenol and 24:1 chloroform/isoamyl alcohol, and DNA was precipitated as described above.
Preparation of Sequencing Libraries.
We used 100 ng of DNA sample as a starting material for the sequencing library. End repair was performed in 50-μL reactions with End-It DNA End-Repair Kit (Epicenter) following the manufacturer’s protocol. The samples were purified with MinElute columns (Qiagen) and eluted in 2 × 16 μL Buffer EB (Qiagen). The 3′ ends of the DNA fragments were adenylated in 50-μL reactions containing 1× NEBuffer 2 (New England Biolabs), 0.2 mM dATP, and 15 units Klenow (3′ → 5′ exo-) (New England Biolabs) at 37 °C for 30 min. The samples were purified with MinElute columns and eluted in 2× 10 μL Buffer EB. The samples were ligated to TruSeq adapters in 48-μL reactions containing 1× Quick ligase buffer and 3 μL Quick T4 DNA Ligase (New England Biolabs) by incubating at room temperature for 15 min. The samples were purified with MinElute columns and were eluted in 2× 20 μL EB. The volumes of the samples were reduced by SpeedVac, and the samples were run on 2% agarose gel. Gel slices that correspond to DNA sizes of ∼200–600 bp were cut, and the DNA was extracted using Qiagen gel extraction kit with QIAquick columns and was eluted in 50 μL Buffer EB. The concentrations of the samples were estimated by quantitative PCR, and the volumes to include for PCR amplification of the libraries were adjusted accordingly. The libraries were amplified in 50-μL reactions that include 25 μL 2× KAPA master mix (Kapa Biosystems), 1.25 μL Tru-seq primer mix, and 60 mM tetramethylammonium chloride to improve the coverage of AT-rich sequences (49). The reaction condition was 45 s at 98 °C; followed by nine cycles of 15 s at 98 °C, 30 s at 60 °C, 45 s at 72 °C, with a ramp rate of 2 °C/s; and 5 min at 72 °C. The samples were purified with MinElute columns and were eluted in 2× 15 μL Buffer EB. The samples were run on 2% agarose gel, gel slices were cut as described above, and the amplified libraries were extracted by Qiagen gel extraction kit with MinElute columns and were eluted in 2× 10 μL Buffer EB.
MPE- and MNase-ChIP-Seq.
Immunoprecipitation was carried out at a low salt concentration by using procedures similar to those described by Jin and Felsenfeld (50), but without a sucrose gradient centrifugation to isolate mononucleosomes. For MPE-ChIP-seq, nuclei from J1 mouse embryonic stem cells were digested with 50 μM MPE-Fe(II) in 500–600 μL reactions at 25 °C for 20 min, and the reaction was stopped by the addition of 1/10 the reaction volume of 60 mM bathophenanthroline. The digested nuclei were centrifuged at 2,500 rpm (587 × g) for 5 min, and the supernatant (S1) was collected. The pellet was resuspended in 2.1 times the reaction volume of low salt immuoprecipitation buffer [10 mM Tris, pH 7.5, 10 mM NaCl, 0.2 mM EDTA, complete EDTA-free protease inhibitor mixture (Roche)] and was incubated on ice for 15 min. The suspension was passed through a 27-gauge needle four times and centrifuged at 10,000 rpm (9,391 × g) for 10 min, and the supernatant (S2) was collected. Then, S1 and S2 were combined and were used for immunoprecipitation. For MNase Low-ChIP-seq, nuclei were digested with 1 unit/mL MNase at 25 °C for 10 min, and the reaction was stopped by addition of EDTA to 10 mM. The MNase-digested sample was processed in the same way as the MPE-Fe(II)–digested sample, except 2.2 times the reaction volume of low salt immunoprecipitation buffer was used instead.
Antibodies against histone H2B (Abcam, ab1790) or histone H3 (Abcam, ab1791) were used for immunoprecipitation. We bound 5 μg of the indicated antibody to 50 μL of Dynabeads M-280 Sheep Anti-Rabbit IgG (Life Technologies). The beads were washed with PBS containing 5 mg/mL BSA, and the solution was aspirated. Then, 400 μL of the combined supernatants S1 and S2 were incubated with the beads at 4 °C overnight. This was followed by five washes with 1 mL low salt immunoprecipitation buffer. The beads were eluted by incubation with 150 μL elution buffer (10 mM Tris, pH 8.0, 1 mM EDTA, 1% SDS) at 65 °C for 20 min with vigorous shaking, and DNA was isolated from the eluate. The DNA was also isolated from the combined S1 and S2 to serve as an input sample. We prepared sequencing libraries with 10 ng of DNA and TruSeq adapters using some modifications of the procedures described above to adjust for the smaller amount of DNA. The MPE-ChIP-seq libraries were amplified by 14 or 15 cycles of PCR. The MNase Low-ChIP-seq libraries were amplified by 12 cycles of PCR.
Sequencing and Mapping.
Paired-end sequencing of at least 50 bp from each end was performed using Illumina HiSeq2000/2500 instruments per the manufacturer’s instructions. The paired-end reads were aligned to the NCBI Build 37/mm9 reference sequences using Bowtie (51) using the first 50 bp of each read and allowing up to three mismatches and up to 500 bp insert size. From the uniquely mapped read pairs from a given biological replicate, PCR duplicates were removed using the Picard tool (broadinstitute.github.io/picard/). Data from two biological replicates were combined for a given experimental condition for downstream analyses.
The combined numbers of reads were 5.7 × 10⁷, 6.6 × 10⁷, and 4.7 × 10⁷ for chromatin samples digested with MPE-Fe(II) for 10 min, 20 min, and 30 min, respectively; 7.3 × 10⁷ for chromatin samples digested with the standard concentration of MNase; 6.2 × 10⁷ for chromatin samples digested with the low concentration of MNase; 7.2 × 10⁷ for genomic DNA samples digested with MPE-Fe(II); and 6.8 × 10⁷ for genomic DNA samples digested with MNase.
For most subsequent analyses, the sequencing data from chromatin samples digested with MPE-Fe(II) for 10 min, 20 min, and 30 min were pooled together.
RNA-Seq.
Isolation of RNA from J1 mES cells and preparation of sequencing libraries were done as described previously (52). Paired-end sequencing of 50 bp from each end was performed using Illumina instruments per the manufacturer’s instructions. Gene expression level measured as FPKM was determined using Cufflinks (53) (version 2.2.0) with RefSeq annotation.
Analysis of Previously Published Data.
Sequence read archive (SRA) files from Valouev et al. (10), Teif et al. (12), Li et al. (13), Vierstra et al. (22), and Buenrostro et al. (27) were downloaded. Data from Teif et al. (12), Vierstra et al. (22), and Buenrostro et al. (27) were mapped to appropriate reference genomes as paired-end data. Data from Valouev et al. (10) and Li et al. (13) were mapped as single-end data.
Characterization of DNA Fragments Generated by MPE-Fe(II) and MNase.
Lengths of the sequenced fragments were inferred from the distances between 5′ ends of the read pairs on the National Center for Biotechnology Information (NCBI) Build 37/mm9 reference sequences to generate Fig. 1B. Base compositions at positions from –5 bp to + 5 bp relative to the 5′ ends of the reads were obtained from the NCBI Build 37/mm9 reference sequences to generate Fig. 1 C–F and Fig. S2.
Cutting Site Analysis.
The sites of cutting by MPE-Fe(II) or MNase were inferred from the 5′ ends of the reads (Fig. 2A). In the cutting site analyses, we used DNA fragments of all size ranges. We assigned the nucleotide at the end of each digested fragment a value of 1 and then obtained the sum from all sequenced fragments at each position. This sum was divided by the genomic average [i.e., (the total number of reads)/(the genome size)] to obtain the Relative Cutting Efficiency at each position.
Nucleosome Positioning Analysis.
We used fragments that are 141–190 bp in length for this analysis because this range is comparable to the length of DNA that accommodates a single nucleosome. We determined that the use of the middle 60 bp of such fragments (see Fig. 2A for details) results in optimal smoothing and resolution of the data. We thus assigned each nucleotide in the middle 60 bp of each fragment a value of 1. For each position, we calculated the sum of the values. We then normalized this sum by dividing with the genomic average [i.e. (the total number of reads that are in the 141–190 bp range) × 60/(the genome size)] to obtain the Nucleosome Positioning Index.
The Fragment Positioning Index for DNA fragments in different size ranges (50–100 bp, 101–140 bp, 141–160 bp, and 161–190 bp) was obtained by the same method except for the normalization factor. When plots for DNA fragments in different size ranges were presented in the same graph as in Fig. 3 J–L, we used the total number of reads that are in the 50–190 bp range instead of the total number of reads that are in the 141–190 bp range for normalization. When plots for DNA fragments in a specific size range were presented as in Fig. 5 C–F, the total number of reads that are in the specific size range for the given data set was used instead.
Analysis of CTCF and REST Binding Sites.
The list of CTCF ChIP-seq peaks used in this study is from the Encyclopedia of DNA elements (ENCODE) project (54) and is available from the UCSC Genome Browser (wgEncodeEM001703). The CTCF motif around the peaks was identified by the HOMER software (55), and 21,470 peaks with a single CTCF motif within 1 kb were selected. The regions around the selected CTCF peaks were aligned relative to the position and the orientation of the CTCF motif.
The list of REST ChIP-seq peaks used in this study is from the studies by Yu et al. (56) and was downloaded from the GEO database (GSM698696). The positions of the peaks in NCBI Build 36/mm8 reference genome were converted to positions in mm9 reference genome using LiftOver utility from UCSC. The REST motif around the peaks was identified by the HOMER software (55), and 1,478 peaks with a single REST motif within 1 kb were selected and were aligned relative to the position and the orientation of the REST motif.
Analysis of Promoters and Exon–Intron Junctions.
As a definition of genes, we used protein-coding genes among the RefSeq genes. When there were multiple isoforms for the same gene, we used the isoform with the highest transcript level from the RNA-seq data. This yielded 20,195 genes. These genes were used to generate the averaged profiles. For the heat maps, we excluded the following genes. We excluded NM_030207 that encodes murine Sfi1 from our analysis because it had aberrantly high MPE-seq and MNase-seq coverages. We also excluded genes with zero RNA-seq reads, as such genes also generally had very low MPE-seq and MNase-seq coverages. This resulted in 16,800 genes in the heat map analyses.
Supplementary Material
Acknowledgments
We thank Zhen Ye and Samantha Kuan for assistance with DNA sequencing, George A. Kassavetis for advice on the use of MPE-Fe(II), and Tingting Du for RNA-seq data. We are grateful to Gary Hon, Siddarth Selvaraj, Bin Li, and Ulrich Wagner for advice and helpful discussions on data analysis. We also thank Andrea Local and George Kassavetis for critical reading of the manuscript. This work was supported by NIH Grant R01 GM058272 (to J.T.K.) and by the Ludwig Institute for Cancer Research.
Footnotes
The authors declare no conflict of interest.
This article is a PNAS Direct Submission.
Data deposition: The data reported in this paper have been deposited in the Gene Expression Omnibus (GEO) database, www.ncbi.nlm.nih.gov/geo (accession no. GSE69098).
This article contains supporting information online at www.pnas.org/lookup/suppl/doi:10.1073/pnas.1424804112/-/DCSupplemental.
References
- 1.Felsenfeld G. Chromatin as an essential part of the transcriptional mechanism. Nature. 1992;355(6357):219–224. doi: 10.1038/355219a0. [DOI] [PubMed] [Google Scholar]
- 2.Kornberg RD. Eukaryotic transcriptional control. Trends Cell Biol. 1999;9(12):M46–M49. [PubMed] [Google Scholar]
- 3.Struhl K, Segal E. Determinants of nucleosome positioning. Nat Struct Mol Biol. 2013;20(3):267–273. doi: 10.1038/nsmb.2506. [DOI] [PMC free article] [PubMed] [Google Scholar]
- 4.Hughes AL, Rando OJ. Mechanisms underlying nucleosome positioning in vivo. Annu Rev Biophys. 2014;43:41–63. doi: 10.1146/annurev-biophys-051013-023114. [DOI] [PubMed] [Google Scholar]
- 5.Noll M. Subunit structure of chromatin. Nature. 1974;251(5472):249–251. doi: 10.1038/251249a0. [DOI] [PubMed] [Google Scholar]
- 6.Yuan G-C, et al. Genome-scale identification of nucleosome positions in S. cerevisiae. Science. 2005;309(5734):626–630. doi: 10.1126/science.1112178. [DOI] [PubMed] [Google Scholar]
- 7.Schones DE, et al. Dynamic regulation of nucleosome positioning in the human genome. Cell. 2008;132(5):887–898. doi: 10.1016/j.cell.2008.02.022. [DOI] [PMC free article] [PubMed] [Google Scholar]
- 8.Mavrich TN, et al. Nucleosome organization in the Drosophila genome. Nature. 2008;453(7193):358–362. doi: 10.1038/nature06929. [DOI] [PMC free article] [PubMed] [Google Scholar]
- 9.Valouev A, et al. A high-resolution, nucleosome position map of C. elegans reveals a lack of universal sequence-dictated positioning. Genome Res. 2008;18(7):1051–1063. doi: 10.1101/gr.076463.108. [DOI] [PMC free article] [PubMed] [Google Scholar]
- 10.Valouev A, et al. Determinants of nucleosome organization in primary human cells. Nature. 2011;474(7352):516–520. doi: 10.1038/nature10002. [DOI] [PMC free article] [PubMed] [Google Scholar]
- 11.Gaffney DJ, et al. Controls of nucleosome positioning in the human genome. PLoS Genet. 2012;8(11):e1003036. doi: 10.1371/journal.pgen.1003036. [DOI] [PMC free article] [PubMed] [Google Scholar]
- 12.Teif VB, et al. Genome-wide nucleosome positioning during embryonic stem cell development. Nat Struct Mol Biol. 2012;19(11):1185–1192. doi: 10.1038/nsmb.2419. [DOI] [PubMed] [Google Scholar]
- 13.Li Z, et al. Foxa2 and H2A.Z mediate nucleosome depletion during embryonic stem cell differentiation. Cell. 2012;151(7):1608–1616. doi: 10.1016/j.cell.2012.11.018. [DOI] [PMC free article] [PubMed] [Google Scholar]
- 14.Carone BR, et al. High-resolution mapping of chromatin packaging in mouse embryonic stem cells and sperm. Dev Cell. 2014;30(1):11–22. doi: 10.1016/j.devcel.2014.05.024. [DOI] [PMC free article] [PubMed] [Google Scholar]
- 15.Hörz W, Altenburger W. Sequence specific cleavage of DNA by micrococcal nuclease. Nucleic Acids Res. 1981;9(12):2643–2658. doi: 10.1093/nar/9.12.2643. [DOI] [PMC free article] [PubMed] [Google Scholar]
- 16.Dingwall C, Lomonossoff GP, Laskey RA. High sequence specificity of micrococcal nuclease. Nucleic Acids Res. 1981;9(12):2659–2673. doi: 10.1093/nar/9.12.2659. [DOI] [PMC free article] [PubMed] [Google Scholar]
- 17.McGhee JD, Felsenfeld G. Another potential artifact in the study of nucleosome phasing by chromatin digestion with micrococcal nuclease. Cell. 1983;32(4):1205–1215. doi: 10.1016/0092-8674(83)90303-3. [DOI] [PubMed] [Google Scholar]
- 18.Chung H-R, et al. The effect of micrococcal nuclease digestion on nucleosome positioning data. PLoS ONE. 2010;5(12):e15754. doi: 10.1371/journal.pone.0015754. [DOI] [PMC free article] [PubMed] [Google Scholar]
- 19.Allan J, Fraser RM, Owen-Hughes T, Keszenman-Pereyra D. Micrococcal nuclease does not substantially bias nucleosome mapping. J Mol Biol. 2012;417(3):152–164. doi: 10.1016/j.jmb.2012.01.043. [DOI] [PMC free article] [PubMed] [Google Scholar]
- 20.Brogaard K, Xi L, Wang J-P, Widom J. A map of nucleosome positions in yeast at base-pair resolution. Nature. 2012;486(7404):496–501. doi: 10.1038/nature11142. [DOI] [PMC free article] [PubMed] [Google Scholar]
- 21.Kelly TK, et al. Genome-wide mapping of nucleosome positioning and DNA methylation within individual DNA molecules. Genome Res. 2012;22(12):2497–2506. doi: 10.1101/gr.143008.112. [DOI] [PMC free article] [PubMed] [Google Scholar]
- 22.Vierstra J, Wang H, John S, Sandstrom R, Stamatoyannopoulos JA. Coupling transcription factor occupancy to nucleosome architecture with DNase-FLASH. Nat Methods. 2014;11(1):66–72. doi: 10.1038/nmeth.2713. [DOI] [PubMed] [Google Scholar]
- 23.Lazarovici A, et al. Probing DNA shape and methylation state on a genomic scale with DNase I. Proc Natl Acad Sci USA. 2013;110(16):6376–6381. doi: 10.1073/pnas.1216822110. [DOI] [PMC free article] [PubMed] [Google Scholar]
- 24.Koohy H, Down TA, Hubbard TJ. Chromatin accessibility data sets show bias due to sequence specificity of the DNase I enzyme. PLoS ONE. 2013;8(7):e69853. doi: 10.1371/journal.pone.0069853. [DOI] [PMC free article] [PubMed] [Google Scholar]
- 25.Weintraub H, Groudine M. Chromosomal subunits in active genes have an altered conformation. Science. 1976;193(4256):848–856. doi: 10.1126/science.948749. [DOI] [PubMed] [Google Scholar]
- 26.Sabo PJ, et al. Discovery of functional noncoding elements by digital analysis of chromatin structure. Proc Natl Acad Sci USA. 2004;101(48):16837–16842. doi: 10.1073/pnas.0407387101. [DOI] [PMC free article] [PubMed] [Google Scholar]
- 27.Buenrostro JD, Giresi PG, Zaba LC, Chang HY, Greenleaf WJ. Transposition of native chromatin for fast and sensitive epigenomic profiling of open chromatin, DNA-binding proteins and nucleosome position. Nat Methods. 2013;10(12):1213–1218. doi: 10.1038/nmeth.2688. [DOI] [PMC free article] [PubMed] [Google Scholar]
- 28.Hertzberg RP, Dervan PB. Cleavage of double helical DNA by (methidium-propyl-EDTA) iron(II) J Am Chem Soc. 1982;104(1):313–315. [Google Scholar]
- 29.Van Dyke MW, Hertzberg RP, Dervan PB. Map of distamycin, netropsin, and actinomycin binding sites on heterogeneous DNA: DNA cleavage-inhibition patterns with methidiumpropyl-EDTA.Fe(II) Proc Natl Acad Sci USA. 1982;79(18):5470–5474. doi: 10.1073/pnas.79.18.5470. [DOI] [PMC free article] [PubMed] [Google Scholar]
- 30.Cartwright IL, Hertzberg RP, Dervan PB, Elgin SC. Cleavage of chromatin with methidiumpropyl-EDTA iron(II) Proc Natl Acad Sci USA. 1983;80(11):3213–3217. doi: 10.1073/pnas.80.11.3213. [DOI] [PMC free article] [PubMed] [Google Scholar]
- 31.Cartwright IL, Elgin SC. Chemical footprinting of 5S RNA chromatin in embryos of Drosophila melanogaster. EMBO J. 1984;3(13):3101–3108. doi: 10.1002/j.1460-2075.1984.tb02265.x. [DOI] [PMC free article] [PubMed] [Google Scholar]
- 32.Cartwright IL, Elgin SC. Nucleosomal instability and induction of new upstream protein-DNA associations accompany activation of four small heat shock protein genes in Drosophila melanogaster. Mol Cell Biol. 1986;6(3):779–791. doi: 10.1128/mcb.6.3.779. [DOI] [PMC free article] [PubMed] [Google Scholar]
- 33.Gottschling DE, Cech TR. Chromatin structure of the molecular ends of Oxytricha macronuclear DNA: Phased nucleosomes and a telomeric complex. Cell. 1984;38(2):501–510. doi: 10.1016/0092-8674(84)90505-1. [DOI] [PubMed] [Google Scholar]
- 34.Benezra R, Cantor CR, Axel R. Nucleosomes are phased along the mouse beta-major globin gene in erythroid and nonerythroid cells. Cell. 1986;44(5):697–704. doi: 10.1016/0092-8674(86)90835-4. [DOI] [PubMed] [Google Scholar]
- 35.Fedor MJ, Kornberg RD. Upstream activation sequence-dependent alteration of chromatin structure and transcription activation of the yeast GAL1-GAL10 genes. Mol Cell Biol. 1989;9(4):1721–1732. doi: 10.1128/mcb.9.4.1721. [DOI] [PMC free article] [PubMed] [Google Scholar]
- 36.Axel R. Cleavage of DNA in nuclei and chromatin with staphylococcal nuclease. Biochemistry. 1975;14(13):2921–2925. doi: 10.1021/bi00684a020. [DOI] [PubMed] [Google Scholar]
- 37.Cockell M, Rhodes D, Klug A. Location of the primary sites of micrococcal nuclease cleavage on the nucleosome core. J Mol Biol. 1983;170(2):423–446. doi: 10.1016/s0022-2836(83)80156-9. [DOI] [PubMed] [Google Scholar]
- 38.Henikoff JG, Belsky JA, Krassovsky K, MacAlpine DM, Henikoff S. Epigenome characterization at single base-pair resolution. Proc Natl Acad Sci USA. 2011;108(45):18318–18323. doi: 10.1073/pnas.1110731108. [DOI] [PMC free article] [PubMed] [Google Scholar]
- 39.Weiner A, Hughes A, Yassour M, Rando OJ, Friedman N. High-resolution nucleosome mapping reveals transcription-dependent promoter packaging. Genome Res. 2010;20(1):90–100. doi: 10.1101/gr.098509.109. [DOI] [PMC free article] [PubMed] [Google Scholar]
- 40.Xi Y, Yao J, Chen R, Li W, He X. Nucleosome fragility reveals novel functional states of chromatin and poises genes for activation. Genome Res. 2011;21(5):718–724. doi: 10.1101/gr.117101.110. [DOI] [PMC free article] [PubMed] [Google Scholar]
- 41.Jin C, et al. H3.3/H2A.Z double variant-containing nucleosomes mark ‘nucleosome-free regions’ of active promoters and other regulatory regions. Nat Genet. 2009;41(8):941–945. doi: 10.1038/ng.409. [DOI] [PMC free article] [PubMed] [Google Scholar]
- 42.Knight B, et al. Two distinct promoter architectures centered on dynamic nucleosomes control ribosomal protein gene transcription. Genes Dev. 2014;28(15):1695–1709. doi: 10.1101/gad.244434.114. [DOI] [PMC free article] [PubMed] [Google Scholar]
- 43.Torigoe SE, Patel A, Khuong MT, Bowman GD, Kadonaga JT. ATP-dependent chromatin assembly is functionally distinct from chromatin remodeling. eLife. 2013;2:e00863. doi: 10.7554/eLife.00863. [DOI] [PMC free article] [PubMed] [Google Scholar]
- 44.Schwartz S, Meshorer E, Ast G. Chromatin organization marks exon-intron structure. Nat Struct Mol Biol. 2009;16(9):990–995. doi: 10.1038/nsmb.1659. [DOI] [PubMed] [Google Scholar]
- 45.Tilgner H, et al. Nucleosome positioning as a determinant of exon recognition. Nat Struct Mol Biol. 2009;16(9):996–1001. doi: 10.1038/nsmb.1658. [DOI] [PubMed] [Google Scholar]
- 46.Andersson R, Enroth S, Rada-Iglesias A, Wadelius C, Komorowski J. Nucleosomes are well positioned in exons and carry characteristic histone modifications. Genome Res. 2009;19(10):1732–1741. doi: 10.1101/gr.092353.109. [DOI] [PMC free article] [PubMed] [Google Scholar]
- 47.Spies N, Nielsen CB, Padgett RA, Burge CB. Biased chromatin signatures around polyadenylation sites and exons. Mol Cell. 2009;36(2):245–254. doi: 10.1016/j.molcel.2009.10.008. [DOI] [PMC free article] [PubMed] [Google Scholar]
- 48.Fu Y, Sinha M, Peterson CL, Weng Z. The insulator binding protein CTCF positions 20 nucleosomes around its binding sites across the human genome. PLoS Genet. 2008;4(7):e1000138. doi: 10.1371/journal.pgen.1000138. [DOI] [PMC free article] [PubMed] [Google Scholar]
- 49.Oyola SO, et al. Optimizing Illumina next-generation sequencing library preparation for extremely AT-biased genomes. BMC Genomics. 2012;13:1. doi: 10.1186/1471-2164-13-1. [DOI] [PMC free article] [PubMed] [Google Scholar]
- 50.Jin C, Felsenfeld G. Nucleosome stability mediated by histone variants H3.3 and H2A.Z. Genes Dev. 2007;21(12):1519–1529. doi: 10.1101/gad.1547707. [DOI] [PMC free article] [PubMed] [Google Scholar]
- 51.Langmead B, Trapnell C, Pop M, Salzberg SL. Ultrafast and memory-efficient alignment of short DNA sequences to the human genome. Genome Biol. 2009;10(3):R25. doi: 10.1186/gb-2009-10-3-r25. [DOI] [PMC free article] [PubMed] [Google Scholar]
- 52.Leung D, et al. Regulation of DNA methylation turnover at LTR retrotransposons and imprinted loci by the histone methyltransferase Setdb1. Proc Natl Acad Sci USA. 2014;111(18):6690–6695. doi: 10.1073/pnas.1322273111. [DOI] [PMC free article] [PubMed] [Google Scholar]
- 53.Trapnell C, et al. Transcript assembly and quantification by RNA-Seq reveals unannotated transcripts and isoform switching during cell differentiation. Nat Biotechnol. 2010;28(5):511–515. doi: 10.1038/nbt.1621. [DOI] [PMC free article] [PubMed] [Google Scholar]
- 54.Shen Y, et al. A map of the cis-regulatory sequences in the mouse genome. Nature. 2012;488(7409):116–120. doi: 10.1038/nature11243. [DOI] [PMC free article] [PubMed] [Google Scholar]
- 55.Heinz S, et al. Simple combinations of lineage-determining transcription factors prime cis-regulatory elements required for macrophage and B cell identities. Mol Cell. 2010;38(4):576–589. doi: 10.1016/j.molcel.2010.05.004. [DOI] [PMC free article] [PubMed] [Google Scholar]
- 56.Yu H-B, Johnson R, Kunarso G, Stanton LW. Coassembly of REST and its cofactors at sites of gene repression in embryonic stem cells. Genome Res. 2011;21(8):1284–1293. doi: 10.1101/gr.114488.110. [DOI] [PMC free article] [PubMed] [Google Scholar]