Significance
In vertebrates, the transmembrane protein Smoothened (Smo) accumulates in the ciliary membrane when cells receive the Hedgehog (Hh) signal. The presence of Smo in primary cilia at baseline conditions has been postulated, but not directly observed. We used highly sensitive single-molecule imaging in live cells to track and analyze the dynamics of individual Smo molecules in cilia, not only after treatment with pathway agonists but also at low, baseline levels. In both conditions, Smo molecules bind at distinct sites at the bases of cilia, but with different dissociation constants. The results provide mechanistic insight into the Hh signal transduction and highlight the distinct compartmentalization of Smo behavior within cilia, which is normally masked by the bulk distribution in ensemble measurements.
Keywords: Hedgehog signaling, primary cilia, Smoothened, single-molecule microscopy, single-particle tracking
Abstract
Accumulation of the signaling protein Smoothened (Smo) in the membrane of primary cilia is an essential step in Hedgehog (Hh) signal transduction, yet the molecular mechanisms of Smo movement and localization are poorly understood. Using ultrasensitive single-molecule tracking with high spatial/temporal precision (30 nm/10 ms), we discovered that binding events disrupt the primarily diffusive movement of Smo in cilia at an array of sites near the base. The affinity of Smo for these binding sites was modulated by the Hh pathway activation state. Activation, by either a ligand or genetic loss of the negatively acting Hh receptor Patched-1 (Ptch), reduced the affinity and frequency of Smo binding at the base. Our findings quantify activation-dependent changes in Smo dynamics in cilia and highlight a previously unknown step in Hh pathway activation.
The Hedgehog (Hh) signaling pathway is essential for embryonic development of many tissues and organs, and for adult stem cell proliferation and differentiation (1, 2). Malfunctions in the pathway lead to birth defects or cancer (3, 4). Crucial for reception and transduction of the Hh signal are primary cilia—tiny, antenna-like organelles present in many cell types. Mutations that affect cilia structure often lead to phenotypes consistent with aberrant Hh signaling (5–7), but the molecular interactions of Hh transduction proteins within cilia are still poorly understood.
Proteins of the Hh pathway localize to primary cilia in a tightly controlled and activation-dependent fashion. The Hh receptor Patched-1 (Ptch), when not bound to its ligand, localizes in and around the cilium, and inhibits pathway activation (8). Inactivation of Ptch, either by genetic elimination or by binding of the Hh ligands, results in the accumulation of the protein Smoothened (Smo) in the ciliary membrane (9). Active Smo in cilia promotes simultaneous accumulation of Gli transcription factors and Suppressor of Fused (SuFu) at the tip of the cilium, where Gli proteins need to be fully activated before exiting cilia and entering the nucleus to regulate target-gene transcription (10).
Smo is a 7-pass transmembrane (7TM) protein classified as class Frizzled G protein-coupled receptor (11). Like other G protein-coupled receptors (GPCRs), Smo is thought to take multiple conformations. An endogenous ligand for Smo has not been discovered, but several small-molecule ligands, routinely used to study Hh signaling, bind Smo and stabilize it in an active or inactive conformation (12, 13). The accumulation of Smo in cilia seems to be necessary, but not sufficient for downstream activation, because both active and inactive conformations of Smo have been found to localize in cilia (14). The activation step is likely regulated by Ptch (14), but the underlying molecular mechanisms remain elusive.
The importance of precise compartmentalization in cilia for transmission of the Hh signal has been recently demonstrated (15), although it has not been possible to observe any differences in the distribution of Smo within cilia by standard microscopy and immunostaining. Activated Smo, accumulated in cilia after pathway activation, interacts with the Evc2 protein, part of the EvC protein complex localized at a microdomain at the base of cilia, just distal to the transition zone, which forms a diffusion barrier between the ciliary membrane and the plasma membrane (15). Mislocalization of this complex leads to impaired Hh signaling. The interaction of Smo with Evc2 was detected only when Hh signaling was activated (15). Direct protein interactions of inactive Smo have not yet been reported.
Single-molecule imaging separates the behavior of individual proteins from the ensemble average, revealing underlying molecular states and physical behaviors (16–20). Using single-molecule imaging and analysis of instantaneous velocity distributions, it was recently shown that somatostatin receptor 3 (SSTR3) molecules in the cilia membrane predominantly travel by diffusion, with a component of transient directional movement (21); similar results were reported for overexpressed Smo. However, how Smo movements change as Hh pathway activity is manipulated, in baseline and activated conditions, is still not addressed.
The directional transport of ciliary components, either for cilia growth between cell cycles, or to localize a variety of transduction molecules, is carried out by the intraflagellar transport (IFT) machinery. Damage to IFT-mediated transport often leads to loss of cilia and altered Hh signal transduction (22, 23), but it is difficult to distinguish whether IFT proteins only function to build a structure that is a favorable environment for the Hh pathway or play a more direct role in moving Hh transducers. One clue that IFT function may be directly required for signal transduction comes from IFT25 mutant cells. In those cells, cilia formation is not disrupted, but Hh signaling is aberrant: both Smo and Ptch are enriched in cilia in the absence of any agonist, but Hh-target gene transcription is poorly inducible (24).
Here, we present our study of Smo movement in cilia using highly sensitive single-molecule tracking in live cells under conditions when the Hh pathway is either “on” or “off.” Our detailed analysis of trajectories shows three distinct modes of motion of Smo in cilia: diffusion, rare directional movement, and, surprisingly, frequent periods of confinement/binding. In the presence of pathway agonists, or in the absence of Ptch, the affinity of Smo binding to an array of binding sites at the cilium base is reduced. The results reveal molecular interactions of inactive Smo with binding partners at the base of cilia that can be modified by Hh pathway activation.
Results
Smoothened in Primary Cilia Moves Predominantly by Diffusion.
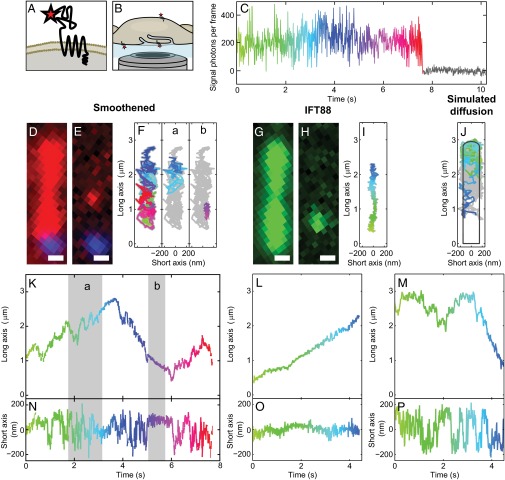
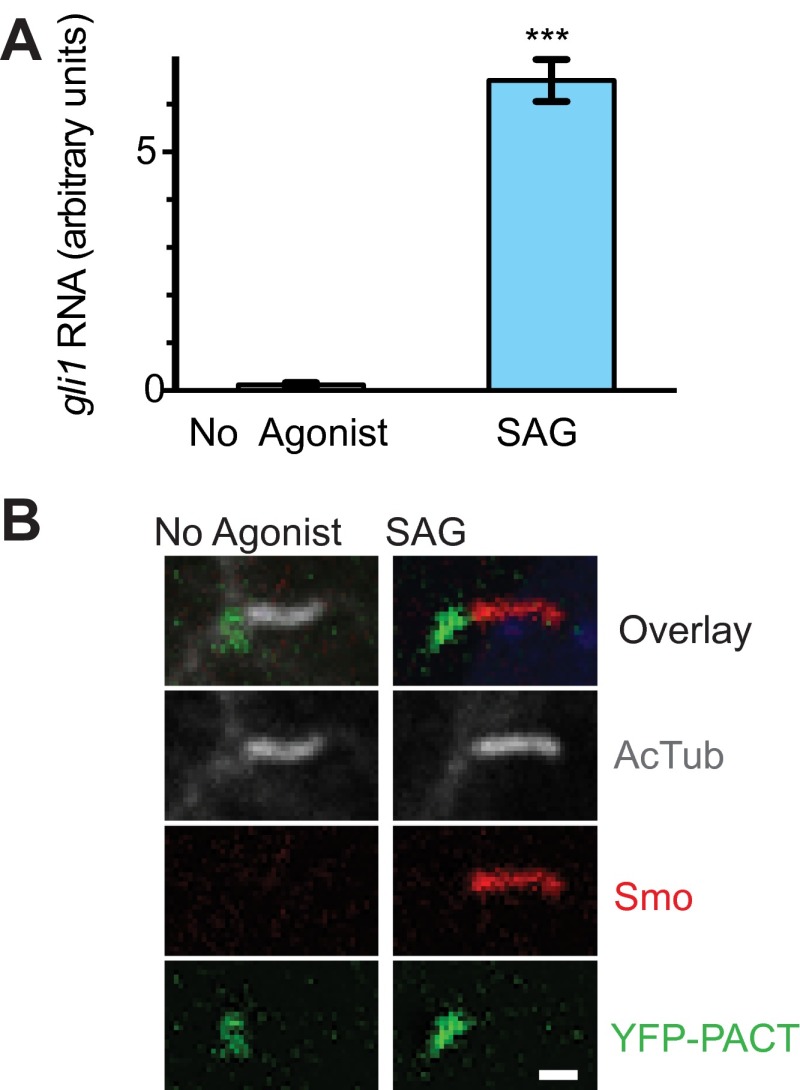
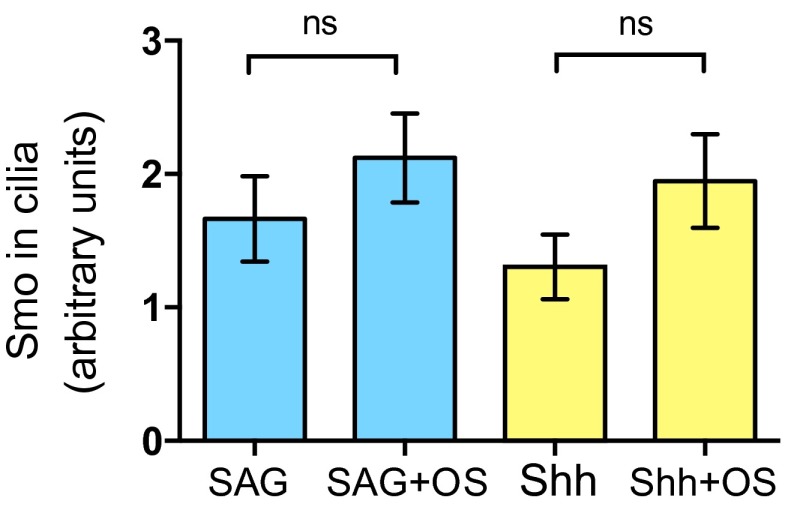
To achieve sufficient sensitivity for detecting and tracking single Smo molecules, we fused a SNAP-tag to the extracellular N terminus of Smo (Fig. 1A) and stably expressed the protein at modest levels in smo−/− mouse embryonic fibroblasts (MEFs), as previously described (25). The SNAP-tag catalyzes the attachment of a single organic fluorophore for imaging (26). To distinguish the bases from the tips of cilia in live cells, we stably expressed YFP fused to a centrosome-targeting motif of pericentrin (YFP-PACT) (27). The isolated stable lines of cells had normal Hh responsiveness when assayed for gli1 target gene expression and Smo protein localization (Fig. S1). When cultured in low serum, MEFs grow cilia on either their upper or lower (coverslip) side. The cilia on the lower side were preferable for imaging, because they were parallel to the glass slide and immobilized (Fig. 1B). We recorded fluorescence movies of one cilium at a time for several minutes with 10-ms frames, where single molecules were identified by a single photobleaching step (Fig. 1C). To obtain long tracks of single molecules, photobleaching was reduced by adding oxygen scavengers to the cell media for up to 1 h during imaging experiments (28), and this did not significantly affect Smo accumulation in cilia induced by Hh agonists (Fig. S2). To track the paths of single molecules, the position of the fluorescent emitter was determined by fitting a symmetric 2D Gaussian function plus a constant (to account for background) to the pixel intensities of a 9 × 9 pixel region of each frame. We typically achieved localization precisions of ∼30–35 nm, 10× finer than the diffraction-limited spot size of a fluorophore on the detector, allowing precise analysis of spatial trajectories along both the long and short axes of the cilium for up to 60 s (SI Materials and Methods and Figs. 1 and 2).
Fig. 1.
Smo moves predominantly by diffusion in primary cilia. (A) The N-terminal SNAP-tag enables covalent attachment of a single fluorophore on the extracellular domain of Smo. (B) Illustration of inverted microscope imaging geometry. (C) Detected signal photons per frame from a single spot (example frame shown in Fig. 1E) exhibit a single photobleaching step, which is characteristic of a single-molecule emitter. (D) The high density of Smo (red) revealed the cilium in SAG-treated cells, with basal body marker (blue). (E) After ∼30 s of exposure, photobleaching leaves well-separated single molecules. (F) A trajectory of single Smo exploring both the long and short axes (K and N, respectively), color-coded for time (same scale as K–P). Two subtrajectories (a and b) correspond to the highlighted regions in K and N, and illustrate diffusive and directional movement, respectively. (G) The YFP-tagged intraflagellar transport protein 88 (IFT88-YFP) localizes to cilia. (H) Photobleaching provides well-separated molecules for tracking. (I) IFT88-YFP moved processively along the long axis (L) while being restricted along the short axis (O), similar to Smo in the highlighted region (b). (J) Simulations of diffusing particles in a cilium-shaped object were similar to the majority of the Smo movements. (K–M) The position along the long axis of the trajectories shown in F, I, and J, plotted over time. (N–P) Position along the short axis plotted in time. (Scale bars: 500 nm.)
Fig. S1.
The newly generated smo−/−;SNAP-Smo;YFP-PACT cell line has normal responses to SAG stimulation. (A) Quantitative real-time PCR shows increased levels of gli1 RNA after 24 h of SAG treatment. Data are presented as mean ± SEM; ***P < 0.001. (B) By immunofluorescent staining, Smo is not detectable in cilia of unstimulated cells (no agonist), but accumulates in cilia after 3 h of SAG treatment. Cilia are marked by acetylated tubulin staining and YFP-PACT marks cilia base. (Scale bar: 1 μm.)
Fig. S2.
The agonist-induced accumulation of Smo in cilia did not significantly change in the presence of oxygen scavengers in the media. After 2 h of treatment with SAG or Shh, oxygen scavengers were added, or not, to the media and cells were incubated for an additional hour. Levels of Smo in cilia were quantified by analysis of confocal microscopy images of fixed, immunostained cells. Data are presented as mean ± SEM.
Fig. 2.
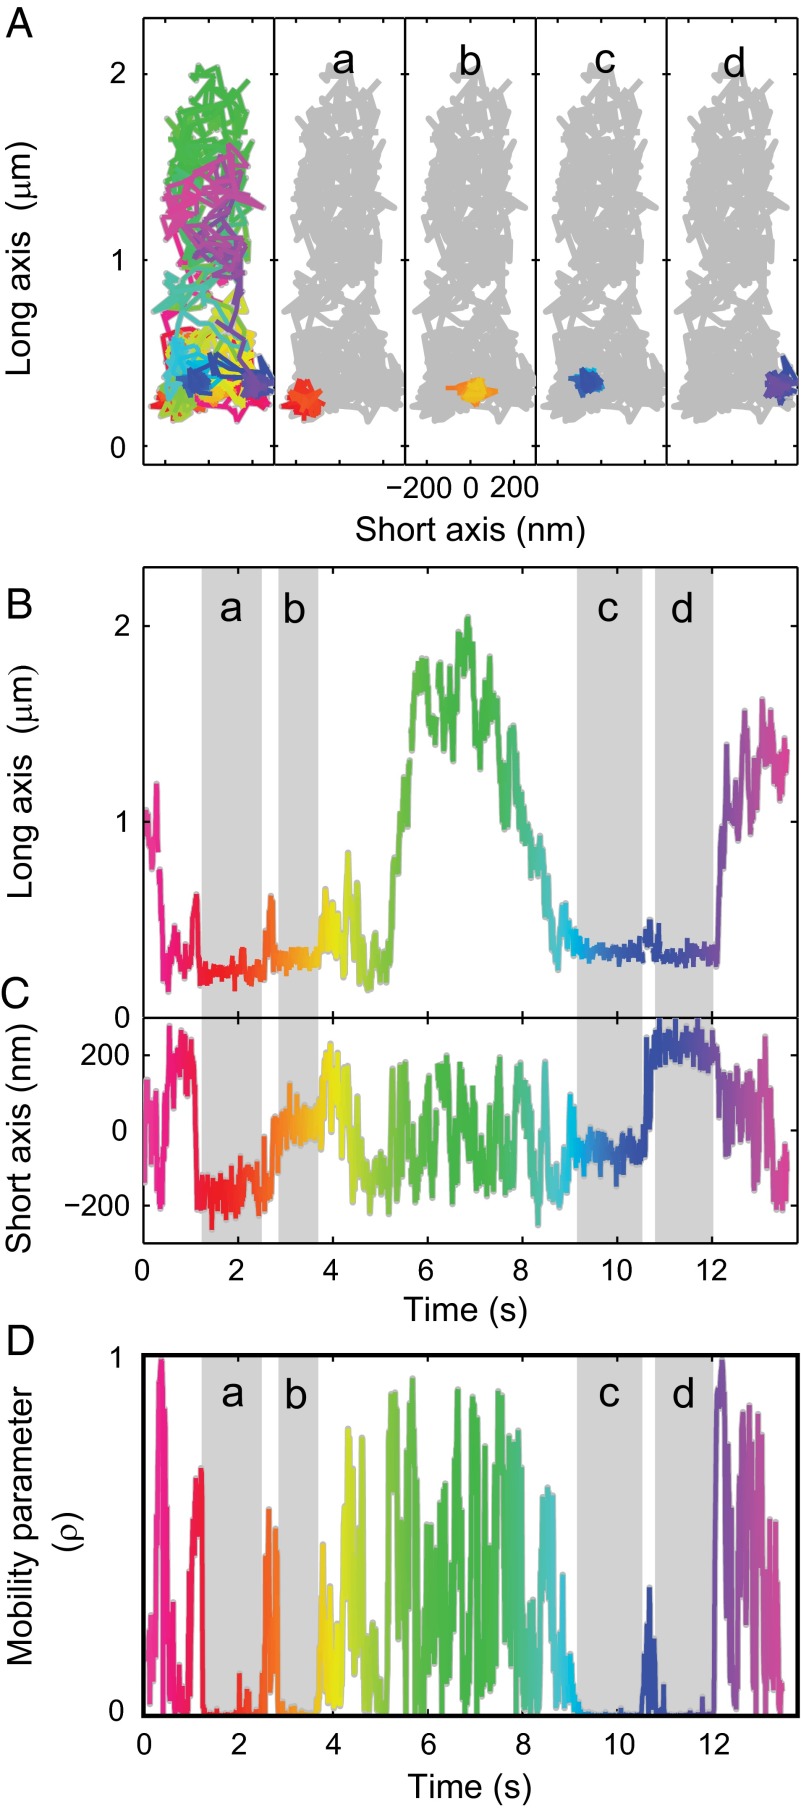
In the absence of agonist, Smo frequently binds at distinct sites at the base of the cilium. (A) The recorded trajectory is consistent with the cilium size and outline (color scale shows time progression, same scale as B–D). During the trajectory, prolonged confinements near the base of the cilium were observed (a–d). (B and C) During confinements, Smo remained stationary along both ciliary axes. (D) The confinement periods were determined by calculating the mobility parameter (ρ) (SI Materials and Methods). Highlighted regions indicate confinement.
In cells treated with Smoothened agonist (SAG) (13), cilia were easily detectable because labeled Smo covered the entire organelle (Fig. 1D). After initial bleaching of excess labeled molecules, single molecules were spatially well-separated and tracked (Fig. 1 D and E and Movie S1). Our trajectory analysis showed that diffusion was the predominant mode of motion of Smo (D = 0.26 ± 0.03 μm2/s), consistent with an earlier report (21). Due to the small size of cilia, our data indicate that it takes only several seconds for diffusing Smo molecules to traverse the entire length. A typical subtrajectory (20 × 10 ms) is highlighted in Fig. 1F, a.
Diffusion along linear structures, such as cilia, occasionally leads to periods of successive movement in the same direction that may appear as directed motion. To confirm that a truly diffusive particle would recapitulate the types of trajectories we observed, we simulated a diffusing particle on the surface of a cilium-shaped 3D object (SI Materials and Methods). An example of a simulated trajectory is shown in Fig. 1 J, M, and P. The period of apparent directed motion along the long axis at the end of the trajectory (Fig. 1M) is actually inconsistent with directed processive movement because of the random lateral motion shown in the corresponding short axis graph (Fig. 1P). Diffusive simulations and measurements of Smo largely agreed, but in a few trajectories we observed directed motion, i.e., short periods of Smo processive movement along the long axis (Fig. 1K, b), while the position along the short axis was confined (Fig. 1N, b). Both retrograde (shown in Fig. 1F, b) and anterograde directional trafficking was detected. Although present in less than 1% of total trajectory time (0.5% anterograde, 0.3% retrograde), the duration and number of occurrences of these events were beyond what could be explained by pure diffusion. This pattern of movement, not observed in simulated diffusion tracks, is consistent with occasional directional, motor-driven transport.
To further contrast movements of Smo to IFT motion, we measured IFT88, one of the components of the anterograde IFT-B complex. Unlike Smo, which only rarely exhibited short periods of processive movement, YFP-tagged IFT88 stably expressed in IMCD3 cells (29) showed only directional, processive motion that traversed most of the cilium length (Fig. 1 G–I and Movie S2). The difference was not due to cell type, because Smo in IMCD3 cells and MEFs behaved similarly (Fig. S3). The observed average velocities for processive movement of Smo and IFT88 along the long axis of the cilium were ∼400–500 nm/s (Fig. 1K, b for Smo; Fig. 1L for IFT88), consistent with previous reports for IFT (200–800 nm/s) (30). For both proteins, periods of directed longitudinal motion were corroborated by the simultaneous confinement of the lateral short axis motions to <200 nm (Fig. 1 N, b, and O). We conclude that Smo only rarely (i.e., portions of 1% of the trajectories) and transiently associated with the IFT apparatus, in contrast to the ∼32–34% fraction of directed motion reported earlier (21).
Fig. S3.
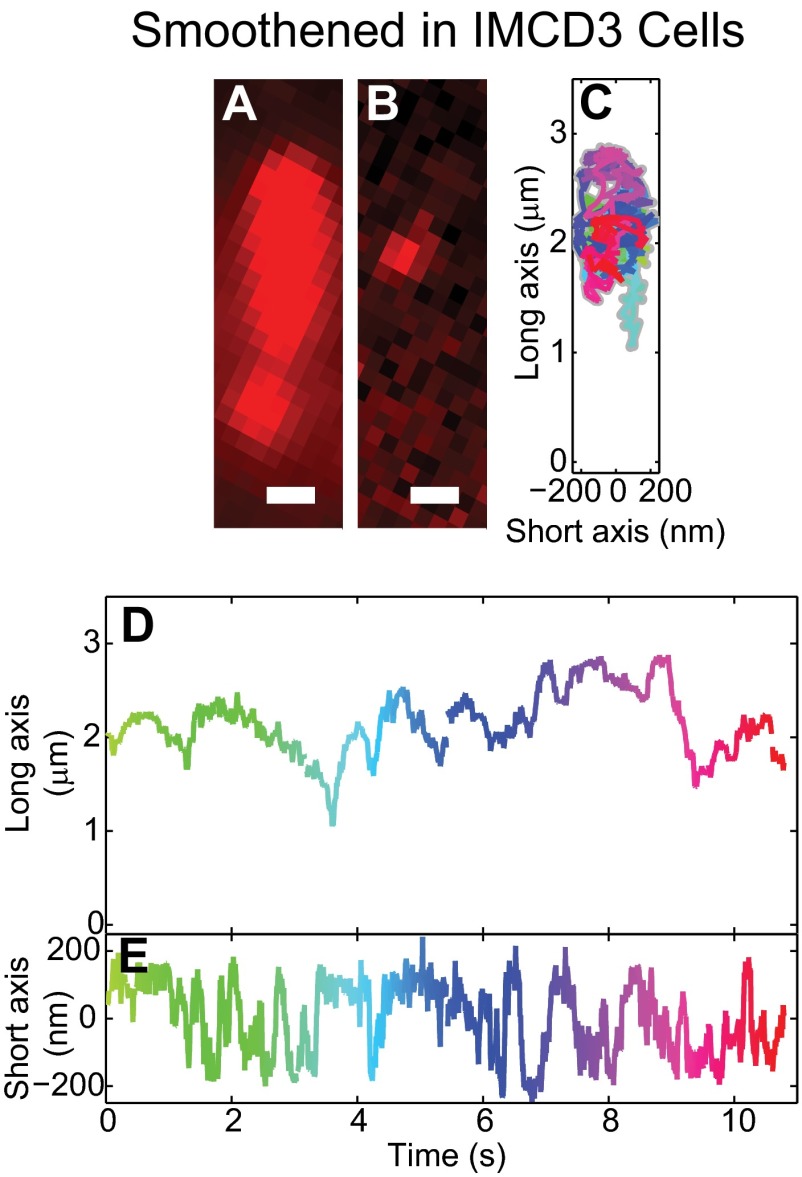
Smoothened predominantly diffusive dynamics in IMCD3 cells are similar to MEF cells. (A) Average image of labeled SNAP-Smo in an IMCD3 cell using transient transfection. (B) After bleaching excess molecules, single Smo were well separated and could be tracked. (C) Similar to MEF cells, Smo molecules in IMCD3 cells explored the cilium. An example trajectory is shown, color codes for time. (D and E) For the trajectory in C, motion along the long and short axes of the cilium was consistent with a largely diffusive behavior. (Scale bars: 500 nm.)
In the Absence of Agonist, Smo Is Present at Low Levels in Cilia and Frequently Binds at Distinct Sites at the Base.
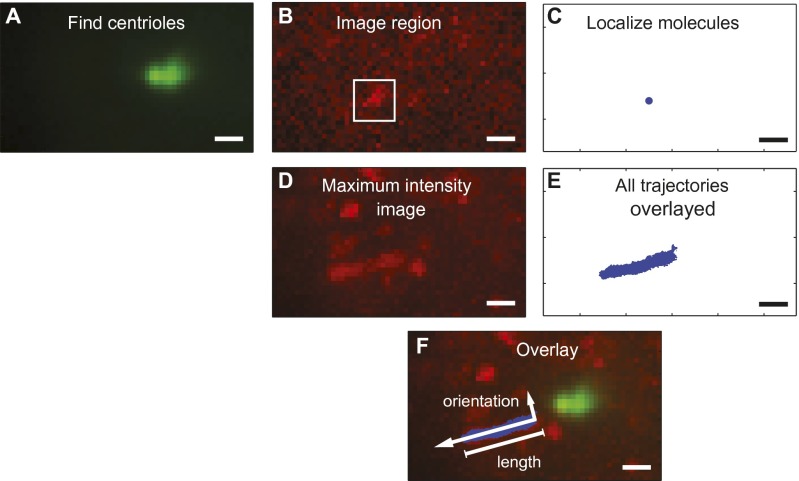
In cells that have not been exposed to Hh or other agonists of the pathway, Smo is not readily detectable in cilia using conventional microscopy methods, but genetic experiments have indicated it may be present at low levels (23). The single-molecule sensitivity of our microscope enabled confirmation of that hypothesis by direct detection and characterization of cilia-localized Smo molecules in the absence of agonist (protocol illustrated in Fig. S4). In stark contrast to the primarily diffusive trajectories of Smo in agonist-stimulated cells, the trajectories of Smo in unstimulated cells revealed that movement was frequently interrupted by subsecond confinements (Fig. 2 and Movie S3). In one striking case, we found four separate confinement events at the same location along the long axis with different positions along the short axis (Fig. 2A, a–d, highlighted in Fig. 2 B and C). These interruptions are fundamental shifts in dynamics, not a coincidental series of small diffusive steps, as determined by a mobility parameter (ρ) that statistically examines a sliding window of positions and compares the motion to the diffusion null hypothesis (31, 32) (Fig. 2D and SI Materials and Methods). The distribution of measured positions was the same for Smo during confinements and for immobilized bead emitters (with similar signal and background levels; Figs. S5 and S6), consistent with the proposal that Smo is stationary during the confinement events. Therefore, the observed confinements likely represent Smo binding to static molecular complexes.
Fig. S4.
Cilia can be identified in no-agonist conditions by proximity to basal markers followed by use of the maximum intensity projection and recorded trajectories to determine length and orientation. (A) Fluorescence from YFP-PACT labeled the centrioles at the base of the cilium and was used to identify regions where cilia were expected. (B) Fields of view were imaged in the Smo-SNAP channel near the centrioles; these contained low densities of molecules, such as the boxed region. (C) Result of localization fitting algorithm applied to the boxed region in B. (D) The projection of the maximum intensity values of pixels during a Smo-SNAP movie was used to locate prospective cilia. (E) All potential trajectories recorded in regions near each centriole were examined to see if they were consistent in size and proximity with motion in a cilium. (F) Using the maximum intensity image and the trajectories along with the proximity of the centrioles, we classified trajectories as arising from cilia-localized Smo. The orientation was determined by the trajectory positions relative to the basal marker, and the length was determined from the maximum intensity image. (Scale bars: 1 μm.)
Fig. S5.
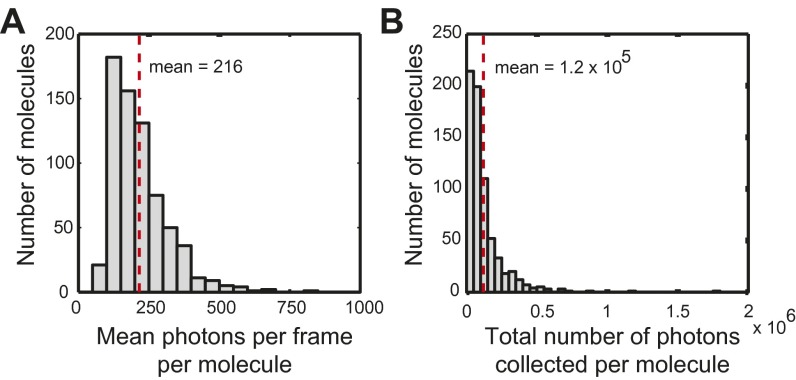
On average, ∼220 signal photons were detected above background per localization, with ∼120,000 photons per molecule. (A) The number of signal photons per localization was averaged for each molecule and grouped into bins of 50 photons; frames for which no molecules were localized were excluded. The dashed red vertical line shows the mean value. (B) The total number of collected photons for each molecule grouped into bins of 50,000 photons. The dashed vertical line represents the mean.
Fig. S6.
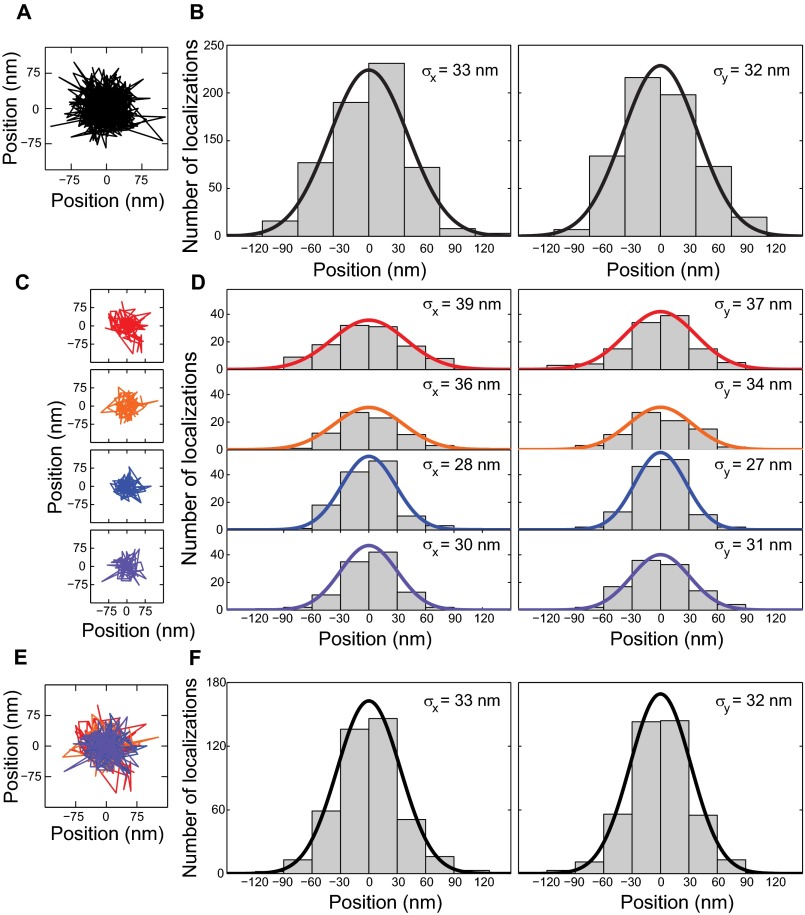
Localization precision of fixed beads and single molecules in putative binding regions was less than 35 nm. (A) Localizations of a fixed bead were imaged under experiment-matched conditions, i.e., camera settings, mean signal photons, and background level (Materials and Methods). (B) Positions were grouped in 30-nm bins along the x and y axes to show the distribution of measured positions. The SD of the position is listed in the upper right and represents the localization error of the measurement, 33/32 nm in x/y, respectively. (C) The localizations of single Smo molecules during binding events shown in Fig. 2. (D) Positions were binned as in B. The SD of the position was determined to be 27–39 nm. Variation in the calculated localization precision is largely due to varying photons collected in each frame, the position of the molecule in z relative to the focal plane and background fluctuations caused by out-of-focus and nearby molecules. (E) The four trajectories in C were combined by subtracting their mean position. (F) The combined distribution of positions is well-described by a Gaussian function with SD equal to 33 and 32 nm in x and y, respectively.
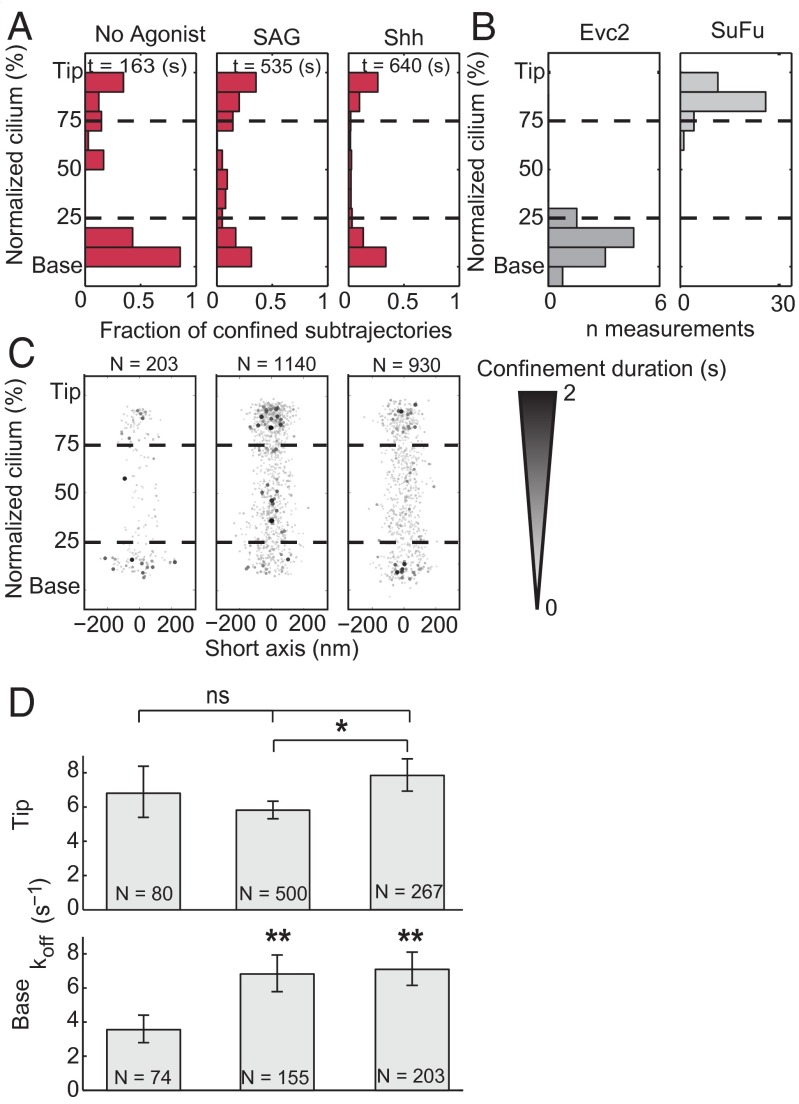
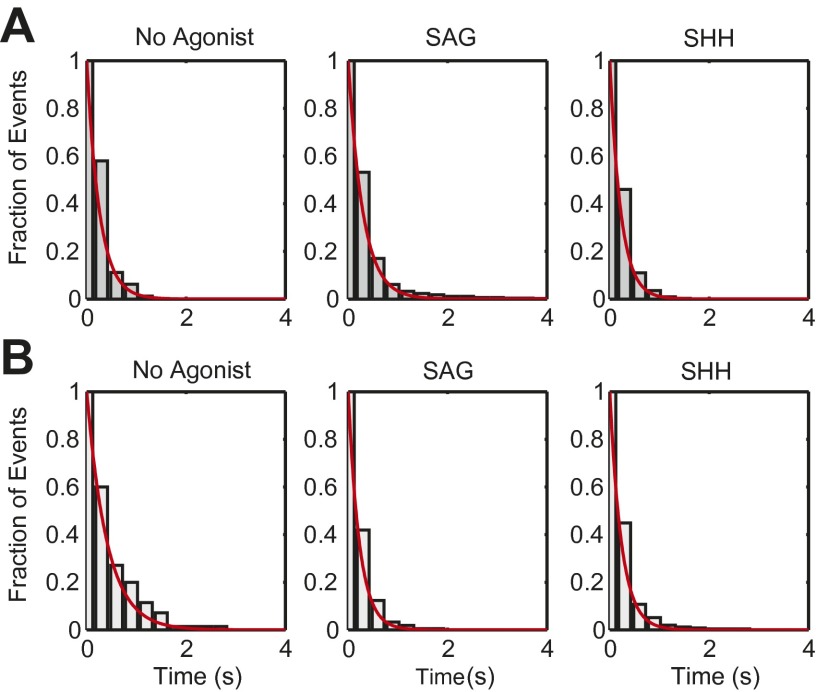
To calculate the fraction of time spent bound in each proximal to distal segment of the cilia, trajectories were split into 200-ms subtrajectories, statistically categorized as bound or unbound, and binned by their mean position along a normalized cilium axis (Fig. 3A). To determine the durations of binding events, we calculated the mobility parameter for each trajectory (example in Fig. 2D and SI Materials and Methods), and measured the length of time periods below the confinement threshold, i.e., mobility parameter <0.036 (Fig. 3C, Fig. S7, and Dataset S1). Observed binding events were on the order of hundreds of milliseconds. Applying the same analysis to Smo trajectories from agonist-activated cells also revealed the presence of some binding events, albeit less frequent. Of 31.4 s of Smo trajectories recorded at the base of unstimulated cells, 12.4 s were determined as confined (39.5%), whereas in SAG-induced cells, of 60.0 s only 7.4 s were confined (12.3%).
Fig. 3.
Agonists cause faster dissociation of Smo from the base of the cilium. Subtrajectories of 20 frames (200 ms) were sorted per cilia–axis bin (10 bins) based on their average position along the normalized long axis of cilia, and classified as confined or unconfined. (A) The graph represents fraction of confined events, relative to the total number of subtrajectories for each bin. t, total seconds of observation. (B) The distribution of two ciliary components, Evc2 and SuFu, relative to the long axis of cilia, as determined by Smo localization, and plotted using the same normalization method. (C) Individual confinement events were plotted with a darkness value and size proportional to the confinement duration; N, number of binding events that were identified. (D) The dissociation rate constant (koff) was calculated for either the top or bottom 25% of the normalized cilia. N, number of events measured in each condition. Error bars are the 95% confidence of the fit parameter. *P < 0.05; **P < 0.01.
Fig. S7.
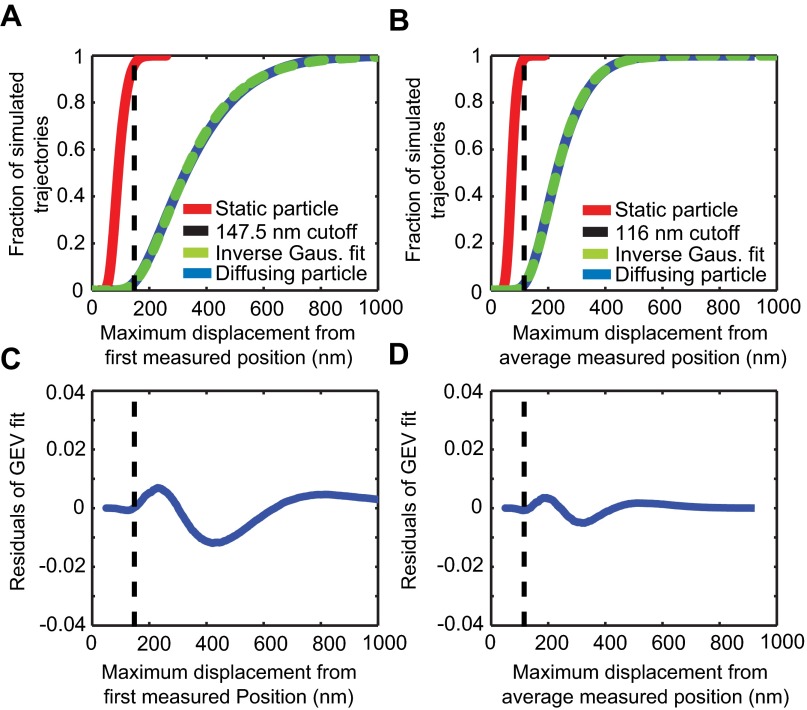
Diffusing molecules can be readily distinguished from bound molecules in the presence of localization error of ∼35 nm. (A) The 200-ms simulations of static (red) or diffusing (blue) particles with 35-nm localization error were analyzed to find their maximum displacement from the initial position. The cumulative distribution function of diffusing particles was empirically found to be well-described by an inverse Gaussian cumulative function (green dashed line). A threshold for particles to be classified as unconfined was then set at 147.5 nm (vertical black dashed line), which corresponds to ∼3.6% of simulated static molecules being falsely classified as unconfined and ∼3.6% of diffusing particles being falsely categorized as confined. (B) Same as in A, except that the maximum displacement from the mean position was used. Because this metric was used to determine the duration of the confinements, the cutoff threshold (116 nm) was chosen to slightly favor confinement with 1.3% of static particles being classified as unconfined and 2.6% of diffusing particles being classified as confined. (C and D) Residuals of the inverse Gaussian fits to the simulated trajectories in A and B, respectively; vertical dashed lines indicate the confinement thresholds.
Agonists or Loss of Function of Ptch Cause Faster Dissociation of Smo from the Base of the Cilium.
We compared the distribution, frequency, and duration of Smo confinement events along the length of cilia for agonist-activated and control Smo conditions (Fig. 3). In the absence of Hh pathway agonists, confinements most frequently took place at distinct locations near the bases of cilia (Fig. 2), although they were also detected at other locations along cilia—in particular, at the tips (Fig. 3 A and C). To contextualize the location of these binding events, we compared them with the localization of Evc2, which resides in a region of cilia near the base (15), and with SuFu, which marks the tips of cilia (10). Evc2-YFP was expressed in SNAP-Smo cells and the bulk localization of multiple proteins displayed as a distribution relative to the normalized cilia length (Fig. 3B). The localization of Smo confinements at the base of cilia roughly corresponded to the position of Evc2-YFP proteins (Fig. 3B). To mark the tips of cilia, we expressed SuFu-Turquoise in SNAP-Smo cells. Smo binding events at the tips of cilia correlated with SuFu location (10), possibly indicating an interaction with downstream pathway components at the tip.
A striking change in confinement occurred in response to Hh pathway activation. The fraction of confined subtrajectories (Fig. 3A) and the duration of Smo confinement events (Fig. 3C) near the bases of cilia decreased significantly in the presence of SAG, which directly binds Smo (13), or in the presence of Sonic hedgehog (Shh), which, by binding and inactivating Ptch, unleashes Smo (8). For binding at the tip, no significant changes were observed in agonist-treated cells, relative to the no-agonist control, although we did observe a slight increase in the duration of binding at the tips of SAG treated cells (Fig. 3C). The dissociation constant (koff), calculated by fitting a single exponential decay function to the distribution of measured confinement durations, increased approximately twofold at the bases of cilia of agonist-treated cells, compared with unstimulated cells (Fig. 3D). Therefore, the affinity of Smo binding at the base of cilia is reduced in agonist-treated cells.
Ptch Regulates the Affinity of Smo Binding at the Bases of Cilia.
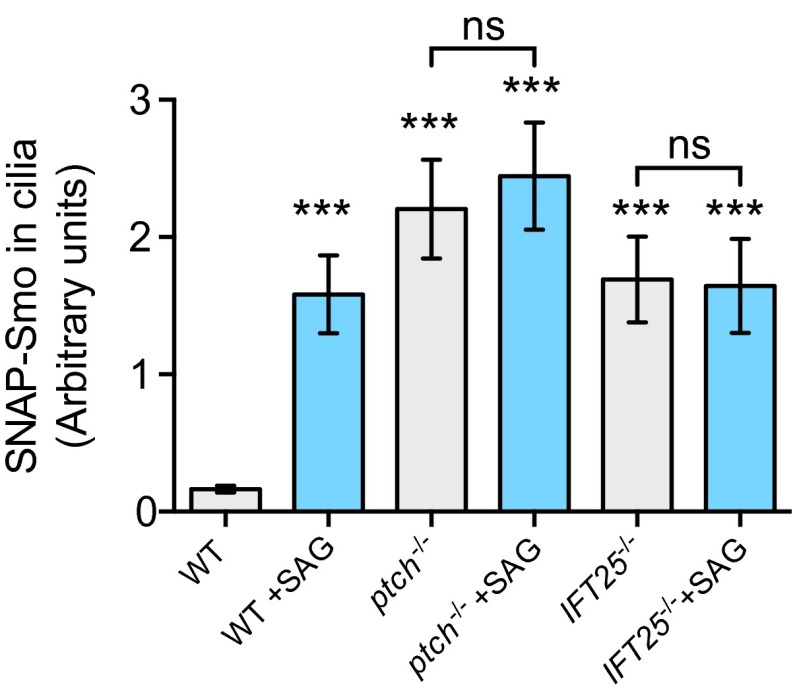
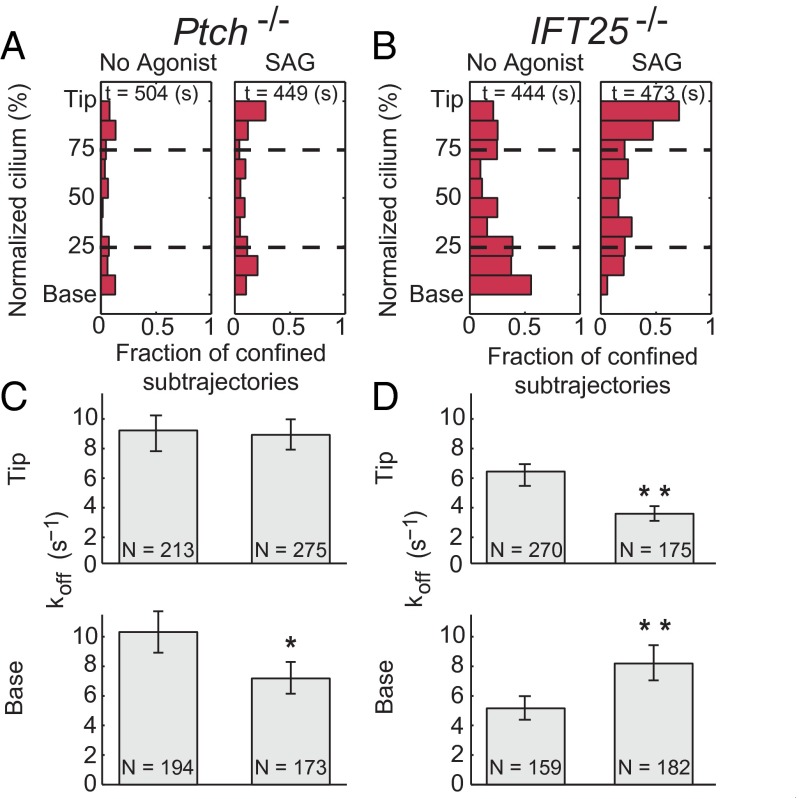
The Hh receptor Ptch plays an essential role in suppressing Smo activity and Smo accumulation in cilia (8), but the underlying mechanism remains unknown. To assess whether Ptch affects binding of Smo in cilia, we generated ptch−/− cells stably expressing snap-smo and yfp-pact (Fig. S8). In those cells, where Smo accumulated in cilia in the absence of agonist, we observed a significant decrease in the number and duration of binding events (Fig. 4 A and C). To determine whether the measured changes in binding were due to the activation of Smo or to its increased concentration in cilia, we analyzed Smo trajectories in cilia of ift25−/− cells stably expressing snap-smo and yfp-pact. Unlike ptch−/− cells, where Smo accumulates and activates target gene transcription, in ift25−/− cells Smo accumulation in cilia is ineffective in driving target gene transcription (24). The binding distribution and kinetics of Smo in ift25−/− cells closely resembled those obtained for unstimulated MEFs (Figs. 3A and 4B). (As a side point, the similarity of these two conditions supports the contention that the photobleaching required to reach single-molecule levels did not disturb the behavior.) The addition of SAG, which did not induce further accumulation of SNAP-Smo in cilia of ift25−/− cells (Fig. S8), modified its binding characteristics at the bases of the cilia, a change similar to what occurred in SAG-treated MEFs. These results indicate that Ptch controls Smo by regulating the kinetics of Smo binding at the ciliary base.
Fig. S8.
Smo levels in cilia are increased in both ptch−/− and IFT25−/− cells. Levels of Smo accumulated in cilia of either ptch−/− or IFT25−/− cells are similar to those seen in SAG-treated wild-type cells, and could not be further increased by addition of SAG. Levels of SNAP-Smo in cilia were quantified by confocal microscopy of fixed, immunostained cells after treatment with SAG for 24 h. Data are presented as mean ± SEM. ***P < 0.001.
Fig. 4.
In ptch−/− cells, Smo binding at the base is significantly decreased, compared with cells wild-type for ptch. (A and B) ptch−/− cells showed significantly decreased binding in the cilium relative to ift25−/− cells, although both accumulate Smo in cilia. (C) The dissociation rate of Smo from the base and tip of cilia in ptch−/− cells showed only a mild response to the pathway agonist SAG at the base. (D) In ift25−/− in the presence of SAG, binding events of Smo at the bases of cilia were less frequent and shorter in duration, as in the MEFs shown in Fig. 3. At the tip of the cilium, however, SAG induced an increase in frequency and duration of Smo binding. N defines the number of events measured in each condition. Error bars represent the 95% confidence of the fit parameter. *P < 0.05; **P < 0.01.
In ift25−/− cells, the addition of SAG not only decreased the frequency and the affinity of binding at the base, but also increased the frequency and the affinity of Smo binding at the tips of cilia (Fig. 4 B and D). Because the same effect was not observed in other cell lines we analyzed, we conclude that loss of IFT25 uncovers activation-dependent interactions of Smo at the tips of cilia. For example, IFT25 could be a part of the molecular machinery that helps dissociate Smo from the tips of cilia or enable its retrograde transport.
SI Materials and Methods
Constructs.
Wild-type mouse Smo was tagged on the N terminus, C-terminal to the signal sequence, with the SNAP-tag (26) and cloned into the MSCVpac vector as previously described (25). The cilium-base targeting label YFP-PACT was made by C-terminal addition of the PACT domain of pericentrin (27) to YFP and subcloning it into the MSCVpac vector (Clontech). To mark cilia tips, an N-terminal Turquoise tag was added to an HA-tagged mouse SuFu (37) and subcloned into the MSCVpac vector. EVC2-YFP expression plasmid was a gift from R. Rohatgi, Stanford University, Stanford, CA (15).
Small Molecules and Recombinant Proteins.
Shh conditioned media were made by using the 293 EcR Shh cells available from ATCC, as previously published (8). SAG (Smoothened agonist) was purchased from Alexis Biochemicals, SNAP-substrate (SNAP-surface Alexa Fluor 647) was from New England Biolabs, and puromycin was from Sigma.
Cell Culture.
All stable lines were made by infecting the cells with pMSCV-based (Clontech) retroviruses carrying the constructs of interest. Retroviral supernatants were produced in Bosc23 packaging cells, as previously published (25). Supernatants containing viral particles were collected 48 h after the transfection, polybrene was added at 4 μg/mL, and supernatants were filtered through a 0.45-μm filter and used to infect fibroblasts. The smo−/−;SNAP-smo cells (clone B10) were previously described (25). The smo−/−;SNAP-smo; YFP-PACT cells were generated by infecting the B10 clone with a retrovirus carrying YFP-PACT cloned into pMSCVpac, followed by selection with 20 µg/mL puromycin and isolation of single clones. IFT25WT and IFT25−/− cells were a gift from G. Pazour, University of Massachusetts, Worcester, MA (24). The ptch1−/−;SNAP-Smo;YFP-PACT cells and IFT25−/−;SNAP-smo;YFP-PACT cells were made by introducing the SNAP-Smo, and subsequently YFP-PACT constructs into the respective cells, followed by selection with puromycin (2 or 20 µg/mL). Cells were tested for the presence of introduced proteins by immunofluorescence staining of fixed cells and confocal microscopy. The IFT88-YFP expressing IMCD3 cells, a gift from D. Beier, Seattle Children's Research Institute, Seattle, were published previously (29, 30).
For live-imaging of cilia, cells were grown to confluence on chambered cover glass (Lab-Tek Chambered Coverglass, no. 1 borosilicate) in high glucose, phenol red-free DMEM with Hepes (Life Technologies) containing 10% (vol/vol) FBS (HyClone, defined grade) and supplemented with 2 mM GlutaMAX, 1 mM sodium pyruvate, and 0.1 mM MEM nonessential amino acid supplement (all from Gibco Life Technologies). To promote ciliogenesis, cells were switched to 0.5% FBS in phenol red-free high-glucose DMEM with supplements for 24 h before experiments. All live-cell imaging was done in the same medium. Cells were treated with SAG (100 nM) for 2–4 h before and during imaging. Photobleaching was reduced by adding antifade reagents, a combination of pyranose oxidase and catalase, into the media just before imaging, for up to an hour. Stock solutions (100×) of pyranose oxidase from Coriolus spp. at 70 mg/mL (lot no. 080M1548V; Sigma) or catalase from bovine liver at 3.6 mg/mL (lot no. 038K7007V; Sigma) were prepared in a freezing buffer [10% (vol/vol) glycerol, 12 μM Hepes (pH 7.0), 2 mM MgCl2], stored at −80 °C, and diluted 100× in the imaging medium just before use.
Immunofluorescence and Bulk Microscopy.
For immunostaining, cells were fixed in ice-cold 4% (wt/vol) paraformaldehyde in PBS for 10–15 min, followed by washes as previously described (25). Fixed cells were placed in block solution (1% normal donkey serum and 0.1% Triton X-100 in PBS) for 30 min and stained with primary antibodies for one hour at room temperature, and subsequently with Alexa Fluor-coupled secondary antibodies. Antibodies used for immunostaining were mouse anti-acetylated tubulin (Sigma), rabbit anti-Smo (8), rabbit anti-SNAP (NEB), anti-mouse, or anti-rabbit Alexa Fluor-coupled secondary antibodies (Life Technologies).
Microscopy of immunostained cells was performed on a Leica DMIRE2 laser scanning confocal microscope. Images were taken with a 63× lens and 4× zoom (Leica). All confocal image analysis of Smo protein levels in cilia was done in ImageJ (FIJI) as previously described (25). All quantitative comparisons for confocal image analysis and real-time PCR data were done using Student’s t test (Prism 6 software).
SNAP Labeling.
Cells were labeled with 1 µM SNAP-Surface Alexa Fluor 647 (New England BioLabs) for 10–15 min at 37 °C, followed by three washes with 0.5% FCS tissue culture media.
Quantitative Real-Time PCR.
Total cell RNA was isolated using TRIzol reagent (Invitrogen) and reverse-transcribed using SuperScript III First Strand Kit (Invitrogen). Transcript levels were quantified using real-time PCR (Applied Biosystems 7500) and TaqMan gene expression probes (Applied Biosystems) for gli1 (Mm00494645_m1) and gapdh (Mm99999915_g1) to normalize the samples.
Single-Molecule Imaging.
Single-molecule tracking experiments were performed on a customized inverted microscope (IX71; Olympus), outfitted with a motorized stage (ProScan III; Prior) controlled through the ImageJ plug-in Micromanager (38) and a stage-top incubator at 37 °C (INU-ONICS-F1; Tokai Hit). Smo proteins, labeled with SNAP-Surface Alexa Fluor 647 were illuminated at moderate intensities (∼700 W/cm2) with circularly polarized light from a 638-nm laser (FiberTec II; Blue Sky Research). YFP molecules labeling IFT88, EVC2, and PACT were excited by circularly polarized light from a 514-nm laser (Sapphire; Coherent) and turquoise fluorescent protein (TFP) labeling SuFu was excited at 425 nm (LuxX; Omicron). Fluorescence was collected through a 1.4 N.A. 100× oil-immersion objective (UPLSAPO; Olympus), and passed through a dichroic filter (FF425/532/656-Di01 or FF442-Di01; both from Semrock). At this point, longer wavelength light from the Alexa 647 fluorophore was passed through a long-pass dichroic (FF650-Di01; Semrock) and a bandpass filter (680-60; Chroma) and imaged on a Si EMCCD camera (iXon897 Ultra; Andor). Fluorescence from YFP and TFP was reflected by the second dichroic, filtered by a bandpass filter (578-105; Semrock and 525-50; Chroma, respectively) and then imaged on a second Si EMCCD camera (iXon897+; Andor). The two cameras had roughly equal pixel sizes (162 nm/pixel and 165 nm/pixel in sample space, respectively) and were aligned by maximizing the image correlations of objects that were visible on both detectors.
At the beginning of each experiment, cell media were replaced by imaging media containing oxygen scavengers. The slide was then explored at low illumination intensity (∼10 W/cm2) for ∼15 min while recording the coordinates of cilia, marked by ciliary markers as well as elevated concentrations of Smo (in accumulation conditions). After 10–20 cilia were identified, Smo molecules in each cilium were imaged for several minutes at moderate intensities (700 W/cm2) so that no sample was imaged for more than 1 h. We confirmed that Smo molecules explore the entire length of cilia by imaging SNAP-Smo in cells transiently transfected with arl13b-mCherry, which labeled entire cilia (Fig. S9). To obtain trajectories in cilia of unstimulated cells, we recorded single Smo molecules found in the vicinity (within 320 nm) of YFP-PACT, which labeled the bases of cilia. By examining the space explored during individual trajectories and the maximum intensity projection of recorded movies, we were able to identify ciliary Smo and estimate the ciliary lengths in unstimulated cells (Fig. S4).
Fig. S9.

Smoothened explores the entire cilium as defined by the location of ADP ribosylation factor-like protein (Arl13b)-mCherry. (A) Arl13b coats the inside of the cilium. (B) Smo, in accumulation conditions, is also enriched. (C) The protein densities of Arl13b and Smo were highly correlated. (Scale bars: 1 μm.)
Single-Molecule Tracking.
Single-molecule trajectories were recorded and analyzed using custom MATLAB scripts, which dynamically tracked the single-molecule spot. Single molecules were confirmed in movies by the characteristic single-step photobleaching (Fig. 1C) and localized by fitting a 2D symmetric Gaussian function (which well approximates the point spread function of the microscope) with a constant offset using the nonlinear least-squares fit algorithm lsqnonlin. Localizations with unphysical parameters were removed, likely caused by rare fluctuations in the background or occasionally blinking of molecules. Because of the wide separation between molecules, and the typical diffusive motion with diffusion coefficient ∼0.26 μm2/s, localizations in sequential frames could be readily identified as the same molecule. In ambiguous cases where two molecules moved close together, trajectories were ended, and begun as new trajectories after the molecules were once again well-separated. Single-molecule blinking was permitted within a trajectory in cases meeting three criteria: (i) the molecule blinked on again in fewer than 100 ms (10 frames); (ii) no other fluorescent molecules were nearby; and (iii) there was fairly small spatial displacement during the blinked-off period. If one of the above criteria was not met, tracking continued as a separate molecule.
Localization Precision.
Conversion between camera counts and detected photons (Fig. S5) was determined as previously described (19). For each localization, the finite number of photons detected translates to a nonzero localization precision, which is the error in determination of the actual position of the molecule. We diluted fluorescent beads (28-nm diameter 625/645 FluoSpheres; Invitrogen) in 1.5% wt/vol poly(vinyl alcohol) (Sigma) in water and immobilized them on a no. 1.5 glass coverslip. The pumping intensity was then adjusted to match the mean single-molecule signal achieved in measurements (∼216 photons per frame) and background was matched by shining dim white light onto the sample (∼24 photons per pixel per frame). The static localization precision was then measured by taking the SD of the measured positions in x and y for the bead sample (Fig. S6 A and B). This static localization error was similar to the distribution of localizations measured during Smo confinements in the cell (Fig. S6 C–F).
Simulation of Trajectories on the Surface of a Cilium-Like Object.
To assess the validity of the analysis methods, we performed simulations of diffusing particles on the surface of cilium-like objects (Fig. 1I). To represent the cilium, we used a cylindrical surface, 2.8 μm long and 400 nm in diameter, with a hemispherical cap as the tip and a reflective boundary as the base. Diffusion simulations were performed at very fine intervals and coarse-grained to simulate frames by taking the average position in each 10-ms interval. The true 3D positions of the particle in each frame were then projected onto a 2D plane, as in our measurements, and the particle’s positions were then obfuscated by the addition of a Gaussian-distributed random variable (SD 30 nm) to simulate measurement noise.
Trajectory Analysis.
Analysis of single-molecule trajectories began with the identification of cilia positions and orientation of the natural axes. Cilia lengths were measured using the prebleached diffraction-limited images (Fig. 1 C and F). The bases of the cilia were identified by finding the end closer to the basal marker YFP-PACT, or farther from the distal marker Turquoise-SuFu. The natural axes of cilia were typically identified by projecting the measured trajectory coordinates onto a pair of orthogonal axes and finding the rotation angle that maximized the ratio of the distribution size of the projected positions on prospective long vs. short axes. The average position along the short axes was then defined as the middle of the cilium (Fig. S4). Failure of the algorithm was easily detected by viewing the final orientation relative to the diffraction-limited image. In the few cases where the orientation algorithm failed due to the trajectory not exploring sufficient space, the cilium extent and orientation could be estimated using the unbleached diffraction-limited image instead. We used the former method when possible because it had superior performance due to the much larger number of precise points; however, our results were largely unaffected by the choice of either method.
To measure the diffusion coefficient of Smo in the cilium, we used mean squared displacement analysis using overlapping subtrajectories and extracted the slope from the first two time lags (39). Several previous studies have discussed the effect of structural confinement on the diffusion coefficient caused by a cylindrical shape (40, 41), thus we opted to use only the displacements along the long axis of our oriented trajectories.
Confinement Analysis.
Two types of confinement analysis were used. The first was to determine the fraction of confined 200-ms subtrajectories. To categorize subtrajectories as either confined or unconfined, we applied a variation of the maximum displacement probability distribution (31, 32). The challenge here is to include apparent motion of a fixed object that would arise only from the finite localization precision (17). Localization error was not considered in some previous studies (18, 19, 31, 32), but due to the short time windows and low diffusion coefficients in our sample, this error is likely to contribute a substantial portion of the putative displacement and had to be addressed. To simulate a stationary particle, we sampled successive positions over a series of measurement intervals of 10 ms from a normally distributed random variable with a SD of 35 nm, typical of our measurement’s localization error. To simulate a diffusing particle, we used the observed diffusion coefficient (0.26 μm2/s) to simulate Brownian motion at very short time intervals (10−6 s) in one dimension to model the continuous movement of a particle, coarse-grained these positions with 10-ms bins to simulate our frame lengths, and added localization error as above. We examined simulated 20-frame subtrajectories and computed the maximum distance traveled from the start position (Fig. S7). Empirically, the distribution of maximum displacements in one dimension ρx is well-described by the inverse Gaussian cumulative distribution function with two parameters, μ and λ (2.24595, 10.50205).
The two distributions thus generated cover the cases of no underlying motion and Brownian diffusion. For the Brownian diffuser, fewer than 3.6% of trajectories stayed within 147.5 nm, while at the same time 96.4% of the simulations of the fixed particle stayed within this distance, so we chose 147.5 nm as a cutoff value for classification for the measured data. With this metric, we can reliably interpret ρx as a mobility parameter, i.e., for ρx > 0.036 we score the subtrajectory as not confined. We applied this measure to both axes separately and used the larger displacement of the two. Although the cylindrical nature of the cilium made the short axes less useful, it was nonetheless usable on the 10- to 20-frame time scale and, in combination with the long axis information, could be used to define particles as confined or unconfined. We chose not to use a more sophisticated simulation that accounted for the shape of the cilium because the precise roundness of each cilium could not be determined in our measurements.
The second method to distinguish confined vs. not confined motions was used in determining the duration of the observed confinements; to do this, we calculated the duration of periods of a trajectory that fell below our confinement threshold. Because many confinements lasted over many more frames than our short subtrajectory duration, we measured the maximum displacement from the average position rather than from the start position. Through simulation as in the last paragraph (Fig. S7B), we found that the distribution of maximum displacements on one axis was well described by a different inverse Gaussian cumulative distribution function (1.53234, 11.26022; Dataset S1). For this case, we chose as threshold a maximum displacement of 116 nm, which yields a false negative probability of ∼1.3% and a false positive probability of ∼2.6%, i.e., ρx > 0.026 signifies not confined.
Binding Kinetics.
First-order reactions, such as unbinding from a fixed site, have reaction kinetics that are well described by a single exponential decay with two parameters: a mean lifetime, or (koff)−1, and the initial population quantity. The kinetic rates can be extracted from a single-molecule dwell-time analysis. Because our measurements required that a single molecule remain bound for a minimum number of frames (a complete subtrajectory) before it was detected, we subtracted that quantity (200 ms) from each binding duration before fitting to a single exponential decay (Fig. S10). To assess the significance of differences in determined rate coefficients we used Welch’s t test, which compares two distributions with unequal number of measurements and possibly unequal variances.
Fig. S10.
Binding times of Smoothened at the tip and base of the cilia are exponentially distributed. (A) At the tip of the cilium. (B) At the base of the cilium. The red line shows a first-order exponential fit.
Discussion
With standard fluorescence microscopy Smo can be detected in cilia only when overexpressed, when cells have been treated with pharmacological agents that induce accumulation, or by genetic manipulations. By using highly sensitive single-molecule tracking, we have directly observed low levels of Smo protein that are present in unactivated cilia. Strikingly, the behavior of these molecules was different from those in the induced cells. These activation-dependent changes in the dynamics of Smo in cilia likely reflect the changes in conformational state of Smo in the presence of pathway activators, but it is not clear how they relate to Smo enrichment in cilia (11, 12).
Based on immunoprecipitation and live-cell FRET experiments, it has been suggested that Smo, even without Hh stimulation, formed constitutive dimers/oligomers, and that Hh stimulation induced conformational changes and further clustering of Smo cytoplasmic C-terminal domains (33, 34); whether this reflects a signal-induced dimerization step is not fully clear at this point. Single-molecule tracking was previously used to observe dynamic dimerization of GPCRs on time scales similar to what we observed for Smo interactions (35). The binding that we detect does not represent such dimerization events, because dimerization would result in a small decrease in diffusion coefficient, within the noise of our measurements, unlike the prolonged events with no significant movement we observed. Dimerization might also be observed as an anomalously large (or bimodal) signal within a single diffraction-limited spot, and could be revealed by multiple photobleaching steps. We did not detect such events in our data, but it is fair to say our protocol was not specifically designed to detect dimers. We did observe a slight increase (5%) in the average fluorescent signal intensity of the nonmotile portions of trajectories, which can be explained by the improved fitting of a symmetric Gaussian for a stationary emitter.
The localization of the distinct molecular interactions of inactive Smo with binding partners at the bases of cilia roughly overlapped, or was proximal to Evc2 near the base of cilia. Biochemical studies have demonstrated a direct interaction between Smo in its active conformation and Evc2 protein at the base of cilia (15). The binding that we observed for inactive Smo is unlikely to be to Evc2, because the affinity for binding at the bases of cilia was higher for inactive Smo; this raises a possibility that there are two different binding partners for Smo at the base of cilia: one with higher affinity for inactive Smo, and Evc2 that binds active Smo. Further studies will be necessary to determine the actual binding partner(s) for Smo in unstimulated conditions.
In ptch−/− cells, where Smo molecules are in an active conformation and the Hh pathway is “on” (8), binding at the base was largely eliminated. Our results suggest that Ptch may be either influencing Smo binding sites in some way or changing the affinity of Smo for those sites. Because the direct binding of Ptch and Smo is not supported by current literature, the results would imply either the existence of a protein downstream of Ptch and upstream of Smo in the Hh pathway, or a change in Smo conformation induced by an exposure to a previously hypothesized Ptch-regulated small-molecule ligand (36).
Under several experimental conditions that we used, the binding of Smo at the base and the tip of cilia were affected independently, indicating that they represent distinct steps in Hh transduction. In its active conformation, Smo promotes the accumulation of SuFu and Gli transcription factors at the tips of cilia, where they need to be fully activated (10, 37). Although Smo binding at the tips of cilia strongly correlated with the localization of SuFu at the tip, it is unclear whether this directly reflects the transduction step between Smo and SuFu. Whereas binding of Smo at the tips of cilia did not change much in most of the conditions that we analyzed, in IFT25−/− cells we observed significantly increased binding durations relative to other conditions. This result provides evidence of a potentially important interaction of IFT25 with the Hh pathway components that leads to a reduced affinity of Smo for binding at the tip and consequent removal from cilia.
Materials and Methods
Stable cell lines expressing tagged proteins were made using murine stem cell virus (MSCV)-based retroviral vectors. Live-cell microscopy for single-molecule tracking experiments was performed on a customized inverted microscope (IX71; Olympus) at 37 °C (INU-ONICS-F1; Tokai Hit). For tracking Alexa 647-labeled SNAP-tagged Smo proteins, cells were incubated in imaging media supplemented with oxygen scavengers to prevent fast photobleaching, and were illuminated at moderate intensities (∼700 W/cm2) at 638 nm. Fluorescence was collected through a 1.4 N.A. 100× oil-immersion objective (UPLSAPO; Olympus), filtered to reduce background and scattered light, and imaged on a Si EMCCD camera (iXon897 Ultra; Andor).
Single-molecule trajectories were recorded and analyzed using custom MATLAB scripts, which dynamically tracked the single-molecule spot and found the relative ciliary coordinates. We confirmed that Smo molecules can explore the entire length of cilia by imaging SNAP-Smo in cells transiently transfected with the ciliary marker arl13b-mCherry (Fig. S9). Molecular confinement events were identified due to the inconsistency of their cumulative movement relative to simulated Brownian particle trajectories (31, 32) (Fig. S7). The extracted confinement durations were then fit with first-order exponential functions (Fig. S10), and the significance of differences were assessed using Welch’s t test, which compares two distributions with unequal number of measurements and possibly unequal variances.
A detailed description of the reagents and methods used in the paper are provided in SI Materials and Methods.
Supplementary Material
Acknowledgments
We thank Drs. Gregory Pazour, Rajat Rohatgi, and David Beier for reagents; Chris Calderon, James Nelson, Maxence Nachury, and Tim Stearns for discussions; and Raymond Wu and Katherine Bick for technical assistance. This work was supported by a Stanford Bio-X Interdisciplinary Initiatives Seed Grant (to M.P.S. and W.E.M.) and graduate student fellowship (L.E.W.); the Howard Hughes Medical Institute (M.P.S.); National Institute of General Medical Sciences Grants R01GM086196 (to W.E.M. and L.E.W.) for purchase of equipment and student support and R01GM085437 (to W.E.M. and J.Y.) for student support; and by National Institutes of Health National Eye Institute Grant PN2EY016525 (to W.E.M. and S.J.S.).
Footnotes
The authors declare no conflict of interest.
This article contains supporting information online at www.pnas.org/lookup/suppl/doi:10.1073/pnas.1510094112/-/DCSupplemental.
References
- 1.Briscoe J, Thérond PP. The mechanisms of Hedgehog signalling and its roles in development and disease. Nat Rev Mol Cell Biol. 2013;14(7):416–429. doi: 10.1038/nrm3598. [DOI] [PubMed] [Google Scholar]
- 2.Ingham PW, Nakano Y, Seger C. Mechanisms and functions of Hedgehog signalling across the metazoa. Nat Rev Genet. 2011;12(6):393–406. doi: 10.1038/nrg2984. [DOI] [PubMed] [Google Scholar]
- 3.Barakat MT, Humke EW, Scott MP. Learning from Jekyll to control Hyde: Hedgehog signaling in development and cancer. Trends Mol Med. 2010;16(8):337–348. doi: 10.1016/j.molmed.2010.05.003. [DOI] [PMC free article] [PubMed] [Google Scholar]
- 4.Ingham PW, McMahon AP. Hedgehog signaling in animal development: Paradigms and principles. Genes Dev. 2001;15(23):3059–3087. doi: 10.1101/gad.938601. [DOI] [PubMed] [Google Scholar]
- 5.Huangfu D, et al. Hedgehog signalling in the mouse requires intraflagellar transport proteins. Nature. 2003;426(6962):83–87. doi: 10.1038/nature02061. [DOI] [PubMed] [Google Scholar]
- 6.Wong SY, et al. Primary cilia can both mediate and suppress Hedgehog pathway-dependent tumorigenesis. Nat Med. 2009;15(9):1055–1061. doi: 10.1038/nm.2011. [DOI] [PMC free article] [PubMed] [Google Scholar]
- 7.Garcia-Gonzalo FR, et al. A transition zone complex regulates mammalian ciliogenesis and ciliary membrane composition. Nat Genet. 2011;43(8):776–784. doi: 10.1038/ng.891. [DOI] [PMC free article] [PubMed] [Google Scholar]
- 8.Rohatgi R, Milenkovic L, Scott MP. Patched1 regulates hedgehog signaling at the primary cilium. Science. 2007;317(5836):372–376. doi: 10.1126/science.1139740. [DOI] [PubMed] [Google Scholar]
- 9.Corbit KC, et al. Vertebrate Smoothened functions at the primary cilium. Nature. 2005;437(7061):1018–1021. doi: 10.1038/nature04117. [DOI] [PubMed] [Google Scholar]
- 10.Tukachinsky H, Lopez LV, Salic A. A mechanism for vertebrate Hedgehog signaling: Recruitment to cilia and dissociation of SuFu-Gli protein complexes. J Cell Biol. 2010;191(2):415–428. doi: 10.1083/jcb.201004108. [DOI] [PMC free article] [PubMed] [Google Scholar]
- 11.Wang C, et al. Structure of the human smoothened receptor bound to an antitumour agent. Nature. 2013;497(7449):338–343. doi: 10.1038/nature12167. [DOI] [PMC free article] [PubMed] [Google Scholar]
- 12.Nachtergaele S, et al. Structure and function of the Smoothened extracellular domain in vertebrate Hedgehog signaling. eLife. 2013;2:e01340. doi: 10.7554/eLife.01340. [DOI] [PMC free article] [PubMed] [Google Scholar]
- 13.Chen JK, Taipale J, Young KE, Maiti T, Beachy PA. Small molecule modulation of Smoothened activity. Proc Natl Acad Sci USA. 2002;99(22):14071–14076. doi: 10.1073/pnas.182542899. [DOI] [PMC free article] [PubMed] [Google Scholar]
- 14.Rohatgi R, Milenkovic L, Corcoran RB, Scott MP. Hedgehog signal transduction by Smoothened: Pharmacologic evidence for a 2-step activation process. Proc Natl Acad Sci USA. 2009;106(9):3196–3201. doi: 10.1073/pnas.0813373106. [DOI] [PMC free article] [PubMed] [Google Scholar]
- 15.Dorn KV, Hughes CE, Rohatgi R. A Smoothened-Evc2 complex transduces the Hedgehog signal at primary cilia. Dev Cell. 2012;23(4):823–835. doi: 10.1016/j.devcel.2012.07.004. [DOI] [PMC free article] [PubMed] [Google Scholar]
- 16.Kusumi A, Tsunoyama TA, Hirosawa KM, Kasai RS, Fujiwara TK. Tracking single molecules at work in living cells. Nat Chem Biol. 2014;10(7):524–532. doi: 10.1038/nchembio.1558. [DOI] [PubMed] [Google Scholar]
- 17.Savin T, Doyle PS. Role of a finite exposure time on measuring an elastic modulus using microrheology. Phys Rev E Stat Nonlin Soft Matter Phys. 2005;71(4 Pt 1):041106. doi: 10.1103/PhysRevE.71.041106. [DOI] [PubMed] [Google Scholar]
- 18.Vrljic M, Nishimura SY, Brasselet S, Moerner WE, McConnell HM. Translational diffusion of individual class II MHC membrane proteins in cells. Biophys J. 2002;83(5):2681–2692. doi: 10.1016/S0006-3495(02)75277-6. [DOI] [PMC free article] [PubMed] [Google Scholar]
- 19.Lommerse PHM, Snaar-Jagalska BE, Spaink HP, Schmidt T. Single-molecule diffusion measurements of H-Ras at the plasma membrane of live cells reveal microdomain localization upon activation. J Cell Sci. 2005;118(Pt 9):1799–1809. doi: 10.1242/jcs.02300. [DOI] [PubMed] [Google Scholar]
- 20.Calderon CP, Weiss LE, Moerner WE. Robust hypothesis tests for detecting statistical evidence of two-dimensional and three-dimensional interactions in single-molecule measurements. Phys Rev E Stat Nonlin Soft Matter Phys. 2014;89(5):052705. doi: 10.1103/PhysRevE.89.052705. [DOI] [PubMed] [Google Scholar]
- 21.Ye F, et al. Single molecule imaging reveals a major role for diffusion in the exploration of ciliary space by signaling receptors. eLife. 2013;2:e00654. doi: 10.7554/eLife.00654. [DOI] [PMC free article] [PubMed] [Google Scholar]
- 22.Goetz SC, Anderson KV. The primary cilium: A signalling centre during vertebrate development. Nat Rev Genet. 2010;11(5):331–344. doi: 10.1038/nrg2774. [DOI] [PMC free article] [PubMed] [Google Scholar]
- 23.Ocbina PJ, Anderson KV. Intraflagellar transport, cilia, and mammalian Hedgehog signaling: Analysis in mouse embryonic fibroblasts. Dev Dyn. 2008;237(8):2030–2038. doi: 10.1002/dvdy.21551. [DOI] [PMC free article] [PubMed] [Google Scholar]
- 24.Keady BT, et al. IFT25 links the signal-dependent movement of Hedgehog components to intraflagellar transport. Dev Cell. 2012;22(5):940–951. doi: 10.1016/j.devcel.2012.04.009. [DOI] [PMC free article] [PubMed] [Google Scholar]
- 25.Milenkovic L, Scott MP, Rohatgi R. Lateral transport of Smoothened from the plasma membrane to the membrane of the cilium. J Cell Biol. 2009;187(3):365–374. doi: 10.1083/jcb.200907126. [DOI] [PMC free article] [PubMed] [Google Scholar]
- 26.Keppler A, et al. A general method for the covalent labeling of fusion proteins with small molecules in vivo. Nat Biotechnol. 2003;21(1):86–89. doi: 10.1038/nbt765. [DOI] [PubMed] [Google Scholar]
- 27.Gillingham AK, Munro S. The PACT domain, a conserved centrosomal targeting motif in the coiled-coil proteins AKAP450 and pericentrin. EMBO Rep. 2000;1(6):524–529. doi: 10.1093/embo-reports/kvd105. [DOI] [PMC free article] [PubMed] [Google Scholar]
- 28.Swoboda M, et al. Enzymatic oxygen scavenging for photostability without pH drop in single-molecule experiments. ACS Nano. 2012;6(7):6364–6369. doi: 10.1021/nn301895c. [DOI] [PMC free article] [PubMed] [Google Scholar]
- 29.Tran PV, et al. THM1 negatively modulates mouse sonic hedgehog signal transduction and affects retrograde intraflagellar transport in cilia. Nat Genet. 2008;40(4):403–410. doi: 10.1038/ng.105. [DOI] [PMC free article] [PubMed] [Google Scholar]
- 30.Ott C, Lippincott-Schwartz J. Visualization of live primary cilia dynamics using fluorescence microscopy. Curr Protoc Cell Biol. 2012;57(4.26):4.26.1–4.26.22. doi: 10.1002/0471143030.cb0426s57. [DOI] [PMC free article] [PubMed] [Google Scholar]
- 31.Thompson MA, Casolari JM, Badieirostami M, Brown PO, Moerner WE. Three-dimensional tracking of single mRNA particles in Saccharomyces cerevisiae using a double-helix point spread function. Proc Natl Acad Sci USA. 2010;107(42):17864–17871. doi: 10.1073/pnas.1012868107. [DOI] [PMC free article] [PubMed] [Google Scholar]
- 32.Saxton MJ. Lateral diffusion in an archipelago. Single-particle diffusion. Biophys J. 1993;64(6):1766–1780. doi: 10.1016/S0006-3495(93)81548-0. [DOI] [PMC free article] [PubMed] [Google Scholar]
- 33.Zhao Y, Tong C, Jiang J. Hedgehog regulates Smoothened activity by inducing a conformational switch. Nature. 2007;450(7167):252–258. doi: 10.1038/nature06225. [DOI] [PubMed] [Google Scholar]
- 34.Chen Y, et al. Sonic Hedgehog dependent phosphorylation by CK1α and GRK2 is required for ciliary accumulation and activation of smoothened. PLoS Biol. 2011;9(6):e1001083. doi: 10.1371/journal.pbio.1001083. [DOI] [PMC free article] [PubMed] [Google Scholar]
- 35.Kasai RS, Kusumi A. Single-molecule imaging revealed dynamic GPCR dimerization. Curr Opin Cell Biol. 2014;27:78–86. doi: 10.1016/j.ceb.2013.11.008. [DOI] [PubMed] [Google Scholar]
- 36.Rohatgi R, Scott MP. Patching the gaps in Hedgehog signalling. Nat Cell Biol. 2007;9(9):1005–1009. doi: 10.1038/ncb435. [DOI] [PubMed] [Google Scholar]
- 37.Humke EW, Dorn KV, Milenkovic L, Scott MP, Rohatgi R. The output of Hedgehog signaling is controlled by the dynamic association between Suppressor of Fused and the Gli proteins. Genes Dev. 2010;24(7):670–682. doi: 10.1101/gad.1902910. [DOI] [PMC free article] [PubMed] [Google Scholar]
- 38.Edelstein A, Amodaj N, Hoover K, Vale R, Stuurman N. Computer control of microscopes using μManager. Curr Protoc Mol Biol. 2010;92:14.20.1–14.20.17. doi: 10.1002/0471142727.mb1420s92. [DOI] [PMC free article] [PubMed] [Google Scholar]
- 39.Michalet X, Berglund AJ. Optimal diffusion coefficient estimation in single-particle tracking. Phys Rev E Stat Nonlin Soft Matter Phys. 2012;85(6 Pt 1):061916. doi: 10.1103/PhysRevE.85.061916. [DOI] [PMC free article] [PubMed] [Google Scholar]
- 40.Deich J, Judd EM, McAdams HH, Moerner WE. Visualization of the movement of single histidine kinase molecules in live Caulobacter cells. Proc Natl Acad Sci USA. 2004;101(45):15921–15926. doi: 10.1073/pnas.0404200101. [DOI] [PMC free article] [PubMed] [Google Scholar]
- 41.Oswald F, L M Bank E, Bollen YJ, Peterman EJ. Imaging and quantification of trans-membrane protein diffusion in living bacteria. Phys Chem Chem Phys. 2014;16(25):12625–12634. doi: 10.1039/c4cp00299g. [DOI] [PubMed] [Google Scholar]
Associated Data
This section collects any data citations, data availability statements, or supplementary materials included in this article.


