Significance
Cyclic nucleotide-gated (CNG) channels underlie sensory transduction in photoreceptors and olfactory epithelium and share a high degree of homology with K+ channels. However, these channels conduct Na+ and K+ differently: although K+ channels discriminate with high accuracy Na+ from K+, CNG channels do not discriminate among different cations. By combining electrophysiology, molecular dynamics simulations, and X-ray crystallography we found that the pore region exhibits a dynamic structure. We show that (i) the selectivity filter can adapt to large and small ions with a different geometry and (ii) the pore diameter critically depends on the ion within. We conclude that the pore of CNG channels is highly flexible and that this flexibility is at the basis of their poor ionic selectivity.
Keywords: CNG channels, pore flexibility, X-ray crystallography, MD simulations
Abstract
Cyclic nucleotide-gated (CNG) ion channels, despite a significant homology with the highly selective K+ channels, do not discriminate among monovalent alkali cations and are permeable also to several organic cations. We combined electrophysiology, molecular dynamics (MD) simulations, and X-ray crystallography to demonstrate that the pore of CNG channels is highly flexible. When a CNG mimic is crystallized in the presence of a variety of monovalent cations, including Na+, Cs+, and dimethylammonium (DMA+), the side chain of Glu66 in the selectivity filter shows multiple conformations and the diameter of the pore changes significantly. MD simulations indicate that Glu66 and the prolines in the outer vestibule undergo large fluctuations, which are modulated by the ionic species and the voltage. This flexibility underlies the coupling between gating and permeation and the poor ionic selectivity of CNG channels.
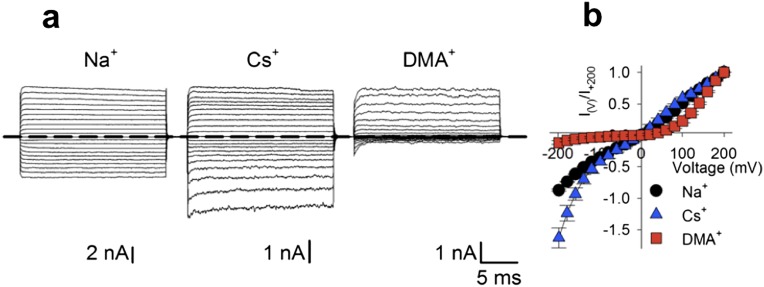
In K+ selective channels, the opening and closing of the ion channel pore (gating) and the translocation of ions through the pore (permeation) are considered independent processes with distinct structural basis (1). Gating is controlled by the bundle crossing at the intracellular side, whereas permeation reflects ion–ion and ion–pore interactions within the selectivity filter (1–5). Based on these experimental observations, the current paradigm assumes that the 3D structure of the selectivity filter is relatively rigid during ion translocation and the mechanisms of ionic permeation can be deduced in essence from its crystal structure. This paradigm has been successfully applied to several K+ channels (4, 6, 7). Cyclic nucleotide-gated (CNG) channels underlie sensory transduction in the retina and olfactory epithelium and share a high degree of homology with K+ channels (8–10). In contrast to K+ channels, CNG channels’ primary gate is located at the selectivity filter (11), suggesting that the same protein region controls ion permeation and gating. In CNG channels the ionic species present inside the pore influences channel gating; however, the nature of this coupling is not well understood (12–16). In the presence of large cations, such as Rb+ and Cs+, channel conductance and gating are also controlled by membrane voltage, and current–voltage relationships activated by 1 mM cGMP depend on the radius of the permeating ion (17, 18) (Fig. S1).
Fig. S1.
Electrophysiology of Na+, Cs+, and DMA+ in CNGA1 channel. (A) CNGA1 macroscopic current recordings from inside-out patches in the presence of 1 mM cGMP elicited by voltage steps from −200 to +200 mV (ΔV = 20 mV) in symmetrical Na+, Cs+, and DMA+ solutions (110 mM). (B) Normalized I–V relationship for the recordings in A (black dots, blue triangles, and red squares refer to Na+, Cs+, and DMA+ conditions, respectively).
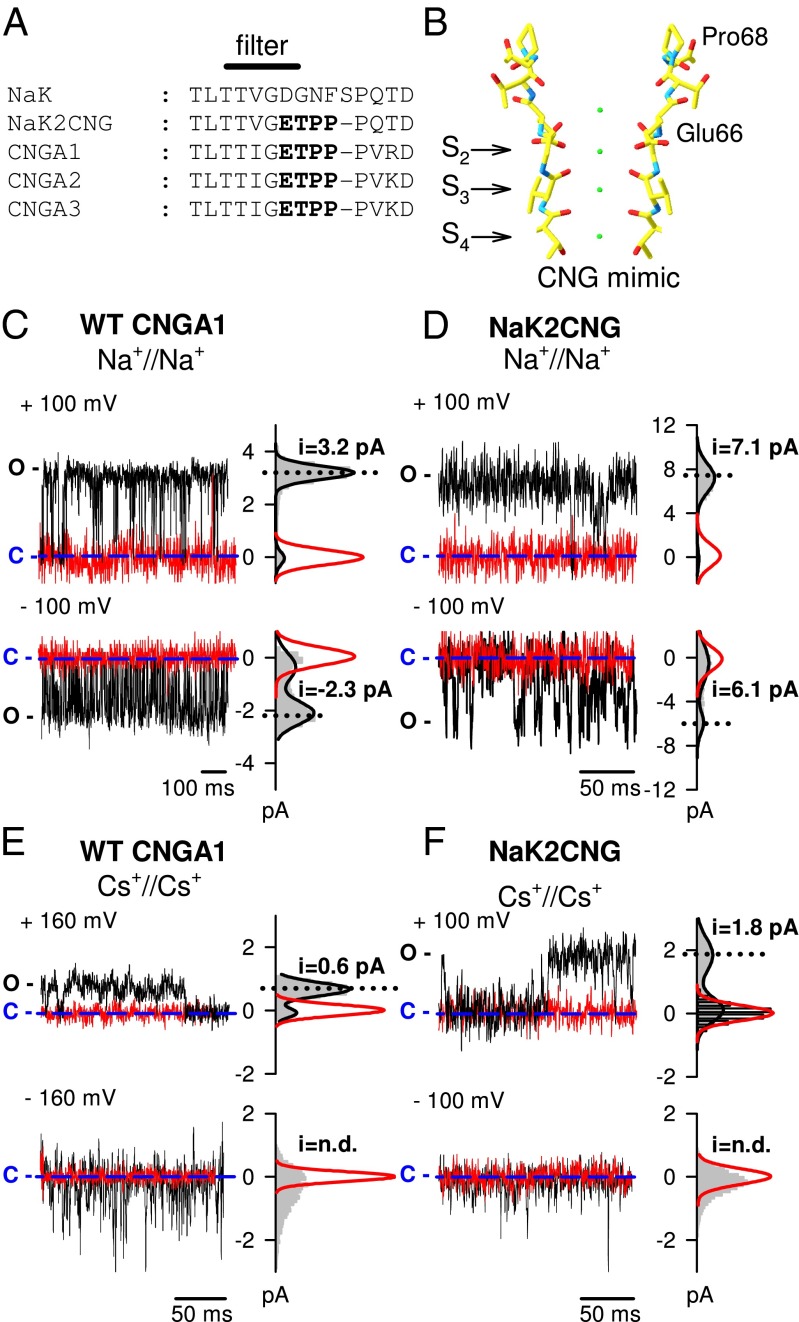
Structural information on CNG channels is limited to a low-resolution electron microscopy map (19), partial crystal structures of the intracellular cyclic nucleotide-binding domains (20–22), and the crystal structure of a chimeric channel in which the CNG selectivity-filter sequence is engineered into a bacterial NaK channel, creating a CNG mimic (NaK2CNG; Fig. 1 A and B) that shares several properties of CNG channels (23). This CNG mimic provides a suitable model for understanding the properties of the pore underlying the low ionic selectivity and the coupling between gating and permeation, which is common to all CNG channels.
Fig. 1.
Single-channel recordings in the presence of Na+ and Cs+ in the NaK2CNG and CNGA1 channels. (A) Sequence alignment of the selectivity filter of the bacterial NaK channel, the CNG-mimicking NaK chimera (NaK2CNG) and the bovine subunits CNGA1–CNGA3. The ETPP motif in the CNG signature is marked in bold. (B) Structure of the selectivity filter of the CNG-mimicking NaK channel in complex with K+ ions (PDB ID: 3K0D). (C) Current recordings from a single WT CNGA1 channel at +100 mV (Upper) and −100 mV (Lower) in the presence (black traces) and absence (red traces) of 1 mM cGMP in symmetrical 110 mM Na+ solution. (D) Current recordings from a single CNG-mimicking NaK chimeric channel at +100 mV (Upper) and −100 mV (Lower) in the absence (black traces) and presence (red traces) of 30 µM TPeA in symmetrical 110 mM Na+ solution. (E) As in C but in symmetrical 110 mM Cs+ solution and at ±160 mV. (F) As in D but in symmetrical 110 mM Cs+ solution. Amplitude histograms for recordings in the presence of 1 mM cGMP and in the absence of 30 µM TPeA for the WT and the mimic channel, respectively, are shown on the right (gray area). Black lines represent a two-term Gaussian fit to the histograms. Red lines represent a one-term Gaussian fit to the histograms for recordings in the absence of 1 mM cGMP and in the presence of 30 µM TPeA for the WT and the mimic channel, respectively. Blue dashed lines indicate the 0 current level. C and O refer to the closed and open states, respectively.
To investigate the molecular basis of the effects of permeant ions and voltage on gating and conductance, we combined electrophysiology, X-ray crystallography, and large-scale molecular dynamics (MD) simulations in the presence of different alkali and monovalent organic cations using this CNG mimic as a model system. We demonstrate that the extracellular entrance of the selectivity filter and the filter itself exhibit a dynamic structure capable of structural rearrangements, which can be partially captured by X-ray crystallography and are best visualized and understood through MD simulations. Our results indicate that the pore of CNG channels is highly flexible, with a liquidlike energy landscape (24, 25). This flexibility underlies the poor selectivity of CNG channels and their strong coupling between gating and permeation.
Results
Influence of Permeant Ions and Voltage on Gating and Conductance of CNG Channels and Its Mimics.
A crystal structure for the pore of CNG channels is currently unavailable. A CNG channel mimic has been constructed based on the bacterial NaK channel, in which the selectivity filter has been modified to reflect the CNG characteristic sequence ETPP (23), and has been crystallized in the presence of Na+, K+, and Ca2+ ions (Fig. 1 A and B). The CNG mimic lacks both the voltage sensing and the cyclic nucleotide-binding domain and is therefore a model for only the channel core. We overexpressed and purified the corresponding protein (Materials and Methods) and recorded single-channel activity in the presence of Na+ and Cs+ ions at +100 mV and −100 mV in giant liposomes (23) to verify whether the mimic recapitulates the effects of permeant ions and voltage on gating and conductance observed in the CNGA1 channel (18); this coupling is best observed by comparing the behavior of symmetrical Na+ and Cs+ conditions (17, 18) (Fig. 1). Indeed, in the presence of Na+ ions, CNGA1 channels show clear openings with single-channel conductances of 32 and 23 pS at +100 and −100 mV, respectively (Fig. 1C). Under these conditions both single-channel conductance and open probability did not depend significantly on voltage (17, 18). In contrast, in the presence of Cs+ ions, single-channel openings with an amplitude of ∼0.6 pA can be detected at +160 mV (at +100 mV, single-channel transitions were obscured by instrumental noise); however, at −160 mV, only brief current transients up to 3–4 pA are measured (Fig. 1E). Open probability was estimated to reduce more than threefold, from ∼0.9 at +160 mV to ∼0.25 at −160 mV (17, 18). A comparison with single-channel recordings from NaK2CNG channel mimic under identical ionic conditions (Fig. 1 D and F) indicates a similar behavior: in the presence of Na+, single-channel recordings have openings of 7.1 and 6.1 pA at +100 and −100 mV, respectively (Fig. 1D). In contrast, clear voltage-dependent asymmetries are observed in the presence of Cs+: the channel has flickering openings at −100 mV, with values ranging from 0.5 up to 2.5 pA and long-lasting well-defined channel openings of 1.8 pA at +100 mV (Fig. 1F). Moreover, channel activity is suppressed by the addition of the intracellular blocker tetrapentylammonium (TPeA; red traces in Fig. 1 D and F). Therefore, the bacterial CNG mimic is a suitable model for dissecting the molecular determinants of the coupling between gating, permeation, and voltage in the CNG channel pore.
Monovalent Cation Binding Sites in the NaK2CNG Channel Mimic.
Previous experimental and theoretical studies have established a connection between a particular number of consecutive binding sites for cations and channel selectivity. Four binding sites were observed in the filter in K+ selective channel, whereas two or three binding sites were visualized in nonselective channel (23, 26). Therefore, we performed a comprehensive crystallographic structural analysis of monovalent alkali cations (Li+, Na+, Rb+, and Cs+) and organic compounds (MA+ and DMA+) bound to the NaK2CNG channel (Figs. 2 and 3A) to identify structural changes in the presence of different permeant ionic species.
Fig. 2.
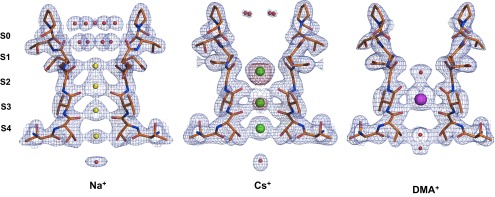
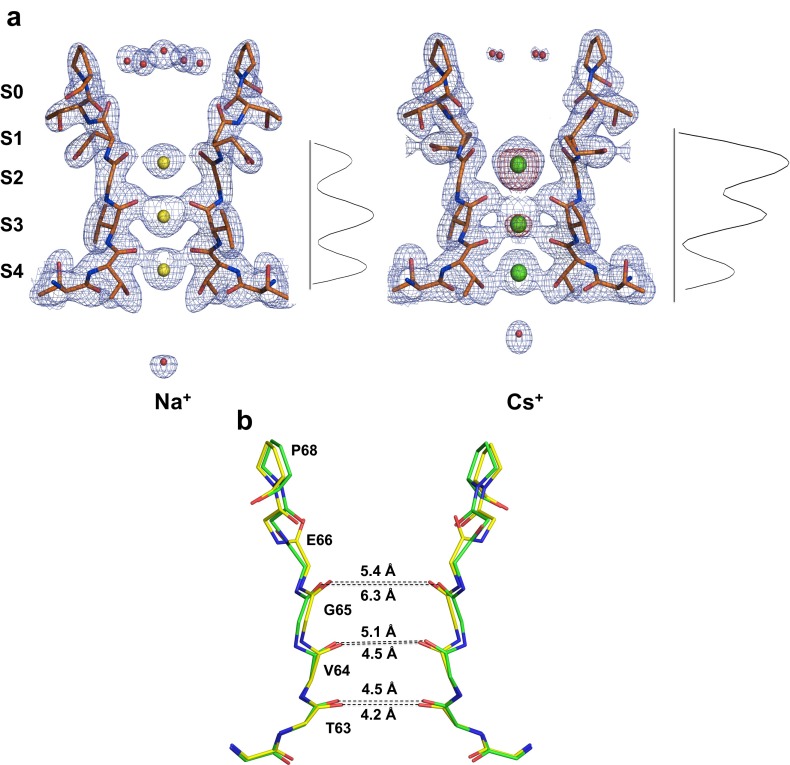
Electron density maps for the pore region in the presence of a subset of monovalent cations. 2Fo–Fc electron density maps of Na+, Cs+, and DMA+ at the filter region. The maps are contoured at 1.5σ for the Na+ and DMA+ structures and at 1.3σ for the Cs+ structure. For the Cs+ structure, the anomalous difference map contoured at 3σ is shown as a purple semitransparent surface.
Fig. 3.
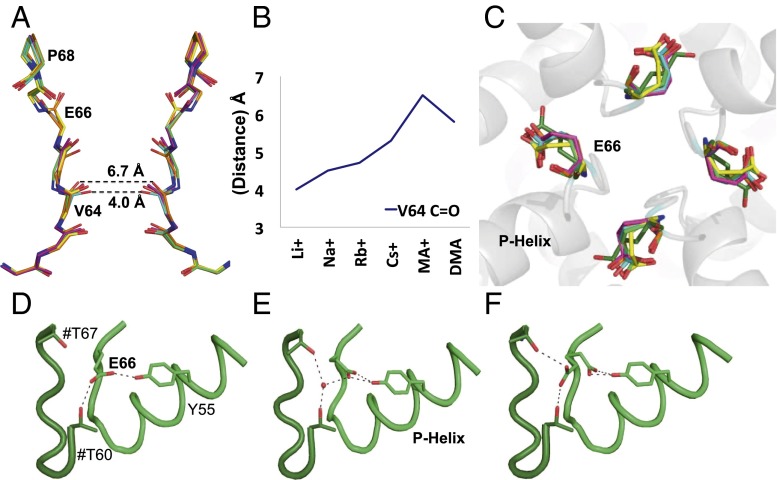
Flexibility of the NaK2CNG channel pore. (A) The tetrameric structures of Li+, Na+, Rb+, Cs+, MA+, and DMA+ complexes are superposed, and the main chains of residues 62–68 are shown for two opposite subunits in the tetramer, viewed along the fourfold axis. The complexes are color coded as follows: Li+ (cyan), Na+ (yellow), Rb+(forest green), Cs+ (green), MA+ (orange), and DMA+ (magenta). Changes in the pore size and the orientation of Glu66 carbonyls can be observed. (B) A plot of the distances for the carbonyl oxygens of two Val64 residues on opposite subunits against the various ions. (C) An overview of the changes in the relative orientation of the Glu66 side chains as viewed down the tetrameric channel axis from the extracellular side. (D–F) A sample of the different relative orientations and hydrogen-bonding patterns of Glu66. The neighboring molecule is shown in dark green; side-chain residues involved in the interactions are shown; and residues from an adjacent subunit are labeled with a hash.
The NaK2CNG channel was purified in the presence of 100 mM KCl, as previously described (23). Due to difficulties in crystal reproducibility, a variety of crystallization conditions were explored (Table S1); 25–100 mM glycine was added to produce well-diffracting crystals. The crystals were grown in 100 mM K+, followed by incubation in stabilization solutions containing 100 mM Na+, Rb+, or Cs+. Incubation of the crystals in stabilization solutions containing MA+ or DMA+ did not result in cation binding, most likely due to the large size of the organic compounds. Therefore, we purified the NaK2CNG channel in the presence of 100 mM MA+ or DMA+ and successfully obtained crystals (Table S1). Similarly, to obtain NaK2CNG in complex with Li+ ions, we purified and crystallized the protein in the presence of 100 mM LiCl.
Table S1.
Composition of crystallization solution
| Protein | Ion | Composition of crystallization solution |
| NaK2CNG-E | Li+ | 40–44% (wt/vol) MPD, 100 mM Mes pH6.5, 25 mM glycine |
| NaK2CNG-E | K+ | 60–66% (wt/vol) MPD, 100 mM Mes pH6.5, 100 mM glycine |
| NaK2CNG-E | MA+ | 40–44% (wt/vol) MPD, 100 mM Mes pH6.5, 25 mM glycine |
| NaK2CNG-E | DMA+ | 40–44% (wt/vol) MPD, 100 mM Mes pH6.5, 25 mM glycine |
We determined the corresponding crystal structures by molecular replacement using the coordinates determined in the presence of K+ (PDB ID: 3K0D; ref. 23) as a search model and refined the models to resolutions ranging from 2.3 to 2.85 Å. Data collection and refinement statistics are summarized in Table S2. During the final round of refinement, the ions and water molecules within the pore were omitted; following additional refinement cycles, omit maps were calculated to obtain an unbiased snapshot of the electron density within the pore.
Table S2.
Data collection and refinement statistics (molecular replacement)
| Data collection | Li+ | Na+ | Rb+ | Cs+ | MA+ | DMA+ |
| PDB entry data collection | 4R50 | 4RAI | 4R8C | 4R6Z | 4RO2 | 4R7C |
| Space group | I 4 | I 4 | I 4 | I 4 | P2221 | P2221 |
| Cell dimensions | ||||||
| a, b, c (Å) | 67.57, 67.57, 88.53 | 67.65, 67.65, 86.77 | 67.31, 67.31, 84.29 | 68.17, 68.17, 90.40 | 67.70, 91.04, 67.62 | 67.68, 89.89, 67.62 |
| α, β, γ (°) | 90, 90, 90 | 90, 90, 90 | 90, 90, 90 | 90, 90, 90 | 90, 90, 90 | 90, 90, 90 |
| Resolution (Å) | 33.78–2.85 (3.00–2.85) | 53.35–2.31 (2.43–2.31) | 47.59–2.50 (2.64–2.50) | 54.43–2.30 (2.42–2.30) | 47.84–2.7 (2.85–2.7) | 47.84–2.3 (2.39–2.3) |
| Rmerge | 0.148 (0.38) | 0.096 (0.43) | 0.063 (0.43) | 0.114 (0.43) | 0.096 (0.39) | 0.071 (0.46) |
| I/σI | 5.1 (1.9) | 2.9 (1.7) | 6.1 (1.6) | 3.1 (1.7) | 5.8 (1.7) | 9.56 (2.1) |
| Completeness (%) | 99.9 (100) | 99.3 (99.9) | 100 (100) | 98.9 (98.9) | 100 (100) | 99.6 (99) |
| Redundancy | 5.8 (6.1) | 3.9 (4.1) | 3.6 (3.6) | 3.6 (3.6) | 5.2 (5.0) | 4.3 (4.2) |
| Refinement | ||||||
| Resolution (Å) | 2.85 | 2.31 | 2.5 | 2.3 | 2.7 | 2.3 |
| No. reflections | 27392 (4212) | 33470 (5079) | 37293 (5491) | 33281 (4843) | 62622 (8561) | 80342 (7433) |
| Rwork/Rfree | 0.125/0.183 | 0.144/0.215 | 0.204/0.257 | 0.152/0.182 | 0.248/0.283 | 0.207/0.248 |
| No. atoms | ||||||
| Protein | 1376 | 1374 | 1281 | 1361 | 1400 | 2669 |
| Ligand/ion | 30 | 97 | 72 | 81 | 139 | 292 |
| Water | 56 | 40 | 27 | 64 | 52 | 69 |
| B factors | ||||||
| Protein | 39.61 | 42.91 | 55.14 | 44.15 | 44.85 | 44.56 |
| Ligand/ion | 52.48 | 61.78 | 81.98 | 68.31 | 60.54 | 56.95 |
| Water | 29.59 | 45.95 | 70.41 | 49.63 | 42.00 | 47.60 |
| Rms deviations | ||||||
| Bond lengths (Å) | 0.0132 | 0.0146 | 0.0168 | 0.0289 | 0.0107 | 0.0185 |
| Bond angles (°) | 1.5637 | 1.7418 | 1.6726 | 2.1084 | 1.5161 | 1.8628 |
The asymmetric unit contains two independent molecules; for each complex, only one of the two molecules is discussed, unless significant differences among the two are present. The putative ion sites are named from 1 to 4, beginning from the extracellular side (7) (Fig. 2). A different pattern of electron density peaks within the selectivity filter can be observed in the presence of each ion, confirming that the channel is able to accommodate and to subtly adjust to a variety of chemical species. For simplicity, our detailed analysis is primarily focused on three complexes (Na+, Cs+, and DMA+; Fig. 2) to provide a direct comparison with the electrophysiology and MD simulation results. Data for the remaining ion complexes are reported in Table S2.
The diffraction data collected in the presence of Na+ ions exhibits some anisotropy; upon anisotropy correction (27) of the data we obtained an electron density map that clearly shows metal binding sites. The electron density within the pore reveals some differences between the two crystallographically independent molecules. One of the two molecules can be better interpreted as containing three bound ions (Fig. S2), whereas the other appears to contain four (Fig. 2). On the basis of previous reports (6), we can speculate that the four or three sites are a balance mixture of an alternating arrangement of Na+ and water molecules. The observed electron density is indeed an average image of all accessible ion-binding states represented within the crystal and it is impossible to distinguish between the contribution of Na+ (11 electrons) and water molecules (10 electrons) to the electron density in the selectivity filter.
Fig. S2.
B molecule of Na+ complex. (A) For Na+ complex structure, there are significant differences between the two crystallographically independent molecules in the pore region. Whereas four binding sites are seen in A molecule (Fig. 2), the B molecule shows three binding sites. In the external funnel an inner layer of five water molecules was observed. The water molecule in the cavity is too far to participate in the chelation of the Na+ ion as observed for A molecule. As these three binding sites are reminiscent of the ones observed in Cs+ complex we compared the z axis one-dimensional electron density profiles (6, 37) for a quantitative estimation of filter relative occupancy. Although both show three binding sites in the channel, one-dimensional electron density profiles of bound ions revealed for the Cs+ complex structure much stronger electron density at site 2 and marginally at site 3 than at site 4. Because no anomalous scattering is observed in correspondence to site 4, the density at site 4 can be interpreted as either a water molecule or a Cs+ at lower occupancy. In the Na+ complex structure, electron density at sites 3 and 4 are roughly equivalent, with the density at site 2 being marginally less intense. Because we cannot distinguish between the contribution of Na+ (11 electrons) and water molecules (10 electrons) to the electron density in the selectivity filter, we can only speculate that the three sites are a balance mixture of Na+ and water molecules. One-dimensional electron density profiles of bound ions are obtained by sampling the electron density maps along the central axis of the filter. The 2Fo–Fc electron density maps are contoured at 1.5σ for the Na+ structure and at 1.3σ for the Cs+ structure. For the Cs+ structure, the anomalous difference map contoured at 3σ is shown as a purple semitransparent surface. (B) The tetrameric structures of Na+ (yellow) and Cs+ (green) are superposed, and the main chains of residues 62–68 are shown for two opposite subunits in the tetramer, viewed along the fourfold axis. In the Cs+ complex structure, an expansion in the size of the pore is observed. These distances are consistent in the two crystallographically independent tetramers.
When crystals grown in KCl are incubated in a solution of CsCl, three binding sites are observed (Figs. 2 and S2) with a more intense peak corresponding to site 2. X-ray anomalous signal could be collected at a wavelength of 1.2 Å and an anomalous difference map shows a strong peak at site 2, followed by a less intense peak at site 3, confirming the presence of Cs+ ions and identifying the most populated Cs+ sites within the filter (Fig. 2). Our data clearly show that Cs+ predominantly binds at site 2 and 3, whereas the density at site 4 can be better interpreted as either a water molecule or a Cs+ at lower occupancy (Fig. S2).
Our analysis was then extended to the organic compound DMA+ to visualize the pore region in the presence of one of the largest permeant cations through CNG channels (28). The electron density map reveals a single strong peak at site 3, and weaker electron density peaks on the channel axis were interpreted as water molecules (Fig. 2).
Therefore, the NaK2CNG channel can accommodate a variety of cations indicating a degree of flexibility of the pore, which is further discussed below. In agreement with previous models (23, 26), Cs+ and DMA+ complex structures present less than four binding sites in the filter, consistent with the nonselective nature of the CNG channel.
Filter Conformational Change Underlying Ion Binding.
The differences in position, ion occupancy, and ion size in the Li+, Na+, Rb+, Cs+, MA+, and DMA+ complexes also result in small but significant structural changes in the polypeptide backbone lining the pore lumen. A significant variation in the size of the pore is observed: an expansion of the lumen is detected with increasing cation size, particularly in the presence of the larger organic compounds (Fig. 3A). This trend can be monitored by measuring the distance between the carbonyl oxygens of Val64 on opposite subunits: this distance varies from 4 Å for the complex with Li+ to 6.7 Å for the MA+ complex (Fig. 3 A and B). The enlargement arises from both a small lateral displacement of the backbone polypeptide chain and a reorientation of main-chain carbonyls (Fig. 3A). These distances are generally consistent in the two crystallographically independent tetramers and indicate that the diameter of the pore region increases with the size of the bound cation.
Smaller structural variations are observed for Pro68 at the external vestibule. A comparison of the Na+ and Cs+ structures reveals a small lateral displacement of the backbone polypeptide chain in this region (Fig. 3A), resulting in a 0.7 Å widening of the funnel. Although this change is small and close to the level of the experimental error, it is consistent with the mobility observed by MD simulations (see the following section). A similar variation for the main chain of Glu66 is observed within the selectivity filter: in the presence of DMA+, the main-chain carbonyl of Glu66 rotates by up to 60° away from the permeation pathway (Fig. 3 A and C). This movement is similar to that observed when this glutamate was mutated to aspartic acid or asparagine (23), stressing the conformational flexibility of this segment.
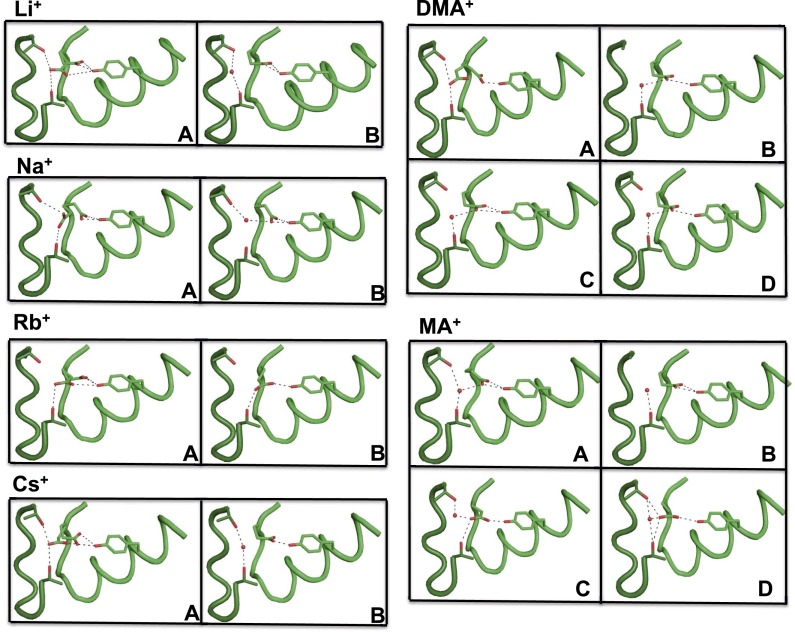
Significant structural differences are also observed in the region surrounding the selectivity filter. In the published NaK2CNG structure, in the presence of either K+ or Na+, the side-chain carboxylate of Glu66 (corresponding to Glu363 of the CNGA1 channel) forms a hydrogen bond with Thr60 of a neighboring subunit and with Tyr55 of the same subunit (23). However, in the structures reported herein, we observe a variety of conformations for the Glu66 side chain (Figs. 3C and S3), ranging from one similar to that previously described (Fig. 3D), to a distinct conformation in which the Glu66 carboxylate is engaged in a bifurcated intrasubunit hydrogen bond with Tyr55 and in an intersubunit interaction with Thr60 and Thr67 that is mediated by a water molecule (Fig. 3E). In some molecules, the electron density suggests the coexistence of two alternative conformations with approximately equal occupancies (Fig. 3F). This variation is not directly caused by the different cations, as there are systematic differences in the two molecules present in the crystal, and simply reflects a large degree of mobility of this side chain. In summary, crystallographic data clearly indicate a higher degree of flexibility, in both the pore size and the conformation of the selectivity filter, than normally observed in NaK channel.
Fig. S3.
Alternative conformations of the Glu66 side chains. Snapshots of the relative orientations and hydrogen-bonding patterns of Glu66 observed in the structures described herein. The neighboring molecule is shown in dark green; side-chain residues involved in the interactions are shown. For alkali cations (I4 space group), A and B indicates A and B molecule, respectively. For organic compounds (P2221 space group), A, B, C, and D indicate the four different chains that form two independent tetramers (AABB and CCDD).
Filter Conformational Dynamics from Molecular Dynamics Simulations.
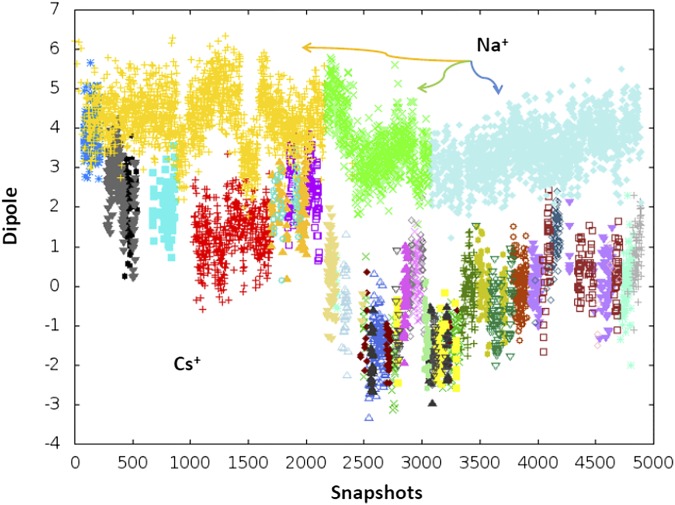
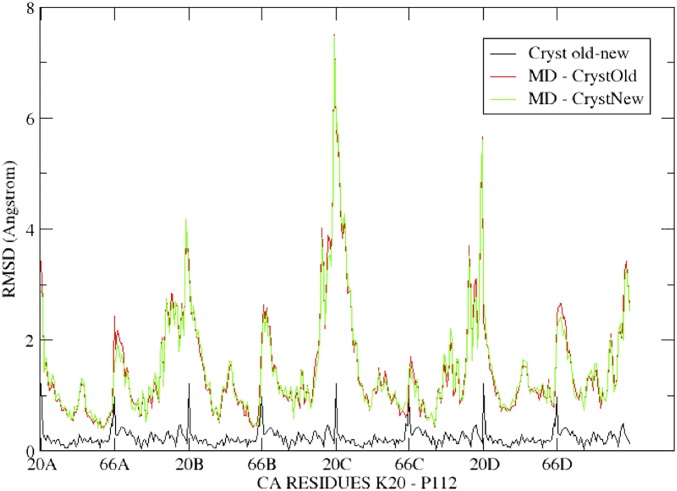
Electrophysiological recordings reveal a significant voltage dependence of gating in the presence of Cs+, but not in the presence of Na+ (Fig. 1), and the crystal structures in the presence of a variety of monovalent cations (Fig. 3) suggest that the pore is rather flexible and that Glu66 in the vestibule can assume an array of different conformations. To elucidate the interplay between the selectivity filter dynamics and the permeation process, we used classical MD to model the CNG mimic embedded in a lipid membrane and surrounded by water molecules, using the crystal structure determined by Derebe et al. (PDB ID: 3K0G) (23) to build our model. We first performed 100 ns of MD at 300 K in the presence of either two Na+ or two Cs+ ions within the selectivity filter. Visual inspection of these trajectories reveals a significantly higher flexibility for the system in the presence of the Cs+ ions (Movies S1 and S2). We used a recently developed clustering algorithm (SI Materials and Methods) (29) that is capable of identifying the metastable states of the system from its MD trajectory. Remarkably, we observed 38 metastable states for the Cs+ system and only 3 for the Na+ system (Fig. S4). The metastable states observed in the presence of Cs+ primarily differ in the position of the Glu66 side chains, which adopt a large array of conformations, ranging from the crystallographic position to a reorientation toward the external vestibule and, finally, toward the pore, where they often coordinate the ion (Fig. 4). When the crystallographic structures presented in this paper are compared with the published structures (23), the overall RMSD of alpha-carbon per residues is very small (Fig. S5). Indeed the largest deviations coincide with the Glu66–Pro68 region and the conformation of the glutamate side chains, consistent with the observed mobility (Fig. S5).
Fig. S4.
Cluster analysis of the classical MD trajectories of the Na+ and Cs+ systems. The figure summarizes the results cluster analysis made on dihedral angles of Glu66s. For each cluster we report in the figure the z component of the dipole moment (defined as in 1). As shown, three clusters characterize Na+ system, and many more (38) characterize the one with Cs+. Each cluster is shown with a different color. Those belonging to the Na+ system are indicated with arrows. All other clusters refer to the Cs+ system.
Fig. 4.
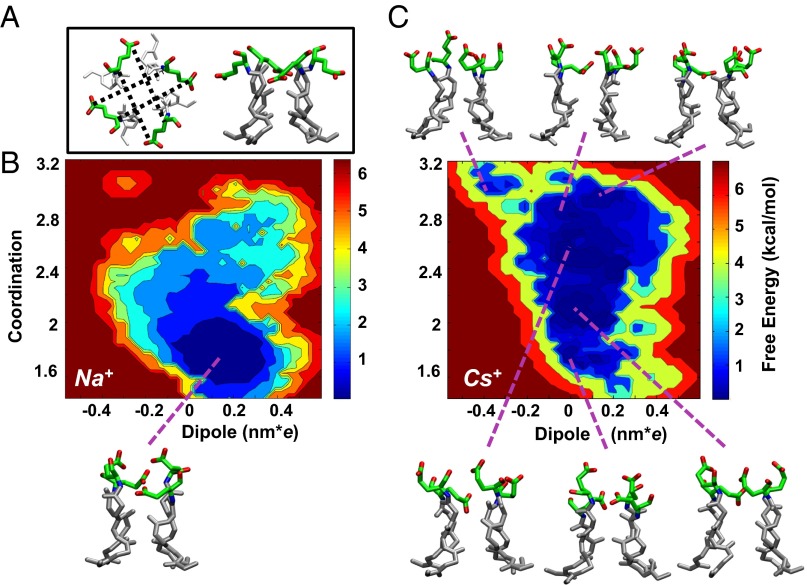
Free energy of the Na+ and Cs+ systems. (A) Top and side views of the selectivity filter in the crystal structure are shown (Glu66 in green sticks; oxygen atoms are colored red). In the top view (Left), the distances between the carbonyl and carboxylic group of Glu66 in different monomers are shown as black dotted lines. (B, C) The free energy as a function of the z dipole [nanometers for electron charge (nm*e)] and of the Glu66-Coordination variable for the Na+ (B) and Cs+ system (C). The variable Glu66-Coordination is explicitly defined in the SI Materials and Methods and counts the number of carboxylate and carbonyl groups of Glu66 in opposite monomers whose distance is larger than 8 Å. Possible conformations of Glu66 residues corresponding to different minima are shown for both the Na+ and the Cs+ systems. Although minima are separated by rather small free energy barriers (0.5 kcal/mol), this is likely to be an effect of the 2D projection of the free energy surface, as these states are stable for more than 1 ns in the MD simulations. The crystal structure used as the initial model (PDB ID: 3K0G) falls at the coordinates (0.69 nm*e; 3.62).
Fig. S5.
Plot of the RMSD of alpha-carbon per residue among the Na+ crystal structures and the models obtained by MD. RMSD of alpha-carbon per residues (calculated on each monomer) of the 100-ns MD simulations vs. the crystal structure of Derebe et al. (PDB ID: 3K0G) (23) and that determined in this work (PDB ID: 4RAI) Red line refers to MD simulations of the Na+ system vs. the crystal used to set up the simulations, green line refers to MD simulation of the Na+ system vs. the crystal solved in this work, black line refers to the crystal solved in this work vs. that used in the simulations (23). We remark that the largest deviations coincide with the partially disordered N-terminal region (residue 20) and the conformationally flexible region around amino acids 66–68, in all graphs.
Although these 100 ns of MD are sufficient to reveal that the presence of Na+ or Cs+ triggers a qualitatively different behavior of the channel, they cannot provide a quantitative picture of the free energy landscape that underlies this difference. Therefore, we used bias-exchange metadynamics (BE-META), which allows the computation of the free energy landscape in complex biomolecules as a function of several putative reaction coordinates (30–32), hereafter called collective variables (CVs). Because the electrophysiological experiments revealed a strong voltage dependence in the presence of Cs+, the z component of the dipole of the selectivity filter was selected as a CV. To account for the long-range movement of the glutamate side chains, we selected as additional CVs the four distances between the carboxylate and carbonyl groups of Glu66 on opposite monomers within the tetramer (Fig. 4 and Materials and Methods). When the glutamates move, their side chain shifts from the crystallographic position, away from the pore axis (Fig. 3C), upward and toward the pore, getting closer to the opposite carbonyl. To depict the complex collective motion of the four Glu66 we also built a variable, hereafter referred as Glu66-Coordination, counting the number of carboxylate and carbonyl groups of Glu66 in opposite monomers with distances larger than 8 Å. When the value of this variable is high, the side chain of Glu66 is close to the crystallographic position. We then obtained the free energy as a function of the dipole of the selectivity filter and of the Glu66-Coordination variable (Fig. 4). Whereas in the presence of Na+ (Fig. 4B), the landscape is characterized by a deep broad minimum, in the presence of Cs+ (Fig. 4C), the landscape is flatter, with some local minima within a range of 1 kcal/mol from the global free energy minimum. This finding is consistent with that observed by classical MD: the Cs+ system is more ragged with several metastable states that significantly differ in the value of their dipole and in the conformations of Glu66.
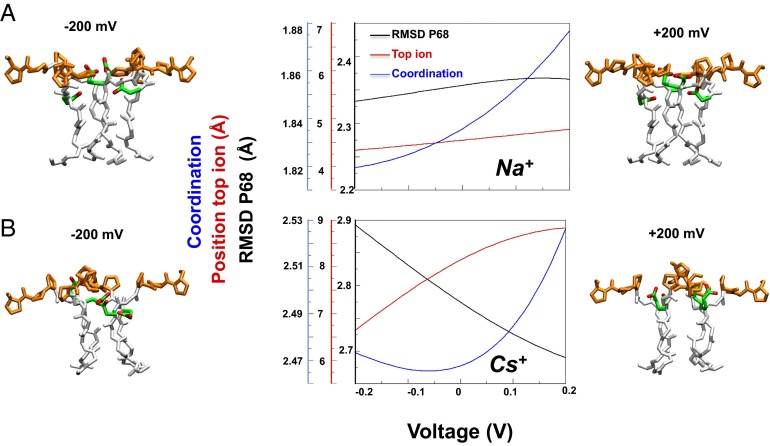
To extrapolate the difference in the voltage dependence in the presence of Na+ and Cs+, we computed the 2D projection of the free energy as a function of the dipole and other geometrical observables, which describe the position of the ions in the selectivity filter, the position of the Glu66 residues, and the position of the Pro68 residues. In particular, we have chosen the RMSD of Pro68 (calculated on heavy atoms) as a CV because the backbone of this residue changes conformation more significantly with V. From these projections of the free energy, it is possible to derive the dependence of the selected geometric variables on V. We estimate how geometric variables change with the voltage using Eq. 2. This equation is based on the assumption that the free energy of a microstate is modified by V according to its dipole. In this manner we model the response to the potential without performing simulations at different V (Fig. S6). The dependence on V is remarkably different in the presence of Na+ and Cs+ (Fig. 5). Namely, the average distance of the top Na+ ion from the selectivity filter (i.e., the distance of the ion from the center of the mass the four Gly65 along the z direction) changes by only 0.2 Å when V is changed between −0.2 and 0.2 V (red line, Fig. 5A), whereas the distance of the top Cs+ changes by more than 2 Å (red line, Fig. 5B). The coordination between Glu66 of opposite monomers grows linearly and regularly with V in the presence of Na+ (blue line, Fig. 5A), whereas this value first decreases and then sharply increases in the presence of Cs+ (blue line, Fig. 5B). Finally, the RMSD of Pro68 exhibits a strong voltage dependence in the presence of Cs+ (black line, Fig. 5A), but not in the presence of Na+ (Fig. 5B, black line).
Fig. S6.
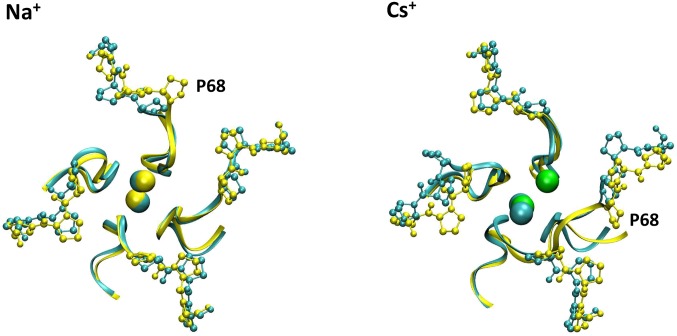
Top view of the channel at different V. Figure reports a top view of the superposition of the channel at −0.2 V (cyan) and at +0.2 V (yellow). The backbone of the selectivity filter is shown in ribbons, the Pro68-70 residues are shown in balls and sticks, and the Na+ and Cs+ ions are shown as cyan/yellow and cyan/green at the two voltages.
Fig. 5.
Dependence on the external potential of selected structural observables. (A, B) The RMSD of Pro68 (calculated on heavy atoms) with respect to the crystal structure (black line), the position of the top ion measured as the distance (only along the z axis) of the ion from the center of the mass of the heavy atom of the four Gly65 residues (red line), and the Coordination variable (blue line) for the Na+ (A) and Cs+ systems (B). Structures of the selectivity filter in sticks (white), Glu66 (green with oxygens in red), and Pro68-70 (orange), corresponding to different voltages, are shown on the two sides of the plots.
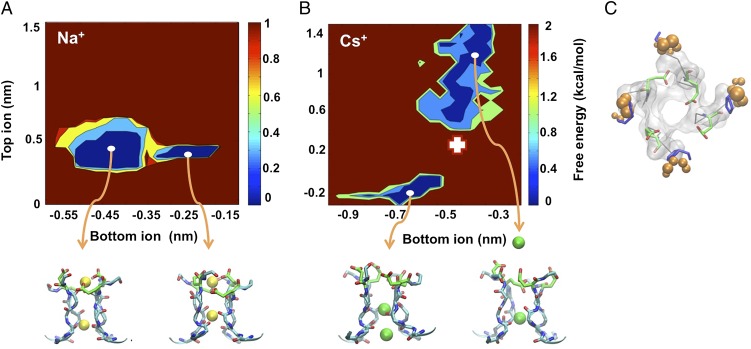
We next investigated the difference between the transport mechanism in the presence of Na+ and Cs+, and we searched for structural signatures at the transition states that account for the coupling between permeation and gating. Therefore, we projected the free energy along the vertical position of the two ions in the selectivity filter (Fig. 6). Different minima in this landscape correspond to states in which the position of at least one of the two ions has changed. Although this landscape does not provide a complete description of the permeation process, it reveals important differences between the Na+ and Cs+ systems. In the presence of Na+, the bottom ion can move between the two local minima without influencing the location of the top ion. In contrast, in the presence of Cs+, the position of the two ions is coupled, and when the bottom ion moves upward, the top ion must move toward the outer vestibule, clearly due to the larger size of the Cs+ ion.
Fig. 6.
Free energies of the Na+ and Cs+ systems. (A, B) Projection of the free energy (kcal/mol) as a function of the distances of the ions from the center of the mass of the heavy atom of the four Gly65 residues using only the z direction for the Na+ (A) and Cs+ (B) systems. (Lower) Representative structures of the minima: the selectivity filter is shown in cyan sticks and Glu66 in green sticks, whereas the ions are shown as yellow (Na+) or green (Cs+) spheres. (C) The transition state between the two free energy minima in the Cs+ system is indicated by a white cross in B. Pro68 is shown in blue sticks. This has been identified by a cluster analysis of structures sampled by the BE simulations with respect to the two CVs on which the free energy is projected, and selecting the structure corresponding to a saddle point. Glu66 residues are shown in green sticks with their oxygens in red. For reference, the structure of Pro68 corresponding to the lower-left free energy minimum is shown as orange spheres centered on each nonhydrogen heavy atom, whose radius is equal to their fluctuation in the minimum.
Moreover, we also extrapolated the dependence of this free energy profile on V. In the presence of Na+, the free energy between the two minima does not change with V (Fig. S7); whereas, in the case of Cs+, the free energy of the two minima is identical only for positive voltage. Decreasing the voltage causes the first minimum to become progressively favored (Fig. S7). The energy landscape associated to Cs+ ions’ movements within the pore seems to be affected by membrane voltage, thus voltage-dependent asymmetries in current flow are expected in this condition (Fig. S1).
Fig. S7.
Dependence of free energy minima on V. Schematic view of the dependence of the free energy of the two minima on the external field estimated using the Eq. 4 (Material and Methods). Voltages are referred as follows: −200 mV, green line; 0 mV, red line; and +200 mV black line. Na+ and Cs+ systems are shown in A and B, respectively.
The free energy landscape (Fig. 6B) suggests that for the Cs+ system, the rate-limiting step of the permeation process, relative to the part of the free energy surface (FES) we have explored, is associated with the concerted movement of the two ions. We then analyzed the structure of the transition state between the two minima (white cross in Fig. 6B), and we identified the average structure of Pro68 at the transition state (blue sticks, Fig. 6C). This structure clearly indicates that at the transition state Pro68 is in a significantly distorted configuration with respect to the main minimum and is not compatible with thermal fluctuations, demonstrating that the permeation process of Cs+ is coupled with the movement of Pro68 from its equilibrium position. Thus, because the external potential V dramatically affects the conformation of Pro68 only in the presence of Cs+, V influences only the Cs+ permeation process (Fig. 5B).
All these results point to the importance of the role played by Pro68. Indeed, the position of the top Cs+ as well as the RMSD of Pro68 is strongly affected by changes of V (Fig. 5). At the same time, the transition between the two minima in Fig. 6, namely a crucial step in the permeation process, is coupled with a rearrangement of the Pro68 at the transition state (Fig. 6). Therefore, these findings suggest that by varying V one simultaneously controls the gating and affects the transition state of the permeation process. Indeed, previous electrical recordings from CNGA1 channels confirmed the involvement of this proline in Cs+ permeation (14). When Pro365, which is equivalent to Pro68 in the mimic, is replaced with a threonine, differently from what is observed in the WT channel (Fig. 7A), Cs+ permeation is nearly abolished (Fig. 7B). A 100-ns-long MD simulation of the Pro68Thr in the presence of Cs+ shows indeed that in the mutant the flexibility of the filter is significantly modified (Fig. 7C). Thus, the mutation does not alter the structure of the channel, but its flexibility.
Fig. 7.
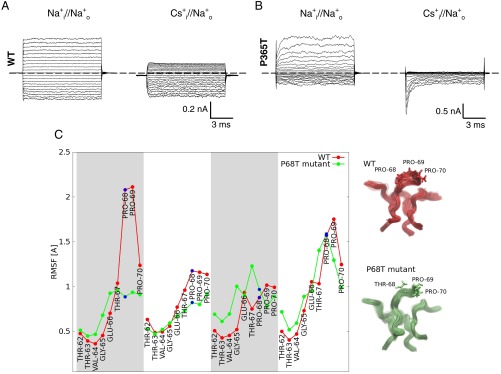
Flexibility of the WT and Pro68Thr mutant. (A) Macroscopic currents recorded from the WT CNGA1 channel in the presence of 110 mM intracellular Na+ (Left) and Cs+ (Right) with 1 mM cGMP on the cytoplasmic side. The patch pipette was filled with 110 mM Na+. Voltage steps from −200 to +200 mV (ΔV = 20 mV). (B) Macroscopic currents recorded from the mutant Pro365Thr CNGA1 channel. Ionic conditions and voltage protocol were the same as in A. It is notable that the presence of intracellular Cs+ appears to slow down the deactivation kinetics as large Na+ transients are observed at hyperpolarized membrane potentials only in the presence of Cs+ (B, Right). (C, Left) Root mean square fluctuations per residue of the selectivity filter (red and green lines for the WT and the Pro68Thr mutant, respectively) calculated along 100-ns-long MD simulations. The four monomers are indicated by alternate white and gray areas. (C, Right) The fluctuations of the selectivity filter are shown for the wild type (red) and the mutant (green). Residues 68–70 are shown in sticks.
SI Material and Methods
Cluster Analysis.
The clustering algorithm used for identifying the metastable states of selectivity filter has been recently described by Rodriguez and Laio (29). In short, we consider an MD trajectory with configurations labeled by i. We then compute the distance in CV space between each pair of configurations: where are the set of dihedrals that define the geometry of the four Glu66 residues in the configuration i.
We then estimate the density , namely the number of configurations that are at a distance smaller than 30° from configuration i. We then find the cluster centers, i.e., the configuration i with a density that is higher than the one of its neighbors. This is assessed by computing , and choosing as putative centers of the clusters (metastable state) the outliers of 2D representation of vs. . We then iteratively assign each configuration to the same cluster of its nearest neighbor of higher density.
Discussion
By combining electrophysiology, molecular dynamics simulations, and X-ray crystallography we have found that the pore region exhibits a dynamic structure capable of conformational changes. MD simulations indicate that the flexibility critically depends on the ion present within the pore and influences ionic conduction, underlying the coupling between gating and permeation.
When comparing various crystal structures, the pore appears to adapt to the different ions by increasing its size, whereas the side chain of the critical residue Glu66 assumes a variety of conformations (Fig. 3). MD simulations confirm and extend these observations by showing that the high degree of flexibility of the Glu66 side chains, together with the mobility of Pro68 in the outer vestibule, are likely to play an important role in the permeation of larger alkali cations such as Cs+. Although high-resolution structures of CNG mimics are already available (23) and the mechanisms of ion conduction and selectivity studied since these X-ray structures were determined (26, 33), in this paper we have demonstrated such flexibility and we have discussed its implication in ionic permeation. Previous crystallographic titration experiments in the presence of different Na+ and K+ mole fractions suggested that the selectivity filter architecture does not depend significantly on the ion occupancy (34). Likewise, earlier MD simulations did not reveal conformational changes coupled to ionic permeation in the presence of different ions in this channel (26, 33).
A simple explanation of the selectivity of ionic channels, based on the thermodynamics of ion hydration and geometrical factors, suggested that the poor selectivity of CNG channels could result from a larger flexibility of the pore (35). Our results demonstrate that the filter of CNG-like channels is rather flexible and dynamic, which, according to this model, is consistent with its promiscuous nature. Also the KcsA selectivity filter and adjacent regions show considerable conformational flexibility, as revealed from a comparison of existing KcsA structures in high and low K+ and in partial and fully open states (7, 36, 37). These structural snapshots have been proposed to reflect the molecular events leading to the slow mechanism of gating at the selectivity filter known as C-type inactivation in K+ channels (36, 37).
In K+ channels, a 2-Å pinching of the permeation pathway at Gly77 appears as the structural signature of the supposed inactivated state (36, 38). In contrast, in the present manuscript, we observed a pore dilation when the channel was loaded with large organic cations. It is interesting to note that, based on electrophysiological experiments, a dilated state of the selectivity filter was previously postulated to occur also in K+ channel following C-type inactivation: a transient permeation to Na+ and large organic cation tetramethylammonium was observed upon K+ ion depletion (39). If the period in K+-free solutions is prolonged (greater or equal to 200 s), the channels enter a slowly reversible nonconducting or “defunct” state (39, 40). In our experiments we have never observed a loss of conduction in the presence of larger alkali cation Cs+ and organic compounds: the dilated conformations of the filter reported in Fig. 3 do not appear to be connected to a nonphysiological “defunct” state as in K+ channels. Moreover, the mobility herein described and the C-type inactivation process seem to have different timescales. Although structural fluctuations in CNG channels occur on nanosecond timescales and are coupled to ionic translocation from one binding site to the next, transitions between conductive and inactivated states of the selectivity filter are associated with high energy barriers in K+ channels (15–20 kcal mol−1) and occur in a millisecond timescale that are not easily observed in MD simulations (41). This means that throughout simulations, the selectivity filter stayed near the crystallographic conformation which is in contrast with the liquidlike energy landscape herein observed (Fig. 4) and with the mobility of Glu66 side chain and Pro68 observed during our MD trajectories (Movies S1 and S2).
What is the structural basis for the different behaviors of K+ and CNG channels? In K+ channels, two key interactions involving the tyrosine residue in the selectivity filter and the charged aspartate immediately following the signature sequence play a major role in maintaining the conductive conformation of the filter and are necessary for K+ selectivity (42, 43). The ring of bulky tyrosine residues known as the “aromatic girdle” (4, 7) is conserved in most K+ channels and is thought to provide the putative rigidity and the network of hydrogen bonds necessary to stabilize the structure of the selectivity filter (4, 43, 44). Moreover, the aspartate immediately following the filter has been shown to participate in a multipoint hydrogen bond network defining the energetic profile of C-type inactivation in KcsA channels (42, 45, 46). In CNG channels, the aromatic girdle is replaced by a ring of glutamate residues (Glu363/Glu66), whereas the aspartate immediately following the filter is substituted by Pro365 (Fig. 6). Therefore, these two key structural pillars, which anchor the K+ channel selectivity filter in its conductive configuration, are lost in CNG channels. Pro365 is the first of a string of three consecutive prolines (Pro365-368) at the extracellular entrance of the selectivity filter. The analysis of the backbone dihedral angles reveals that these residues are arranged in a polyproline II helix, a secondary structure that, in contrast to the more common α-helix, is not stabilized by a regular pattern of main chain hydrogen bonds and is therefore more flexible (47). It is therefore not surprising that our MD simulations and our crystallographic results identify the mobility of Glu66 and Pro68 as the major molecular mechanism underlying the coupling between gating and permeation that is best observed in the presence of symmetrical Na+ and Cs+ conditions.
The rotameric change in conformation of the Glu66 side chains herein observed is reminiscent of the mobility recently reported for Na+ bacterial channels, where the conformational isomerization of a ring of four glutamate side chains lining the selectivity filter is coupled to ionic coordination (24, 25, 48). We propose that this flexibility, together with the number of equivalent and contiguous ion binding sites in the filter (26, 34, 49), underscores the poor ionic selectivity of CNG channels and reveals a conduction mode that differs substantially from that of classical K+ channels, which are highly selective and have a fairly rigid molecular structure. This flexibility is likely shared by other nonselective ionic channels, such as transient receptor potential (TRP) and chloride channels, in which a significant coupling among gating and permeation is also known to occur (50–53).
Materials and Methods
Protein Expression and Purification.
Expression plasmids for the NaK2CNG chimeric channels (NaK2CNG WT and Phe92Ala mutant) were kindly provided by Prof. Youxing Jiang, University of Texas Southwestern Medical Center, Dallas. Protein expression and purification were performed as previously described (23). In brief, the plasmid encoding the NaK2CNG chimera containing a C-terminal hexahistidine tag was transformed into Escherichia coli XL1B cells. Following expression at 25 °C, the proteins were extracted in 50 mM Tris⋅HCl, pH 8, in the presence of 100 mM KCl, LiCl, or DMA⋅HCl, and 40 mM n-decyl-β-d-maltoside (DM) (Anagrade) and purified by affinity chromatography using Talon resin, followed by size exclusion chromatography using a Superdex 200 gel filtration column (GE Healthcare) in 20 mM Tris⋅HCl, pH 8.0, 5 mM DM and the corresponding salt (100 mM LiCl, KCl or DMA⋅HCl).
Electrophysiology.
For single-channel recordings of the NaK2CNG channel, a protein/lipid (POPE/POPG 3:1) ratio of 0.05–0.1 μg mg−1 was used to reconstitute the proteoliposomes. The NaK2CNG channel used for functional characterization contains an extra Phe to Ala mutation at a position equivalent to Phe92 of NaK to enhance the single-channel conductance (23). Giant liposomes were obtained by air drying 2–3 μL of liposome sample on a clean coverslip overnight at 4 °C, followed by rehydration in a bath solution at room temperature. Patch pipettes were pulled from borosilicate glass to a resistance of 8–12 MΩ. Solutions on both sides of the membrane consisted of 110 mM XCl, 10 mM Hepes, and 0.2 mM EDTA (pH 7.4), where X is the indicated alkali or organic cation. Voltage control and current acquisition were achieved using a Digidata 1322A board (Molecular Devices), an Axopatch 200 patch clamp amplifier (Molecular Devices), and Clampex Software (Molecular Devices). Currents were low-pass filtered at 5 kHz and sampled at 20 kHz.
Electrical recordings from bovine rod CNGA1 channels and its mutants (P365T) were obtained as previously described (18). In brief, WT and mutant cRNAs were injected into Xenopus laevis oocytes (“Xenopus express”; Ancienne Ecole de Vernassal), and cGMP-gated currents from excised patches were recorded 2–6 d after RNA injection at room temperature (20–24 °C). Leak and capacitative components from macroscopic currents were removed by subtracting recordings obtained in response to an identical voltage protocol but without cGMP from the cGMP-activated current. Single-channel currents (isc) were estimated from patches containing only one CNGA1 channel, fitting normalized all-point histograms with two-component Gaussian functions as previously described (18).
Protein Crystallization.
Purified NaK2CNG was concentrated to 20 mg/mL and crystallized using the sitting drop vapor diffusion method at 20 °C by mixing equal volumes of protein and reservoir solution (crystallization conditions are provided in Table S1). Crystals of the protein purified in KCl were used in soaking experiments to obtain the structure in complex with various other cations (Na+, Rb+, and Cs+). The crystals were incubated overnight at 20 °C in stabilization solutions containing 70% MPD, 10 mM DM, 100 mM Hepes, pH 7.5, and 100 mM salt (NaCl, RbCl, or CsCl), as previously described (23). For the Li+, MA+, and DMA+ complexes, the protein was purified in the presence of the relevant salt. Crystallization conditions for all of the complexes are summarized in Table S1.
All of the crystals belonged to the tetragonal space group I4, with unit cell dimensions a = b = 68 Å and c = 83–90 Å, whereas the protein purified in MACl or DMACl crystallized in the related orthorhombic space group P2221. All crystals were flash frozen in liquid nitrogen, and X-ray diffraction data were collected at 100 K at either the European Synchrotron Radiation Facility (ESRF) ID-29 (Na+, Rb+, and Cs+ complex) or Elettra XRD1 beamline (Li+, MA+, and DMA+ complex). Anomalous data were collected for the Cs+ complex.
Structure Determination.
Data reduction was performed using iMOSFLM (54) or XDS (55, 56) and the CCP4i suite (57). The resolution cutoff was chosen following I/σI criterion (58). Most of the datasets exhibited merohedral twinning (59) and/or anisotropy. The anisotropic data were corrected by applying Sawaya’s method (27). The structures were determined by molecular replacement using the published K+ complex structure (PDB ID: 3K0D) (23), with the selectivity filter region omitted, as a search model. Repeated cycles of refinement using REFMAC5 (60) and model building using Coot were performed (61). Twin refinement was applied when necessary. Refinement statistics are listed in Table S2. All structural figures were prepared using PyMOL (www.pymol.org) software after aligning the tetramers using TM-align (62). PDB_REDO (63) has been used to check the quality of the crystallographic structure here reported.
Models and Simulations.
The tetrameric model of the NaK2CNG chimera was based on chain B (residues 19–113) of the Na+ complex (PDB ID: 3K0G), previously determined by Derebe et al. (23) The His residues, which are all exposed to the intracellular solvent, were protonated in the ε position. The Asp and Glu residues were considered deprotonated, whereas the Arg and Lys residues were considered protonated. The final tetrameric structure contained 95 residues (Ala2 to Arg96). The protein was embedded in a pure, preequilibrated 1-palmitoyl-2 oleylphosphatidylcholine (POPC) lipid model (kindly provided by T. A. Martinek) (64) using the gmembed tool of GROMACS and was oriented following the Orientation of Proteins in Membranes (OPM) database model. Subsequently, the system was neutralized and solvated with TIP3P model water molecules (76,305 total atoms in a box size of 92.8′ 91.9′ 87.5 Å3). Two systems were prepared with different permeant ions. First, two sodium ions alternated by a water molecule were placed in the three Na+ binding sites identified in the crystal structure. The simulations were performed in periodic boundary conditions at 300 K using the Nose–Hoover thermostat and Parrinello–Rahman barostat with a semisotropic pressure coupling type and a time step of 2 fs. Position restraints of atoms were fixed with a force constant (K) equal to 1,000 kJ mol−1 nm−2 were applied during the equilibration. We used the GROMACS4 package with the Amber03 force field for the protein and general amber force field (GAFF) for the membrane. This computational setup has been successfully used in the study of other membrane proteins (65–67). The equilibration was performed in three stages: (i) The system was heated for 2.5 ns with the protein backbone and ions fixed, whereas side chains were free to move. (ii) A time of 5.2 ns was run using position restraints only for the selectivity filter and the ions. In the first stage, we used the isobaric-isothermal ensemble (NPT) ensemble, whereas in the second stage, a surface tension equal to 600.0 bar⋅nm2 was added. (iii) For the next 1 ns, the membrane area was held constant, performing constant area isothermal (NAT) simulations.
A configuration obtained from this step was used as a starting point for an MD simulation of ∼100 ns. Moreover, from this configuration, the two Na+ ions were substituted by two Cs+ ions, and the new system was relaxed for ∼100-ns-long MD. In the productive MD and subsequent biased simulations of the two systems the tetramer is fully free to relax. The same simulation protocol was used to perform 100-ns-long MD simulation of the Pro68Thr in presence of the Cs+ ion.
Bias-Exchange Metadynamics.
To explore the free energy surface of the conformational states of the channel and better characterize its variability in the two systems, we performed two bias-exchange metadynamics (BE-META) simulations in constant volume isothermal ensemble (NVT) of 384 ns (48 ns * 8 walkers) (for the system with two Na+ ions in the selectivity filter) and 320 ns (40 ns * 8 walkers) (for the system with two Cs+ ions in the selectivity filter).
The collective variables used are:
-
i)
The dipole of the selectivity filter, only heavy atoms (164 atoms, 6 residues for each monomer, 2 walkers), defined as:
| [1] |
where for each atom i, the charge q is multiplied by the distance of its z coordinate at time t from the average of the z coordinates of all atoms at time t;
-
ii)
the distance between the Cα of Glu66 and the C of the carboxylic group (Cδ) of Glu66 in the opposite monomer (four variables; see Fig. 4C);
-
iii)
the coordination number of the ions with the two oxygens of the carboxylic group of Glu66 (where n = 6 and m = 12 for both systems; r0 = 0:3 nm for Na+ and r0 = 0:43 for Cs+); and
-
iv)
the coordination pairs of the native contacts between carbonyl oxygens (O) of Glu66 residues and the hydroxyl group of Y55 and between carboxylic oxygens (Oδ) of Glu66 residues and the hydroxyl group of T60 (n = 6, m = 12 and r0 = 0:25).
During the simulation time, the free energy converged for nearly all CVs in both the Na+ and the Cs+ systems. In particular, for the analysis of the Na+ system, we used the two walkers biased on the dipole and the four distances [for a total time of 108 ns (18 ns * 6 walkers)], whereas for the Cs+ system, we used one dipole, the four distances and the coordination number of the ions (for a total time of 90 ns, namely, 15 ns * 6 walkers). To understand and quantify the differences between the two systems, and, in particular, explain the voltage dependence observed in the electrophysiological experiments, we measured certain observables and we calculated their linear dependence on the external field. The dependence of an observable O on the external voltage V was calculated as follows:
| [2] |
where Fα is the free energy of microstate α, dα is its dipole, f is the Faraday constant (96485.34 C/mol), and Oα is the value of the observable in microstate α. In this manner we did not apply any external voltage in the simulations, but we extrapolated the dependence on V of selected relevant observables using Eq. 2. We considered the following three observables:
-
i)
the RMSD of the heavy atoms Pro68 of each monomer with respect to the crystal structure;
-
ii)
the distance of the center of mass of the four Cδ of Glu66 residues from the center of the pore (measured as the center of mass of the four G65 residues); and
-
iii)
the position of the top ion, measured as the distance of the ion from the center of the mass of the heavy atom of the four G65 residues, using only the z direction.
With the four distances used as CVs in BE-META, we built a variable termed Coordination, which approximately describes the location of the four Glu66 residues. This term is defined as the sum of four switching functions, with each from 0 to 1. The higher the value of this variable, the closer to the crystallographic position of Glu66, as follows:
| [3] |
where is the distance between the Cα of Glu66 and the Cδ of Glu66 in the opposite monomer. The sum includes the four pairs of Cα–Cδ.
The free energy as a function of the voltage is estimated as follows:
| [4] |
where Nα is the number of configurations assigned to microstate α.
Supplementary Material
Acknowledgments
We thank Prof. Youxing Jiang (University of Texas Southwestern Medical Center) for kindly providing us with the DNA of CNG mimic channel. We are grateful to Dr. Marco Salomone Stagni (University of Bozen) and Prof Ildikò Szabò (University of Padua) for the technical support.
Footnotes
The authors declare no conflict of interest.
This article is a PNAS Direct Submission.
Database depositions: Crystallography, atomic coordinates and structure factors have been deposited in the Protein Data Bank, www.pdb.org (PDB ID codes 4R50, 4RAI, 4R8C, 4R6Z, 4RO2, and 4R7C).
This article contains supporting information online at www.pnas.org/lookup/suppl/doi:10.1073/pnas.1503334112/-/DCSupplemental.
References
- 1.Hille B. Ionic Channels of Excitable Membranes. 1992. (Sinauer Associates, Sunderland, MA), 2nd Ed. [DOI] [PMC free article] [PubMed] [Google Scholar]
- 2.Holmgren M, Shin KS, Yellen G. The activation gate of a voltage-gated K+ channel can be trapped in the open state by an intersubunit metal bridge. Neuron. 1998;21(3):617–621. doi: 10.1016/s0896-6273(00)80571-1. [DOI] [PubMed] [Google Scholar]
- 3.Liu Y, Holmgren M, Jurman ME, Yellen G. Gated access to the pore of a voltage-dependent K+ channel. Neuron. 1997;19(1):175–184. doi: 10.1016/s0896-6273(00)80357-8. [DOI] [PubMed] [Google Scholar]
- 4.Doyle DA, et al. The structure of the potassium channel: Molecular basis of K+ conduction and selectivity. Science. 1998;280(5360):69–77. doi: 10.1126/science.280.5360.69. [DOI] [PubMed] [Google Scholar]
- 5.Jiang Y, et al. The open pore conformation of potassium channels. Nature. 2002;417(6888):523–526. doi: 10.1038/417523a. [DOI] [PubMed] [Google Scholar]
- 6.Morais-Cabral JH, Zhou Y, MacKinnon R. Energetic optimization of ion conduction rate by the K+ selectivity filter. Nature. 2001;414(6859):37–42. doi: 10.1038/35102000. [DOI] [PubMed] [Google Scholar]
- 7.Zhou Y, Morais-Cabral JH, Kaufman A, MacKinnon R. Chemistry of ion coordination and hydration revealed by a K+ channel-Fab complex at 2.0 A resolution. Nature. 2001;414(6859):43–48. doi: 10.1038/35102009. [DOI] [PubMed] [Google Scholar]
- 8.Mazzolini M, Marchesi A, Giorgetti A, Torre V. Gating in CNGA1 channels. Pflüg. Arch Eur J Physiol. 2010;459(4):547–555. doi: 10.1007/s00424-009-0751-2. [DOI] [PubMed] [Google Scholar]
- 9.Craven KB, Zagotta WN. CNG and HCN channels: Two peas, one pod. Annu Rev Physiol. 2006;68:375–401. doi: 10.1146/annurev.physiol.68.040104.134728. [DOI] [PubMed] [Google Scholar]
- 10.Kaupp UB, Seifert R. Cyclic nucleotide-gated ion channels. Physiol Rev. 2002;82(3):769–824. doi: 10.1152/physrev.00008.2002. [DOI] [PubMed] [Google Scholar]
- 11.Contreras JE, Srikumar D, Holmgren M. Gating at the selectivity filter in cyclic nucleotide-gated channels. Proc Natl Acad Sci USA. 2008;105(9):3310–3314. doi: 10.1073/pnas.0709809105. [DOI] [PMC free article] [PubMed] [Google Scholar]
- 12.Hackos DH, Korenbrot JI. Divalent cation selectivity is a function of gating in native and recombinant cyclic nucleotide-gated ion channels from retinal photoreceptors. J Gen Physiol. 1999;113(6):799–818. doi: 10.1085/jgp.113.6.799. [DOI] [PMC free article] [PubMed] [Google Scholar]
- 13.Ruiz ML, Karpen JW. Single cyclic nucleotide-gated channels locked in different ligand-bound states. Nature. 1997;389(6649):389–392. doi: 10.1038/38744. [DOI] [PubMed] [Google Scholar]
- 14.Gamel K, Torre V. The interaction of Na(+) and K(+) in the pore of cyclic nucleotide-gated channels. Biophys J. 2000;79(5):2475–2493. doi: 10.1016/S0006-3495(00)76490-3. [DOI] [PMC free article] [PubMed] [Google Scholar]
- 15.Holmgren M. Influence of permeant ions on gating in cyclic nucleotide-gated channels. J Gen Physiol. 2003;121(1):61–72. doi: 10.1085/jgp.20028722. [DOI] [PMC free article] [PubMed] [Google Scholar]
- 16.Kusch J, Nache V, Benndorf K. Effects of permeating ions and cGMP on gating and conductance of rod-type cyclic nucleotide-gated (CNGA1) channels. J Physiol. 2004;560(Pt 3):605–616. doi: 10.1113/jphysiol.2004.070193. [DOI] [PMC free article] [PubMed] [Google Scholar]
- 17.Arcangeletti M, Marchesi A, Mazzolini M, Torre V. Multiple mechanisms underlying rectification in retinal cyclic nucleotide-gated (CNGA1) channels. Physiol Rep. 2013;1(6):e00148. doi: 10.1002/phy2.148. [DOI] [PMC free article] [PubMed] [Google Scholar]
- 18.Marchesi A, Mazzolini M, Torre V. Gating of cyclic nucleotide-gated channels is voltage dependent. Nat Commun. 2012;3:973. doi: 10.1038/ncomms1972. [DOI] [PubMed] [Google Scholar]
- 19.Higgins MK, Weitz D, Warne T, Schertler GFX, Kaupp UB. Molecular architecture of a retinal cGMP-gated channel: The arrangement of the cytoplasmic domains. EMBO J. 2002;21(9):2087–2094. doi: 10.1093/emboj/21.9.2087. [DOI] [PMC free article] [PubMed] [Google Scholar]
- 20.Zagotta WN, et al. Structural basis for modulation and agonist specificity of HCN pacemaker channels. Nature. 2003;425(6954):200–205. doi: 10.1038/nature01922. [DOI] [PubMed] [Google Scholar]
- 21.Lolicato M, et al. Tetramerization dynamics of C-terminal domain underlies isoform-specific cAMP gating in hyperpolarization-activated cyclic nucleotide-gated channels. J Biol Chem. 2011;286(52):44811–44820. doi: 10.1074/jbc.M111.297606. [DOI] [PMC free article] [PubMed] [Google Scholar]
- 22.Shuart NG, Haitin Y, Camp SS, Black KD, Zagotta WN. Molecular mechanism for 3:1 subunit stoichiometry of rod cyclic nucleotide-gated ion channels. Nat Commun. 2011;2:457. doi: 10.1038/ncomms1466. [DOI] [PMC free article] [PubMed] [Google Scholar]
- 23.Derebe MG, Zeng W, Li Y, Alam A, Jiang Y. Structural studies of ion permeation and Ca2+ blockage of a bacterial channel mimicking the cyclic nucleotide-gated channel pore. Proc Natl Acad Sci USA. 2011;108(2):592–597. doi: 10.1073/pnas.1013643108. [DOI] [PMC free article] [PubMed] [Google Scholar]
- 24.Chakrabarti N, et al. Catalysis of Na+ permeation in the bacterial sodium channel Na(V)Ab. Proc Natl Acad Sci USA. 2013;110(28):11331–11336. doi: 10.1073/pnas.1309452110. [DOI] [PMC free article] [PubMed] [Google Scholar]
- 25.Boiteux C, Vorobyov I, Allen TW. Ion conduction and conformational flexibility of a bacterial voltage-gated sodium channel. Proc Natl Acad Sci USA. 2014;111(9):3454–3459. doi: 10.1073/pnas.1320907111. [DOI] [PMC free article] [PubMed] [Google Scholar]
- 26.Furini S, Domene C. Nonselective conduction in a mutated NaK channel with three cation-binding sites. Biophys J. 2012;103(10):2106–2114. doi: 10.1016/j.bpj.2012.10.004. [DOI] [PMC free article] [PubMed] [Google Scholar]
- 27.Strong M, et al. Toward the structural genomics of complexes: Crystal structure of a PE/PPE protein complex from Mycobacterium tuberculosis. Proc Natl Acad Sci USA. 2006;103(21):8060–8065. doi: 10.1073/pnas.0602606103. [DOI] [PMC free article] [PubMed] [Google Scholar]
- 28.Picco C, Menini A. The permeability of the cGMP-activated channel to organic cations in retinal rods of the tiger salamander. J Physiol. 1993;460:741–758. doi: 10.1113/jphysiol.1993.sp019497. [DOI] [PMC free article] [PubMed] [Google Scholar]
- 29.Rodriguez A, Laio A. Machine learning. Clustering by fast search and find of density peaks. Science. 2014;344(6191):1492–1496. doi: 10.1126/science.1242072. [DOI] [PubMed] [Google Scholar]
- 30.Baftizadeh F, Biarnes X, Pietrucci F, Affinito F, Laio A. Multidimensional view of amyloid fibril nucleation in atomistic detail. J Am Chem Soc. 2012;134(8):3886–3894. doi: 10.1021/ja210826a. [DOI] [PubMed] [Google Scholar]
- 31.Piana S, Laio A. A bias-exchange approach to protein folding. J Phys Chem B. 2007;111(17):4553–4559. doi: 10.1021/jp067873l. [DOI] [PubMed] [Google Scholar]
- 32.Granata D, Camilloni C, Vendruscolo M, Laio A. Characterization of the free-energy landscapes of proteins by NMR-guided metadynamics. Proc Natl Acad Sci USA. 2013;110(17):6817–6822. doi: 10.1073/pnas.1218350110. [DOI] [PMC free article] [PubMed] [Google Scholar]
- 33.Furini S, Domene C. Gating at the selectivity filter of ion channels that conduct Na+ and K+ ions. Biophys J. 2011;101(7):1623–1631. doi: 10.1016/j.bpj.2011.08.035. [DOI] [PMC free article] [PubMed] [Google Scholar]
- 34.Sauer DB, Zeng W, Canty J, Lam Y, Jiang Y. Sodium and potassium competition in potassium-selective and non-selective channels. Nat Commun. 2013;4:2721. doi: 10.1038/ncomms3721. [DOI] [PMC free article] [PubMed] [Google Scholar]
- 35.Laio A, Torre V. Physical origin of selectivity in ionic channels of biological membranes. Biophys J. 1999;76(1 Pt 1):129–148. doi: 10.1016/S0006-3495(99)77184-5. [DOI] [PMC free article] [PubMed] [Google Scholar]
- 36.Cuello LG, et al. Structural basis for the coupling between activation and inactivation gates in K(+) channels. Nature. 2010;466(7303):272–275. doi: 10.1038/nature09136. [DOI] [PMC free article] [PubMed] [Google Scholar]
- 37.Cuello LG, Jogini V, Cortes DM, Perozo E. Structural mechanism of C-type inactivation in K(+) channels. Nature. 2010;466(7303):203–208. doi: 10.1038/nature09153. [DOI] [PMC free article] [PubMed] [Google Scholar]
- 38.Cordero-Morales JF, et al. Molecular determinants of gating at the potassium-channel selectivity filter. Nat Struct Mol Biol. 2006;13(4):311–318. doi: 10.1038/nsmb1069. [DOI] [PubMed] [Google Scholar]
- 39.Loboda A, Melishchuk A, Armstrong C. Dilated and defunct K channels in the absence of K+ Biophys J. 2001;80(6):2704–2714. doi: 10.1016/S0006-3495(01)76239-X. [DOI] [PMC free article] [PubMed] [Google Scholar]
- 40.Hoshi T, Armstrong CM. C-type inactivation of voltage-gated K+ channels: Pore constriction or dilation? J Gen Physiol. 2013;141(2):151–160. doi: 10.1085/jgp.201210888. [DOI] [PMC free article] [PubMed] [Google Scholar]
- 41.Ostmeyer J, Chakrapani S, Pan AC, Perozo E, Roux B. Recovery from slow inactivation in K+ channels is controlled by water molecules. Nature. 2013;501(7465):121–124. doi: 10.1038/nature12395. [DOI] [PMC free article] [PubMed] [Google Scholar]
- 42.Cheng WW, McCoy JG, Thompson AN, Nichols CG, Nimigean CM. Mechanism for selectivity-inactivation coupling in KcsA potassium channels. Proc Natl Acad Sci USA. 2011;108(13):5272–5277. doi: 10.1073/pnas.1014186108. [DOI] [PMC free article] [PubMed] [Google Scholar]
- 43.Sauer DB, Zeng W, Raghunathan S, Jiang Y. Protein interactions central to stabilizing the K+ channel selectivity filter in a four-sited configuration for selective K+ permeation. Proc Natl Acad Sci USA. 2011;108(40):16634–16639. doi: 10.1073/pnas.1111688108. [DOI] [PMC free article] [PubMed] [Google Scholar]
- 44.Bernèche S, Roux B. A gate in the selectivity filter of potassium channels. Structure. 2005;13(4):591–600. doi: 10.1016/j.str.2004.12.019. [DOI] [PubMed] [Google Scholar]
- 45.Cordero-Morales JF, et al. Molecular driving forces determining potassium channel slow inactivation. Nat Struct Mol Biol. 2007;14(11):1062–1069. doi: 10.1038/nsmb1309. [DOI] [PubMed] [Google Scholar]
- 46.Cordero-Morales JF, Jogini V, Chakrapani S, Perozo E. A multipoint hydrogen-bond network underlying KcsA C-type inactivation. Biophys J. 2011;100(10):2387–2393. doi: 10.1016/j.bpj.2011.01.073. [DOI] [PMC free article] [PubMed] [Google Scholar]
- 47.Adzhubei AA, Sternberg MJE, Makarov AA. Polyproline-II helix in proteins: Structure and function. J Mol Biol. 2013;425(12):2100–2132. doi: 10.1016/j.jmb.2013.03.018. [DOI] [PubMed] [Google Scholar]
- 48.Furini S, Domene C. On conduction in a bacterial sodium channel. PLOS Comput Biol. 2012;8(4):e1002476. doi: 10.1371/journal.pcbi.1002476. [DOI] [PMC free article] [PubMed] [Google Scholar]
- 49.Derebe MG, et al. Tuning the ion selectivity of tetrameric cation channels by changing the number of ion binding sites. Proc Natl Acad Sci USA. 2011;108(2):598–602. doi: 10.1073/pnas.1013636108. [DOI] [PMC free article] [PubMed] [Google Scholar]
- 50.Betto G, et al. Interactions between permeation and gating in the TMEM16B/anoctamin2 calcium-activated chloride channel. J Gen Physiol. 2014;143(6):703–718. doi: 10.1085/jgp.201411182. [DOI] [PMC free article] [PubMed] [Google Scholar]
- 51.Chung MK, Güler AD, Caterina MJ. TRPV1 shows dynamic ionic selectivity during agonist stimulation. Nat Neurosci. 2008;11(5):555–564. doi: 10.1038/nn.2102. [DOI] [PubMed] [Google Scholar]
- 52.Banke TG, Chaplan SR, Wickenden AD. Dynamic changes in the TRPA1 selectivity filter lead to progressive but reversible pore dilation. Am J Physiol Cell Physiol. 2010;298(6):C1457–C1468. doi: 10.1152/ajpcell.00489.2009. [DOI] [PubMed] [Google Scholar]
- 53.Darré L, Furini S, Domene C. Permeation and dynamics of an open-activated TRPV1 channel. J Mol Biol. 2015;427(2):537–549. doi: 10.1016/j.jmb.2014.11.016. [DOI] [PubMed] [Google Scholar]
- 54.Leslie AGW. The integration of macromolecular diffraction data. Acta Crystallogr D Biol Crystallogr. 2006;62(Pt 1):48–57. doi: 10.1107/S0907444905039107. [DOI] [PubMed] [Google Scholar]
- 55.Kabsch W. Integration, scaling, space-group assignment and post-refinement. Acta Crystallogr D Biol Crystallogr. 2010;66(Pt 2):133–144. doi: 10.1107/S0907444909047374. [DOI] [PMC free article] [PubMed] [Google Scholar]
- 56.Kabsch W. XDS. Acta Crystallogr D Biol Crystallogr. 2010;66(Pt 2):125–132. doi: 10.1107/S0907444909047337. [DOI] [PMC free article] [PubMed] [Google Scholar]
- 57.Collaborative Computational Project, Number 4 The CCP4 suite: Programs for protein crystallography. Acta Crystallogr D Biol Crystallogr. 1994;50(Pt 5):760–763. doi: 10.1107/S0907444994003112. [DOI] [PubMed] [Google Scholar]
- 58.Karplus PA, Diederichs K. Linking crystallographic model and data quality. Science. 2012;336(6084):1030–1033. doi: 10.1126/science.1218231. [DOI] [PMC free article] [PubMed] [Google Scholar]
- 59.Yeates TO. Detecting and overcoming crystal twinning. Methods Enzymol. 1997;276:344–358. [PubMed] [Google Scholar]
- 60.Murshudov GN, et al. REFMAC5 for the refinement of macromolecular crystal structures. Acta Crystallogr D Biol Crystallogr. 2011;67(Pt 4):355–367. doi: 10.1107/S0907444911001314. [DOI] [PMC free article] [PubMed] [Google Scholar]
- 61.Emsley P, Lohkamp B, Scott WG, Cowtan K. Features and development of Coot. Acta Crystallogr D Biol Crystallogr. 2010;66(Pt 4):486–501. doi: 10.1107/S0907444910007493. [DOI] [PMC free article] [PubMed] [Google Scholar]
- 62.Zhang Y, Skolnick J. TM-align: A protein structure alignment algorithm based on the TM-score. Nucleic Acids Res. 2005;33(7):2302–2309. doi: 10.1093/nar/gki524. [DOI] [PMC free article] [PubMed] [Google Scholar]
- 63.Joosten RP, Joosten K, Murshudov GN, Perrakis A. PDB_REDO: Constructive validation, more than just looking for errors. Acta Crystallogr D Biol Crystallogr. 2012;68(Pt 4):484–496. doi: 10.1107/S0907444911054515. [DOI] [PMC free article] [PubMed] [Google Scholar]
- 64.Jójárt B, Martinek TA. Performance of the general amber force field in modeling aqueous POPC membrane bilayers. J Comput Chem. 2007;28(12):2051–2058. doi: 10.1002/jcc.20748. [DOI] [PubMed] [Google Scholar]
- 65.Schulz R, Vargiu AV, Collu F, Kleinekathöfer U, Ruggerone P. Functional rotation of the transporter AcrB: Insights into drug extrusion from simulations. PLOS Comput Biol. 2010;6(6):e1000806. doi: 10.1371/journal.pcbi.1000806. [DOI] [PMC free article] [PubMed] [Google Scholar]
- 66.Jójárt B, Kiss R, Viskolcz B, Keseru GM. Activation mechanism of the human histamine H4 receptor—An explicit membrane molecular dynamics simulation study. J Chem Inf Model. 2008;48(6):1199–1210. doi: 10.1021/ci700450w. [DOI] [PubMed] [Google Scholar]
- 67.Bisha I, Rodriguez A, Laio A, Magistrato A. Metadynamics simulations reveal a Na+ independent exiting path of galactose for the inward-facing conformation of vSGLT. PLOS Comput Biol. 2014;10(12):e1004017. doi: 10.1371/journal.pcbi.1004017. [DOI] [PMC free article] [PubMed] [Google Scholar]
Associated Data
This section collects any data citations, data availability statements, or supplementary materials included in this article.


