Abstract
Aims
To extend the physiologically based pharmacokinetic (PBPK) model developed for 6-mercaptopurine to account for intracellular metabolism and to explore the role of genetic polymorphism in the TPMT enzyme on the pharmacokinetics of 6-mercaptopurine.
Methods
The developed PBPK model was extended for 6-mercaptopurine to account for intracellular metabolism and genetic polymorphism in TPMT activity. System and drug specific parameters were obtained from the literature or estimated using plasma or intracellular red blood cell concentrations of 6-mercaptopurine and its metabolites. Age-dependent changes in parameters were implemented for scaling, and variability was also introduced for simulation. The model was validated using published data.
Results
The model was extended successfully. Parameter estimation and model predictions were satisfactory. Prediction of intracellular red blood cell concentrations of 6-thioguanine nucleotide for different TPMT phenotypes (in a clinical study that compared conventional and individualized dosing) showed results that were consistent with observed values and reported incidence of haematopoietic toxicity. Following conventional dosing, the predicted mean concentrations for homozygous and heterozygous variants, respectively, were about 10 times and two times the levels for wild-type. However, following individualized dosing, the mean concentration was around the same level for the three phenotypes despite different doses.
Conclusions
The developed PBPK model has been extended for 6-mercaptopurine and can be used to predict plasma 6-mercaptopurine and tissue concentration of 6-mercaptopurine, 6-thioguanine nucleotide and 6-methylmercaptopurine ribonucleotide in adults and children. Predictions of reported data from clinical studies showed satisfactory results. The model may help to improve 6-mercaptopurine dosing, achieve better clinical outcome and reduce toxicity.
Keywords: acute lymphoblastic leukaemia, modelling, pharmacokinetics, PBPK model, TPMT, 6-mercaptopurine
What is Already Known about this Subject
6-mercaptopurine is an antimetabolite prodrug used in the treatment of cancers and inflammatory diseases. It has a narrow therapeutic index with potential life-threatening toxicity linked to its active metabolite, 6-thioguanine nucleotide.
A physiologically based pharmacokinetic (PBPK) model has been developed for 6-mercaptopurine in adults and children.
TPMT, an enzyme responsible for the intracellular metabolism of 6-mercaptopurine has been shown to have three genetic polymorphic groups; high (homozygous wild-type), intermediate (heterozygous variant) and low (homozygous variant) activity groups.
What this Study Adds
The developed PBPK model has been extended to account for intracellular metabolism of 6-mercaptopurine incorporating genetic polymorphism in TPMT activity.
The model can be used to predict plasma and tissue concentrations of 6-mercaptopurine and its metabolites, including 6-thioguanine nucleotide which is responsible for activity and toxicity.
Introduction
6-mercaptopurine (6-MP) is an antimetabolite analogue of guanine and hypoxanthine which is widely used in the treatment of cancers such as acute lymphoblastic leukaemia (ALL) and inflammatory diseases such as Crohn's disease 1,2. 6-MP and other purine drugs have cytotoxic and immunosuppressive properties and often act as purine antagonists thereby interfering with the biochemical processes involving endogenous purine and consequently affecting DNA and RNA synthesis. Most current treatment protocols for the treatment of ALL include 6-MP, and have resulted in dramatic improvement in long term survival 3. Survival rate has increased steadily in the last 50 years following the introduction of 6-MP in the treatment of children with ALL, with one of the most recent studies reporting a 5 year survival rate greater than 90% 4.
Although 6-MP can be given both by oral and intravenous routes, it is more practical to use oral routes especially in maintenance protocols. Following oral administration, 6-MP undergoes extensive intestinal and hepatic metabolism. The oral bioavailability of 6-MP is therefore very low and highly variable as a result of the high first pass metabolism 5. Oral absorption of 6-MP is very rapid with a time to maximum concentrations of about 1.5 h and an elimination half-life of around 2 h 6. The plasma protein binding of 6-MP is around 19% 7 and the volume of distribution at steady state (Vss) is around 0.56 l kg–1 The metabolism of 6-MP is complex, via three competing routes: xanthine oxidase (XO), hypoxanthine-guanine phosphoribosyltransferase (HGPRT) and thiopurine methyltransferase (TPMT) 2.
The TPMT enzyme demonstrates genetic polymorphism which is one of most widely discussed topics in pharmacogenetics. Several population studies in the literature have shown a trimodal distribution for the activity of the TPMT enzyme in red blood cells (RBCs). This has led to the identification of three genetic polymorphic groups amongst individuals: high, intermediate and low activity groups in approximately 90%, 10% and 0.3% of the population 2,8–10. However, ethnic differences in RBC TPMT activity have also been observed in different populations in the literature with different proportions of subjects in the three groups 10–12. The three polymorphic groups represent individuals with homozygous wild-type (wt) alleles, heterozygous for one wild-type and one variant (v) allele and homozygous variant alleles, which are often represented as wt/wt, wt/v and v/v, respectively 13. In addition to identification of individuals using phenotypes, the molecular basis for altered TPMT enzyme activity has also been established using genotyping. This has led to the identification of several variant alleles, three of which (TPMT*2, TPMT*3A and TPMT*3C) have been shown to account for 80–95% of intermediate or low enzyme activity in individuals in Caucasian populations 10. The activity of the TPMT enzyme in RBCs has also been correlated with activity in other tissues such as liver, kidney, lymphocytes, platelets etc., which makes RBC TPMT enzyme activity a marker of TPMT enzyme activity in the entire human body 11.
Although the precise mode of action of 6-MP is not fully understood, its cytotoxicity and immunosuppressive activities have been linked to the incorporation of its metabolite, 6-thioguanine nucleotide (6-TGN) into DNA 14. It has also been shown that 6-MP has a narrow therapeutic index (mean peak plasma concentration, Cmax of 135 – 166 ng ml–1 and area under the concentration curve, AUC of 251–363 ng ml–1 h) with potential life-threatening drug induced toxicity 15,16. The differences between individuals in the accumulation of 6-TGN during 6-MP dosing have been shown to be an important determinant of haematopoietic toxicity and anti-leukemic effects 10. Accumulation of intracellular 6-TGN has been shown to be inversely related to TPMT enzyme activity. Individuals with high activity produce more metabolite through the methylation inactivation pathway, leaving less 6-MP for activation to 6-TGN which can lead to reduced clinical efficacy of the treatment 10. Excess accumulation of TGN has been shown to produce life-threatening bone marrow toxicity in TPMT deficient (no activity) individuals and less severe myelosuppression in TPMT heterozygote (intermediate activity) individuals 17. It is therefore very common for most protocols to incorporate assessment of TPMT enzyme activity of individuals at the beginning of treatment using phenotype or genotype 17. It is also very common for RBC 6-TGN levels and haematological parameters and liver function to be carefully monitored during extensive therapy 9,18.
Recently we developed a physiologically based pharmacokinetic (PBPK) model for 6-MP in childhood ALL using clinical data reported in the literature 19,20. The model was developed to account for distribution of drugs in certain tissues which will be linked with a disease model being developed for clinical trial simulation in the Child-Rare-Euro-Simulation (CRESim) project funded by a grant under ERA-NET PRIOMEDCHILD joint call of 2010 (http://www.priomedchild.eu/). The CRESim project involves the use of modelling and simulation to improve treatment outcomes in rare diseases, which in this case is childhood ALL with the selected drugs being methotrexate (MTX) and 6-MP. The published model only accounted for 6-MP concentration in plasma, RBC and other tissues. Therefore, the aims of this current work were to extend this model to account for 6-MP metabolite concentrations, especially 6-TGN in RBCs and to explore the role of genetic polymorphisms in TMPT enzyme activity on the pharmacokinetics (PK) of 6-MP in adults and children.
Methods
PBPK model development and assumptions
The proposed PBPK model was based on a published model 20 with 17 compartments: stomach, gut lumen, enterocyte, gut tissue, spleen, liver vascular, liver tissue, kidney vascular, kidney tissue, skin, bone marrow, thymus, muscle, rest of the body, RBC, platelets and lymphocytes (Figure1). These compartments were modelled using standard PBPK flow limited assumptions which can be described by equation (1)
| 1 |
where VT, CT, QT and Kp,T are the volume of distribution, concentration, plasma flow and tissue/plasma concentration ratio for the tissues and CP is the systemic plasma concentration (Tables1 and 2). The liver and kidney were each separated into vascular and tissue compartments with passive clearances: CLPASS,LIV and CLPASS,KID (10 000 times the value of plasma flows) between the two compartments. This allows a flow limited assumption to be preserved in each of these organs. The volumes of the vascular compartments were set to 10% of the volumes of each organ 21,22. 6-MP exchange between the plasma and RBCs was modelled using the permeability-surface area product (PSBC) assuming passive diffusion. Intracellular binding within the RBC was ignored in this model, as it has been shown that this does not significantly contribute to the distribution of 6-MP within RBCs 18,20. As shown in Figure1B, intracellular RBC distribution and metabolism of 6-MP was specifically accounted for in the model based on the scheme described in Derijks et al. 23. Following distribution of 6-MP into RBC, it is metabolized by TPMT and HGPRT enzymes into 6-methylmercaptopurine (6-MMP) and 6-thioinosine monophosphate (6-TIMP), respectively. 6-TIMP can be further metabolized by TPMT and inosine monophosphate dehydrogenase (IMPD) into 6-methyl thioinosine monophosphate and 6-TGN, respectively. Due to possible structural identifiability problems direct conversion from 6-TIMP into 6-TGN has been assumed, ignoring intermediate metabolites between these metabolites. Detailed modelling of these metabolic routes was only carried out for the RBC due to lack of data in the literature on 6-TGN, 6-MMPR or other metabolites in organs/tissues such as liver, kidney, lymphocytes and platelets but the general TPMT enzyme activity in RBC (CLR,TPMT), liver (CLL,TPMT) kidney (CLK,TMPT) platelets (CLP,TMPT) and lymphocytes (CLY,TMPT) were all accounted for in the model as routes of clearance. Maximum metabolic activity (Vmax, TMPT) in the different tissues and the Michaelis–Menten constant (Km, TMPT) were obtained from the literature (see Tables3 and 4) and were used to derive the clearances in the different organs/tissues. Metabolism by XO in the liver and gut were accounted for in the model by clearance parameters, CLL,XO and CLG,XO that allow elimination by these routes. These parameters were estimated using in vivo 6-MP plasma concentration data obtained from the literature 5,24, where due to the way the study was implemented the data allows XO activity in the liver and the gut to be separated 20. HGPRT is present in several tissues of the body, but it was impossible to account explicitly for the activity of this enzyme in these tissues due to lack of information on the activity of the enzyme in each one specifically. A clearance parameter (CLPLAS) linked to plasma concentration was therefore estimated to account for elimination other than by XO and TPMT. Absorption of 6-MP from the gut lumen was assumed to be complete (Fa = 1) and modelled via a first order absorption rate constant that is responsible for the transfer from the gut lumen into the intestine.
Figure 1.
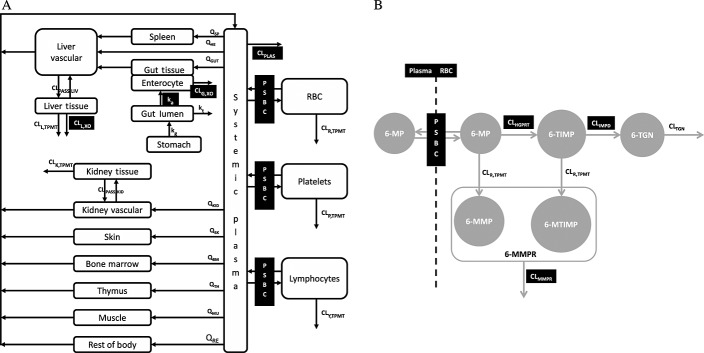
Schematic representation of the PBPK model for (A) 6-MP distribution and elimination in different tissues and (B) distribution and elimination of 6-MP in red blood cells (parameters with dark background were estimated; for definition of parameters see Table4)
Table 1.
Organ/tissue volumes (V) and plasma flows (Q) for adults and children and tissue/plasma partition ratios (Kp) for 6-MP used in the PBPK model
| Parameters* | Age(years) | Organs/Tissues | ||||||||||
|---|---|---|---|---|---|---|---|---|---|---|---|---|
| Plasma† | Muscle | Kidney | Liver | Gut | Enterocyte | Skin | Bone marrow | Spleen | Thymus | Rest of body | ||
| V (l)* | 0 | 0.1 | 0.8 | 0.03 | 0.1 | 0.2 | 0.01 | 0.2 | 0.05 | 0.01 | 0.01 | – ‡ |
| 1 | 0.3 | 1.9 | 0.07 | 0.3 | 0.3 | 0.02 | 0.4 | 0.15 | 0.03 | 0.03 | – | |
| 5 | 0.9 | 5.6 | 0.1 | 0.6 | 0.6 | 0.04 | 0.57 | 0.34 | 0.05 | 0.03 | – | |
| 10 | 1.5 | 11 | 0.2 | 0.8 | 0.9 | 0.07 | 0.8 | 0.6 | 0.08 | 0.04 | – | |
| 15 | 2.6 | 24 | 0.3 | 1.3 | 1.3 | 0.1 | 2 | 1.1 | 0.1 | 0.03 | – | |
| 18 | 2.9 | 29 | 0.3 | 1.8 | 1.7 | 0.1 | 3.3 | 1.2 | 0.2 | 0.03 | – | |
| Q (l h–1) | 0 | 15.2 | 0.9 | 3.2 | 1.1 | 2.4 | 0.9 | 0.9 | 0.5 | 0.5 | 0.2 | – § |
| 1 | 41.1 | 2.1 | 6.7 | 2.3 | 4.9 | 2.5 | 1.7 | 1.2 | 1.1 | 0.6 | – | |
| 5 | 90.7 | 7.1 | 19.3 | 7.4 | 15.9 | 5.5 | 5.7 | 2.7 | 3.4 | 1.36 | – | |
| 10 | 164.9 | 15.9 | 31.6 | 12.0 | 25.9 | 9.9 | 9.2 | 5.0 | 5.5 | 2.5 | – | |
| 15 | 196 | 32.7 | 43.3 | 14 | 30 | 11.8 | 10.8 | 5.9 | 6.4 | 2.9 | – | |
| 18 | 196 | 36.5 | 43.7 | 14 | 30 | 11.8 | 10.7 | 5.9 | 6.4 | 2.9 | – | |
| Kp | – | 0.8 | 0.83 | 0.82 | 0.85 | – | 0.78 | 0.64 | 0.84 | 0.84 | 0.2 | |
Table 2.
Other system parameters used for adults and children in the PBPK model for 6-MP
| Parameter* | Description | Age (years) | |||||
|---|---|---|---|---|---|---|---|
| 0 | 1 | 5 | 10 | 15 | 18 | ||
| VRBC (l) | Volume of red blood cells | 0.1 | 0.2 | 0.5 | 0.9 | 1.9 | 2.4 |
| VPlat (l) | Volume of platelets | 0.0006 | 0.001 | 0.003 | 0.006 | 0.01 | 0.01 |
| VLym (l) | Volume of lymphocytes | 0.0005 | 0.001 | 0.001 | 0.002 | 0.003 | 0.003 |
| kg (h–1) | Stomach emptying rate | 2 | 2 | 2 | 2 | 2 | 2 |
| kt (h–1) | Intestinal transit rate | 0.25 | 0.25 | 0.25 | 0.25 | 0.25 | 0.3 |
| BW (kg) | Body weight | 3.5 | 10 | 19 | 32 | 56 | 70 |
| HT (m) | Height | 0.5 | 0.8 | 1.1 | 1.4 | 1.67 | 1.8 |
Table 3.
Summary of TPMT enzyme activity in different tissues obtained from the literature used in the PBPK model
| Tissue | Phenotype | Vmax(mg l–1 h–1) | SD | Source |
|---|---|---|---|---|
| RBCs | wt/wt* | 2.05 | 0.28 | 8 |
| wt/v* | 1.10 | 0.16 | ||
| v/v | 0 | 0 | ||
| Liver | wt/wt | 58.06 | 8.14 | 32 |
| wt/v | 27.61 | 4.44 | ||
| v/v | 0 | 0 | ||
| Kidney | wt/wt | 35.15 | 9.0 | 33 |
| wt/v | 15.97 | 4.1 | ||
| v/v | 0 | 0 | ||
| Lymphocytes | wt/wt | 10.63 | 2.54 | 34 |
| wt/v | 6.23 | 1.70 | ||
| v/v | 0 | 0 | ||
| Platelets | wt/wt | 4.18 | 0.76 | 34 |
| wt/v | 2.48 | 0.68 | ||
| v/v | 0 | 0 |
wt, wild type
v, variant.
Table 4.
Other parameters including parameters estimated from fitting the PBPK model to plasma 6-MP and intracellular concentrations of 6-MP, 6-TGN and 6-MMPR
| Parameter | Definition | Estimate(%SE) | Source |
|---|---|---|---|
| MW (g) | Molecular weight | 152.2 | – |
| fu | Plasma fraction unbound | 0.81 | 7,48 |
| ka (h–1) | Absorption rate constant | 0.33 (161) | –† |
| CLG,XO,ad (l h–1) | Intestinal clearance due to XO | 18.7 (20) | –† |
| CLL,XO,ad (l h–1) | Hepatic clearance due to XO | 38.4 (22) | –† |
| CLPLAS,ad (l h–1) | Plasma clearance | 31.3 (11) | –† |
| PSBC (l h–1) | RBC permeability-surface area product | 50 | –* |
| CLHGPRT (l h–1) | Intracellular HGPRT clearance | 6.3 (30) | –† |
| CLIMPD (l h–1) | Intracellular IMPD clearance | 0.004 (37) | –† |
| CLMMPR (l h–1) | Intracellular MMPR clearance | 0.002 (41) | –† |
| CLTGN (l h–1) | Intracellular TGN clearance | 0.009 ⋅ BSA1.16 | 36 |
| Km,TPMT (mg l–1) | Michaelis–Menten constant | 45.65 | 35 |
| CPPGL (mg g–1) | Cytosolic protein g–1 of liver | 81 | 26 |
Fixed.
Estimated.
System parameters for adults and children
System specific parameters of the proposed PBPK model obtained from the literature for adults and children (see Tables1 and 2) included: organ/tissue volumes (V) 25,26, plasma flows (Q) 25,26, intestinal transit rate constant (kt) 25, gastric emptying rate constant (kg) 25, body weight (BW) 25, height (HT) 25 and haematocrit (HCT) 25. Adults were assumed to be 18 – 20 years old and 70 kg weight. Reference values for organ/tissue volumes and plasma flows in children at 0, 1, 5, 10 and 15 years of age were obtained from the literature 25. The reference values for plasma flows and organ/tissue volumes for adults and children were expressed as the fractions of the cardiac output (CO) and BW, respectively, for the different ages. Simple linear interpolation between fractions of plasma flows and organ/tissue volumes for the reference age groups was used to estimate values for ages in between. The reference value for adult CO was obtained from the literature and CO was predicted for children using the equation described by Johnson et al. 27. Reference values for BW, HT and HCT for children were also obtained from the literature and simple linear interpolation was used to obtain values between reference age groups 25,28. BW and HT were used to predict BSA for adults and children using equations proposed by Haycock & Dubois 29,30. The use of age-dependent changes in anatomical and physiological parameters such as plasma flows, organ/tissue volumes and other body size descriptors allows the model to be used for prediction of plasma and tissue concentrations following intravenous and oral dosing in both adults and children.
Drug specific parameters and parameter estimation
The tissue/plasma partition coefficients (Kp) for the different tissues were predicted using the equation proposed by Poulin et al. 31 and the value for the ‘rest of body’ compartment was calculated such that the predicted final Vss of the model was the same as the reported in vivo value in the literature. The same Kp values were assumed in adults and children. Also the same fraction unbound value was used for adults and children due to lack of information in the literature on the binding of 6-MP. Vmax 8,32–34 and Km values 35 (Tables3 and 4) were obtained from the literature for the activity of TPMT in the liver 32, kidney 33, RBCs 8, platelets 34 and lymphocytes 34. The same TPMT activity was assumed in adults and children due to lack of information in the literature on the effect of age on TPMT activity. However the volumes of the organs/tissues were allowed to change with age. Parameters such as ka, CLL,XO, CLG,XO, CLPLAS, PSBC, CLHGPRT, CLIMPD and CLMMPR were estimated using published plasma 6-MP concentrations and intracellular RBC concentrations of 6-MP and its metabolites 6-TGN and 6-MMPR (methylmercaptopurine ribonucleotide). The parameters were estimated from a simultaneous fitting of the model to mean data from four different studies, Zimm et al. 5,24, Lafolie et al. 18, Hawwa et al. 36 and Lennard et al. 37. Plasma concentration data for 6-MP were obtained from a study designed to investigate the effect of inhibition of first pass metabolism of 6-MP in rhesus monkeys and humans by allopurinol, a potent inhibitor of XO 5,24. The study was conducted in ALL children (mean age 13 years, range 3–18 years) who were in complete remission and were receiving maintenance chemotherapy. Plasma concentrations were obtained in this study following administration of a standard dose of 6-MP (75 mg m–2) by intravenous and oral routes (with and without co-administration of allopurinol). During co-medication with allopurinol, 100mg allopurinol was given three times daily for 2 days before 6-MP dosing. Plasma and intracellular concentrations of 6-MP were reported by Lafolie et al. 18 in a study performed in children with acute ALL or non-Hodgkin lymphoma receiving oral maintenance therapy. The children were 3–17 years old (mean age 9.6 years) and the mean dose used was 59 mg m–2. The exact time of the study after initiation of therapy was not specified in the publication. However because 6-MP is not expected to accumulate in plasma and RBCs due to its short half-life 5, a single dose setting was assumed. Hawwa et al. 36 reported intracellular RBC concentrations of 6-TGN and 6-MMPR from a clinical study performed in ALL children (mean age 10 years, range 3–17 years). Samples were collected from children who had been on continuous/maintenance oral 6-MP therapy (median dose 40, range 5.88–76.47 mg m–2) for at least 1 month. Lennard et al. 37 reported intracellular RBC 6-TGN concentrations for children studied from the start of 6-MP chemotherapy. The children (mean age 7.8 years, range 2–16 years) received 75 mg m–2 daily dose of 6-MP. The mean profiles of 6-MP in plasma, and 6-MP, 6-TGN and 6-MMPR in RBCs obtained from the four studies were used for parameter estimation. It was assumed that these profiles were from individuals with high 6-TPMT activity (wt/wt) since it was impossible to obtain mean profiles for plasma 6-MP and intracellular RBC 6-MP, 6-TGN and 6-MMPR concentrations for the different phenotypes from the literature. Also, individuals with high activity make up around 89% of the population from where these data were obtained. CLL,XO, CLG,XO and CLPLAS were normalized for a 70kg adult using allometry for scaling purposes:
| 2 |
| 3 |
| 4 |
Where CLG,XO,ad, CLL,XO,ad and CLPLAS,ad represent the adult values for the clearance parameters, BW and BWad are the weight for an individual and adults respectively.PSBC, CLHGPRT, CLIMPD and CLMMPR were assumed to be the same for adults and children, but RBC volume was allowed to change with age.
Variability in system and drug specific parameters
Variability in both system and drug specific parameters was introduced for simulation of individual plasma 6-MP and intracellular 6-MP, 6-TGN and 6-MMPR concentrations. The main sources of variability in the model for plasma flows were via BW and HT. Individual organ/tissue volume was simulated with variability on BW and individual CO was simulated with variability on BW and HT. Individual values for other system and drug specific parameters were simulated assuming a log normal distribution with a CV of 20%. Individual values of maximum TPMT enzyme metabolic activity (Vmax,TMPT) in the different tissues were simulated from a normal distribution using the reported mean and standard deviation (SD) from the literature.
Model validation using simulations
The performance of the developed PBPK model was evaluated using plasma 6-MP and intracellular 6-MP, 6-TGN and 6-MMPR data reported in the literature for different studies and age groups to those used for parameter optimization in the previous section. The model was assessed following oral dosing, in all cases attempts were made to match the study and the simulation in terms of age range, BSA, dose and route of administration. Simulations of 1000 virtual subjects was performed in all cases. The 2.5th, 50th and 97.5th percentiles were obtained for plasma 6-MP and intracellular 6-MP, 6-TGN and 6-MMPR concentrations and these were superimposed on the plots of observed published concentration vs. time data obtained from the literature. In some cases individual plasma 6-MP and intracellular 6-MP, 6-TGN and 6-MMPR concentration–time points were plotted and in others mean profiles with SD or standard error bars (SE) for each time point were plotted. Observed plasma 6-MP and intracellular 6-MP, 6-TGN and 6-MMPR concentration–time points published in the literature as plots were digitized using GetData Graph Digitizer 38. Simulations were also performed to investigate the role of genetic polymorphism in TPMT enzyme activity on the PK of 6-MP. In cases where mean concentrations of plasma 6-MP and intracellular RBC concentrations of 6-MP, 6-TGN and 6-MMPR were reported for the whole population, simulations were carried out using the distribution of the phenotypes in the population and in other cases where concentrations have been reported for the different groups, simulations were carried out for different phenotypic variants. In all simulations, a Caucasian population was assumed and the distribution of TPMT enzyme activity in the individuals in the groups was 89.9%, 10% and 0.1% for wt/wt, wt/v and v/v, respectively 10. The data used for model validation were obtained from Cheok et al. 13, Relling et al. 39, Lennard et al. 40, Chrzanowska et al. 41, Adam de Beaumais et al. 42 and Welch et al. 43. The data from Cheok et al. 13 and Relling et al. 39 were obtained from a study designed to investigate the effect of TPMT polymorphism on the pharmacogenetics of 6-MP toxicity. 6-MP was administered orally in this study to about 180 children (1–18 years) with ALL in two arms. In one arm conventional doses (65–85mg m–2) were given to children and in the other arm, individualized doses were given based on the toxicity experienced by the children. Intracellular RBC 6-TGN concentrations were measured in these subjects and measured TPMT enzyme activity in RBCs was also used to classify them into different TPMT phenotypes. The data from Lennard et al. 40 was obtained from a study conducted in 19 children (3 – 16 years) who received maintenance treatment for ALL. The children included in the study had received an oral standard dose (75 mg m–2) for a minimum of 7 consecutive days before the start of the study 40. Mean plasma 6-MP concentration–time profile with SD bars and intracellular RBC 6-TGN concentration after 7 days of treatment was obtained from this publication. Chrzanowska et al. 41 reported a study that was carried out in 19 children (4 – 16 years) who received maintenance chemotherapy orally for ALL. All children here received 50 mg m–2 of 6-MP daily 41 for a minimum of 1 month. The main aim of the study was to analyze any relationship between intracellular RBC concentration of 6-TGN and 6-MMPR metabolites in ALL children treated with 6-MP. 6-TGN and 6-MMPR concentrations were available at one time point per patient and these were assumed to have been taken after 1 month of treatment. The data from Adam de Beaumais et al. 42 was obtained from 20 children (2 – 15 years) with ALL who received 25 mg m–2 of oral 6-MP daily for 56 days, high dose MTX (5 g m–2 24 h i.v. infusion) was also administered at 14 days intervals 42. Intracellular RBC 6-TGN and 6-MMPR concentrations were determined from samples collected pre- and 72 h post-MTX infusion after 8, 22, 36 and 50 days of therapy. Due to the reduced dose of 6-MP (33% of standard dose) used in this study and the frequency of MTX dosing, the effect of MTX on 6-MP PK was not taken into account because this was expected to be negligible 19,20. The data from Welch et al. 43 were obtained following oral administration of 6-MP to seven children (2 – 6 years) with ALL 43. The main aim of the study was to examine the effect of high plasma 6-MP concentrations on intracellular RBC 6-MMPR concentrations at a standard protocol dose of 6-MP. The children received a standard dose (75 g m–2) of 6-MP daily for 16 – 52 weeks (median 29 weeks) and the data reported in the publication included 6-MP plasma, intracellular RBC 6-TGN and 6-MMPR concentrations obtained at 10 time points within one dosing interval from two individuals as well as single time point data from six individuals. Since the time of sampling was not specified, it was assumed that the data were obtained after 34 weeks (mid point) of continuous therapy.
Results
Differential equations describing the PBPK model were implemented in nonmem 44 and MATLAB 45 for parameter estimation (Table4) and simulation purposes, respectively. A summary of organ/tissue volumes and plasma flows for adults and children are shown in Table1. The Kps predicted for each tissue are also presented in Table1. Other system parameters used in the PBPK model for adults and children are presented in Table2. A summary of TPMT enzyme activity in the different tissues/organs from the literature is presented in Table3. Other parameters, including parameters that have been estimated and parameters obtained from the literature, are presented in Table4. Figure2 shows a simulated median profile, 95% prediction interval and the observed mean ± SD 6-MP plasma concentration data in children after intravenous and oral doing with and without allopurinol. The use of data from intravenous and oral routes with and without allopurinol allows estimation of parameters responsible for the first pass effect of 6-MP through the presence of XO in the gut (CLG,xo) and the liver (CLL,XO). It was assumed that the dose of allopurinol used in the study completely inhibited XO both in the liver and the gut 20. Figure3 shows simulated median profiles, 95% prediction intervals and observed plasma 6-MP and intracellular RBC 6-MP, TGN and MMPR concentrations from three different studies, Lafolie et al. 18, Hawwa et al. 36 and Lennard et al. 37. The mean of the data in Figures2 and 3 was used for parameter estimation. The simulated median lines in these figures represent the fitted lines.
Figure 2.
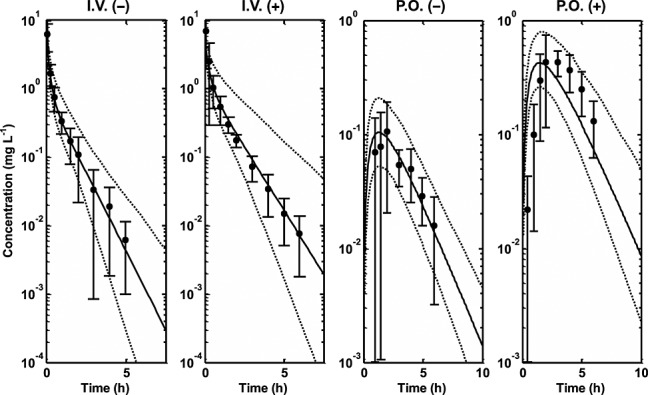
Simulated median profiles (continuous lines), 95% prediction intervals (broken lines) and observed mean data ± SD 6-MP plasma concentration data (filled circles and line bars) in children. i.v.(−), intravenous dosing without allopurinol; i.v.(+), intravenous dosing with allopurinol; p.o.(−), oral dosing without allopurinol; p.o.(+), oral dosing with allopurinol 5,24
Figure 3.
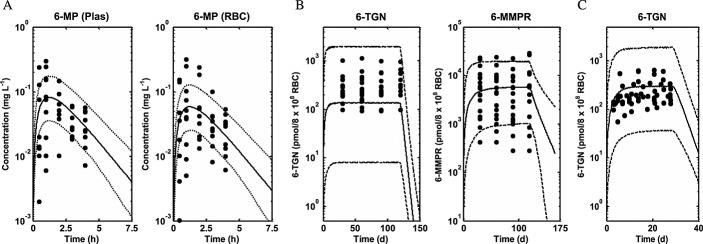
Simulated median profiles (continuous lines), 95% prediction intervals (broken lines) and observed plasma 6-MP and intracellular RBC 6-MP, 6-TGN and 6-MMPR concentration data (filled circles) from three different studies (A) Lafolie et al. 18, (B) Hawwa et al. 36 and (C) Lennard et al. 37
Figures4 and 5 show simulated profiles from the PBPK model and observed data for intracellular RBC 6-TGN obtained from the study described in Cheok et al. 13 and Relling et al. 39. Figure4 shows the simulated median profiles, 95% prediction intervals and box plots of the observed data (assuming measurement after 7 weeks) for intracellular RBC 6-TGN in different TPMT phenotypes following conventional and individualized dosing. Figure5 shows median profiles for plasma 6-MP and intracellular RBC 6-TGN and 6-MMPR in different TPMT phenotypes following conventional and individualized dosing. Figure6 shows the result of the model validation using data obtained from Lennard et al. 40 for comparison. The plasma data in Figure6 represent the observed mean ± SD bars at each time point and the 6-TGN data are single time point concentrations from individuals in the study. The outcome of the model validation using data obtained from Chrzanowska et al. 41 is shown in Figure7. The data in this figure represent individual measured concentrations from the children. Figure8 shows the performance of the model compared with data obtained from Adam de Beaumais et al. 42. The data in Figure8 represent observed mean ± SD bars for intracellular RBC 6-TGN and 6-MMPR measurements. Figure9 shows the prediction of the data obtained from Welch et al. 43 showing the observed data and the model prediction for 6-MP plasma, intracellular RBC 6-TGN and 6-MMPR measurements within one dosing interval after 34 weeks of continuous therapy. For clarity, the intracellular RBC 6-TGN and 6-MMPR data and predictions within the dosing interval (when sampling took place) are shown separately.
Figure 4.
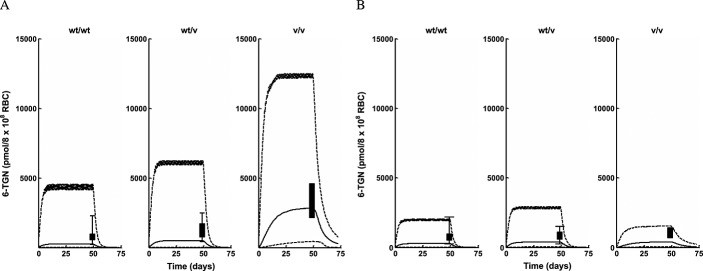
Intracellular RBC 6-TGN median profiles (continuous lines), 95% prediction intervals (broken lines) and box plots of observed data from different TPMT enzyme polymorphic groups following (A) conventional dosing (B) individualized dosing 13,39
Figure 5.
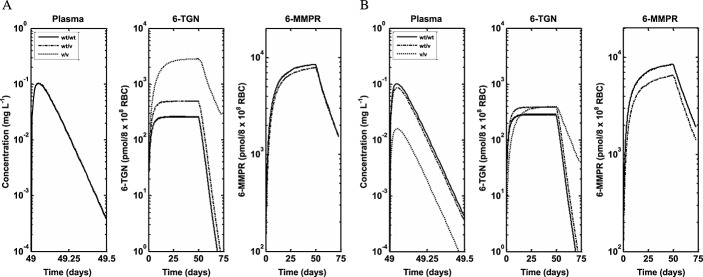
Simulated median profiles for plasma 6-MP and intracellular RBC 6-TGN and 6-MMPR for different TPMT enzyme polymorphic groups following (A) conventional dosing and (B) individualized dosing 13,39
Figure 6.
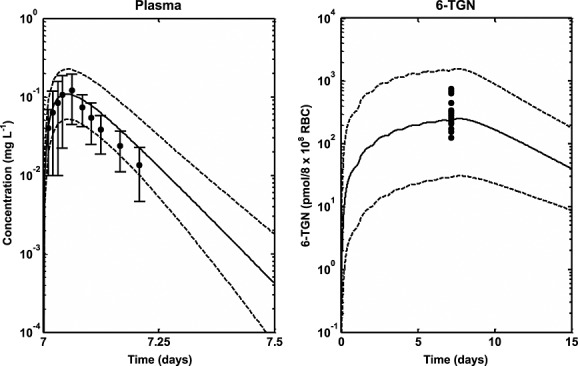
Median profiles (continuous lines), 95% prediction intervals (broken lines) and observed data for plasma 6-MP (filled circles and line bars) and intracellular RBC 6-TGN (filled circles) following oral dosing of 6-MP in ALL children who received standard dose (75 mg m–2) for a minimum of 7 consecutive days 40
Figure 7.
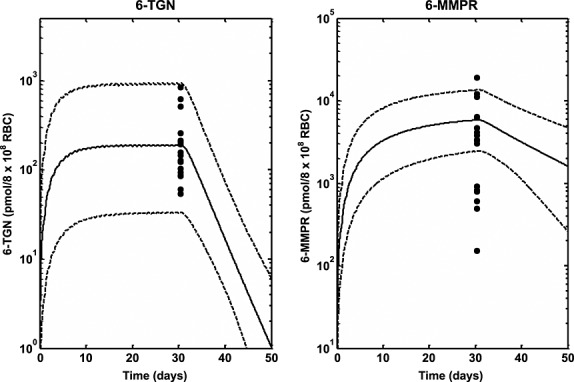
Median profiles (continuous lines), 95% prediction intervals (broken lines) and observed data (filled circles) for intracellular RBC 6-TGN and 6-MMPR following oral dosing of 6-MP (50 mg m–2 daily) in ALL children for at least 1 month 41
Figure 8.
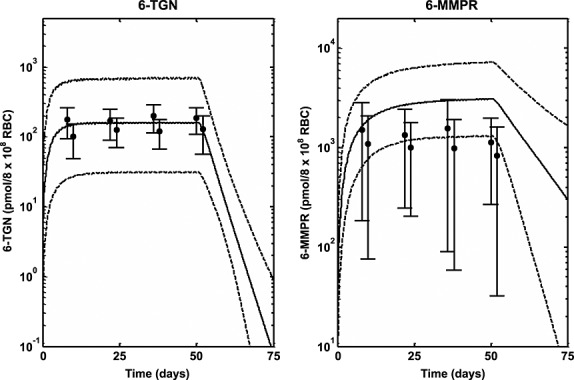
Median profiles (continuous lines), 95% prediction intervals (broken lines) and observed data (filled circles and line bars) for intracellular RBC 6-TGN and 6-MMPR following oral dosing of 6-MP (25 mg m–2 daily) in ALL children for 56 days 42
Figure 9.
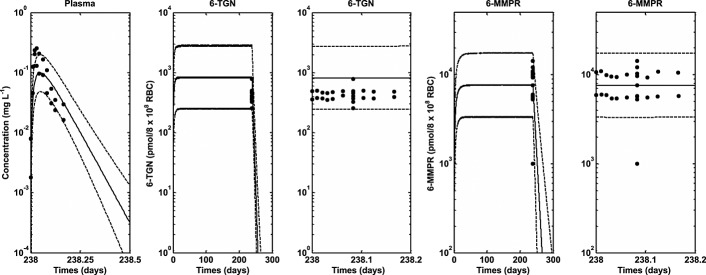
Median profiles (continuous lines), 95% prediction intervals (broken lines) and observed data (filled circles) for plasma 6-MP and intracellular RBC 6-TGN and 6-MMPR following oral dosing of 6-MP (75 mg m–2 daily) in ALL children for 34 weeks (6-MP and 6-MMPR predictions and data during the dosing interval only has been included) 43
Discussion
This work has extended the model developed for 6-MP in children and adults to include prediction of intracellular concentrations of 6-MP metabolites in RBC using genetic information regarding TPMT enzyme activity. The model has been used to explore the role of genetic polymorphism in TPMT enzyme activity on the PK of 6-MP especially in the prediction of intracellular RBC concentrations of 6-MP and its metabolites 6-TGN and 6-MMPR. The developed PBPK model was based on in vitro–in vivo extrapolation (IVIVE) 46 with physiological system parameters such as organ/tissue volumes and plasma flows obtained from the literature, while drug specific parameters were either obtained from the literature or estimated using published concentrations of plasma 6-MP and intracellular RBC concentrations of 6-MP, 6-TGN and 6-MMPR (from datasets separate to those used for later validation of the model). Age-dependent changes in anatomical and physiological parameters were used in the model for system parameters, while drug parameters were scaled using allometry or assumed to be the same as adults. This approach allows data from different age groups to be combined for parameter estimation and also allows the model to be used for prediction of plasma and tissue profiles in both adults and children. The intracellular RBC concentrations of 6-MP, 6-TGN and 6-MMPR used for parameter estimation did not include information about the TPMT phenotype of individuals used because this information was not available for the datasets. It was assumed then that these individuals had high activity since this phenotype constitutes about 89% of individuals in most populations. The same level of TPMT activity in adults has been assumed in children. This is due to a lack of information in the literature about the maturation of this enzyme (compared with, for example, that available for the cytochrome P450 enzymes 27,47). The model can however be extended to account for this information as it becomes available to improve its performance further. The results of the parameter estimation in Table4 and Figures2 and 3 show satisfactory performance. The parameters were estimated with reasonable precision with %RSE low or moderate for most parameters except for ka whose %RSE had a high value (131%). This is probably due to the lack of data in the rising, absorption phase of the 6-MP plasma concentration profiles which is where the information required for estimation of this parameter lies. The median profiles and the 95% prediction intervals for plasma 6-MP and intracellular 6-MP, 6-TGN and 6-MMPR also show satisfactory description of the data by the modelled fit and coverage of the variability in the data, respectively. However in Figure3B it appears the median profile underpredicts the data and in Figure3B and C the prediction interval over predicts the variability in the data.
The role of genetic polymorphism in the PK of 6-MP was also explored using simulations based on the developed PBPK model. The data used to validate the predictions was obtained from the literature. As described under results, the study whose data was used was designed to investigate the effect of polymorphism in TPMT activity on pharmacogenetics of 6-MP toxicity 13,39. Individuals enrolled in the two arms of the study (conventional and individualized dosing) were followed for 2.5 years. In the conventional arm, the cumulative incidence of 6-MP haematopoietic toxicity was highest (100%) in the patients homozygously mutant for TPMT (v/v), intermediate (35%) among heterozygous patients (wt/v) and lowest (7%) among wild-type patients (wt/wt). When dosing was individualized in patients, the cumulative incidence of toxicity was comparable between the three groups (less than 10%). During dose individualization, the dose for wt/wt patients was slightly reduced (528 ± 90 mg m–2 weekly), for wt/v patients a modest reduction of 35–50% was achieved (449 ± 160 mg m–2 weekly) and for v/v patients the reduction was around 90% (72 ± 60 mg m–2 weekly). There was excellent agreement between the incidence of haematopoietic toxicity following both conventional and individualized dosing and the intracellular RBC 6-TGN level. The levels of intracellular RBC 6-TGN in the three groups was in the order v/v, wt/v and wt/wt (highest to lowest), which corresponds to the 100%, 35% and 7% incidence of toxicity observed in the three groups, respectively, following conventional dosing. In addition to the correlation between incidences of haematopoietic toxicity and intracellular RBC 6-TGN concentrations obtained in the clinical trial, these results also show that the intracellular RBC 6-TGN concentration is inversely related to TPMT enzyme activity. Following individualized dosing, the similar levels of intracellular RBC 6-TGN then obtained between v/v, wt/v and wt/wt also compared favourably with similar levels of incidence of haematopoietic toxicity (less than 10%) for all the groups. The PBPK model developed in the present work was used to predict the reported intracellular RBC 6-TGN concentration in this study and the results presented in Figure4 are encouraging. The median lines appear to underpredict slightly the central tendency of the data and the prediction intervals appear to over predict the variability in the data, but, overall, the trend in the observed data were well predicted. Variability predicted by the model was lower for individualized dosing compared with conventional dosing. There was some difference between the prediction intervals for wt/wt for conventional and individualized dosing because different doses were used on both occasions. The dose in the latter was also individualized. The mean profiles for plasma 6-MP, intracellular 6-TGN and 6-MMPR for both conventional and individualized dosing show interesting results (Figure5). The mean plasma 6-MP profiles for the three phenotypes following conventional dosing (Figure5A) are similar as expected because patients in the three groups received the same dose. However there are big differences in the intracellular RBC level of 6-TGN between the three groups. The concentration is about 10 times and twice the levels in wt/wt vs. v/v and wt/v, respectively. The concentrations of intracellular RBC 6-MMPR are fairly similar for wt/wt and wt/v, with wt/v levels slightly lower. Intracellular RBC 6-MMPR was not produced by the v/v phenotype because it was assumed in the model that this group had no TPMT activity which was also consistent with the undetectable level of intracellular RBC 6-MMPR reported in the literature for this group 39. Following individualized dosing (Figure5B), there were differences in the plasma 6-MP profiles between wt/wt and wt/v and v/v, which was consistent with the difference in the doses for the three groups. However despite the marked differences in doses and plasma 6-MP profiles between the groups, the intracellular levels of RBC 6-TGN were roughly the same for the three groups with only a small difference in the level of intracellular RBC 6-MMPR between wt/wt and wt/v phenotypes. The mean levels of intracellular RBC 6-TGN predicted by the model following conventional and individualized dosing were therefore consistent with observed data and also with the reported incidence of haematopoietic toxicity reported for the different phenotypes in the study. These results highlight an important benefit of using a PBPK model for analysis of this type of data, as it allows concentrations of the drug in the tissue of interest to be evaluated. As shown by the results above the most relevant tissue is RBCs which has also been shown to be relevant for therapeutic activity.
The results of the simulations in Figures9 for plasma 6-MP and intracellular RBC 6-TGN and 6-MMPR also show satisfactory results. The model was used to simulate observed data obtained from different studies where different doses were used for different study lengths. The prediction intervals adequately predicted the variability in the data. In these studies the profiles were not separated for different phenotypes. Therefore reported distributions of different phenotypes in the population were used for the simulations. The prediction intervals are wide because of the wide ranges in age and doses used for the children in the different studies.
This work represents an attempt to develop a model that incorporates information on the intracellular metabolism of 6-MP as well as the effect of genetic polymorphism in TPMT enzyme activity on the PK of 6-MP, especially on the intracellular concentration of 6-TGN in RBCs which has been linked to activity and toxicity. As described above the results can be described as encouraging, and the model has the potential to also be extended to include genotype information which has been described for the TPMT enzyme. However the performance and relevance of the model could still be further improved by a well-designed clinical study for 6-MP that has modelling of the concentration data obtained as one of its core aims. The data that have been used for the present work have been obtained from the literature across several different studies, spread across many years and locations, and with different patient populations, with potential therefore for random variation and inconsistencies that cannot be accounted for. A future study could be designed using the model reported in this work to plan different aspects of future clinical work. Plasma 6-MP and intracellular concentrations of 6-MP, 6-TGN and 6-MMPR could then be obtained in a way that they will provide more adequate and useful information for parameter estimation and model validation.
In conclusion a PBPK model has been developed for 6-MP which can be used to predict plasma concentrations of 6-MP and tissue concentrations of 6-MP, 6-TGN and 6-MMPR in adults and children. The model may help to improve 6-MP dosing to achieve better clinical outcome and reduce toxicity.
Competing Interests
All authors have completed the Unified Competing Interest form at www.icmje.org/coi_disclosure.pdf (available on request from the corresponding author) and declare KO and LA had support from ERA-NET PrioMedChild (Priority Medicines for Children) for the submitted work, no financial relationships with any organizations that might have an interest in the submitted work in the previous 3 years and no other relationships or activities that could appear to have influenced the submitted work.
This work was performed as part of Child-Rare-Euro-Simulation project. CRESim was funded by the ERA-NET PRIOMEDCHILD Joint Call in 2010. Members of the CRESim Project Group: Leon Aarons, Agathe Bajard, Clément Ballot, Yves Bertrand, Frank Bretz; Daan Caudri, Charlotte Castellan, Sylvie Chabaud, Catherine Cornu, Frank Dufour, Nathalie Eymard, Roland Fisch, Renzo Guerrini, Vincent Jullien, Behrouz Kassaï, Patrice Nony, Kayode Ogungbenro, David Pérol, Gérard Pons, Harm Tiddens and Anna Rosati. Members of the Epi-CRESim Project Group: Corinne Alberti, Catherine Chiron, Catherine Cornu, Polina Kurbatova and Rima Nabbout.
The authors also acknowledge helpful discussions with Dr Aleksandra Galetin, Dr Michael Gertz, Dr Eleanor Howgate, Dr Henry Pertinez, Nikolaos Tsamandouras, Adam Darwich and members of the Centre for Applied Pharmacokinetics Research, Manchester Pharmacy School.
References
- 1.Erb N, Harms DO, Janka-Schaub G. Pharmacokinetics and metabolism of thiopurines in children with acute lymphoblastic leukemia receiving 6-thioguanine versus 6-mercaptopurine. Cancer Chemother Pharmacol. 1998;42:266–72. doi: 10.1007/s002800050816. [DOI] [PubMed] [Google Scholar]
- 2.Lennard L. The clinical pharmacology of 6-mercaptopurine. Eur J Clin Pharmacol. 1992;43:329–39. doi: 10.1007/BF02220605. [DOI] [PubMed] [Google Scholar]
- 3.Endresen L, Lie SO, Stormmathisen I, Rugstad HE, Stokke O. Pharmacokinetics of oral 6-mercaptopurine - relationship between plasma levels and urine excretion of parent drug. Ther Drug Monit. 1990;12:227–34. [PubMed] [Google Scholar]
- 4.Pui CH, Campana D, Pei DQ, Bowman WP, Sandlund JT, Kaste SC, Ribeiro RC, Rubnitz JE, Raimondi SC, Onciu M, Coustan-Smith E, Kun LE, Jeha S, Cheng C, Howard SC, Simmons V, Bayles A, Metzger ML, Boyett JM, Leung W, Handgretinger R, Downing JR, Evans WE, Relling MV. Treating childhood acute lymphoblastic leukemia without cranial irradiation. N Engl J Med. 2009;360:2730–41. doi: 10.1056/NEJMoa0900386. [DOI] [PMC free article] [PubMed] [Google Scholar]
- 5.Zimm S, Collins JM, Riccardi R, O'Neill D, Narang PK, Chabner B, Poplack DG. Variable bioavailability of oral mercaptopurine. Is maintenance chemotherapy in acute lymphoblastic leukemia being optimally delivered? N Engl J Med. 1983;308:1005–9. doi: 10.1056/NEJM198304283081705. [DOI] [PubMed] [Google Scholar]
- 6.Lonnerholm G, Kreuger A, Lindstrom B, Ludvigsson J, Myrdal U. Plasma and erythrocyte concentrations of mercaptopurine after oral administration in children. Pediatr Hematol Oncol. 1986;3:27–35. doi: 10.3109/08880018609031198. [DOI] [PubMed] [Google Scholar]
- 7.Loo TL, Luce JK, Sullivan MP, Frei E., III Clinical pharmacologic observations on 6-mercaptopurine and 6-methylthiopurine ribonucleoside. Clin Pharmacol Ther. 1968;9:180–94. doi: 10.1002/cpt196892180. [DOI] [PubMed] [Google Scholar]
- 8.Weinshilboum RM, Sladek SL. Mercaptopurine pharmacogenetics - monogenic inheritance of erythrocyte thiopurine methyltransferase activity. Am J Hum Genet. 1980;32:651–62. [PMC free article] [PubMed] [Google Scholar]
- 9.Krynetski E, Evans W. Pharmacogenetics as a molecular basis for individualized drug therapy: the thiopurine S-methyltransferase paradigm. Pharm Res. 1999;16:342–9. doi: 10.1023/a:1011909315614. [DOI] [PubMed] [Google Scholar]
- 10.McLeod HL, Krynetski EY, Relling MV, Evans WE. Genetic polymorphism of thiopurine methyltransferase and its clinical relevance for childhood acute lymphoblastic leukemia. Leukemia. 2000;14:567–72. doi: 10.1038/sj.leu.2401723. [DOI] [PubMed] [Google Scholar]
- 11.Krynetski EY, Tai HL, Yates CR, Fessing MY, Loennechen T, Schuetz JD, Relling MV, Evans WE. Genetic polymorphism of thiopurine S-methyltransferase: Clinical importance and molecular mechanisms. Pharmacogenetics. 1996;6:279–90. doi: 10.1097/00008571-199608000-00001. [DOI] [PubMed] [Google Scholar]
- 12.Wang L, Weinshilboum R. Thiopurine S-methyltransferase pharmacogenetics: insights, challenges and future directions. Oncogene. 2006;25:1629–38. doi: 10.1038/sj.onc.1209372. [DOI] [PubMed] [Google Scholar]
- 13.Cheok MH, Evans WE. Acute lymphoblastic leukaemia: a model for the pharmacogenomics of cancer therapy. Nat Rev Cancer. 2006;6:117–29. doi: 10.1038/nrc1800. [DOI] [PubMed] [Google Scholar]
- 14.Lennard L, Rees CA, Lilleyman JS, Maddocks JL. Childhood leukemia - a relationship between intracellular 6-mercaptopurine metabolites and neutropenia. Br J Clin Pharmacol. 1983;16:359–63. doi: 10.1111/j.1365-2125.1983.tb02178.x. [DOI] [PMC free article] [PubMed] [Google Scholar]
- 15.Appell ML, Berg J, Duley J, Evans WE, Kennedy MA, Lennard L, Marinaki T, McLeod HL, Relling MV, Schaeffeler E, Schwab M, Weinshilboum R, Yeoh AEJ, McDonagh EM, Hebert JM, Klein TE, Coulthard SA. Nomenclature for alleles of the thiopurine methyltransferase gene. Pharmacogenet Genomics. 2013;23:242–8. doi: 10.1097/FPC.0b013e32835f1cc0. [DOI] [PMC free article] [PubMed] [Google Scholar]
- 16.Lennard L. Therapeutic drug monitoring of antimetabolic cytotoxic drugs. Br J Clin Pharmacol. 1999;47:131–43. doi: 10.1046/j.1365-2125.1999.00884.x. [DOI] [PMC free article] [PubMed] [Google Scholar]
- 17.Lennard L, Cartwright CS, Wade R, Richards SM, Vora A. Thiopurine methyltransferase genotype–phenotype discordance and thiopurine active metabolite formation in childhood acute lymphoblastic leukaemia. Br J Clin Pharmacol. 2013;76:125–36. doi: 10.1111/bcp.12066. [DOI] [PMC free article] [PubMed] [Google Scholar]
- 18.Lafolie P, Hayder S, Bjork O, Ahstrom L, Liliemark J, Peterson C. Large interindividual variations in the pharmacokinetics of oral 6-mercaptopurine in maintenance therapy of children with acute leukaemia and non-Hodgkin lymphoma. Acta Paediatr Scand. 1986;75:797–803. doi: 10.1111/j.1651-2227.1986.tb10293.x. [DOI] [PubMed] [Google Scholar]
- 19.Ogungbenro K, Aarons L. Physiologically based pharmacokinetic modelling of methotrexate and 6-mercaptopurine in adults and children. Part 1: methotrexate. J Pharmacokinet Pharmacodyn. 2014;41:159–71. doi: 10.1007/s10928-014-9354-4. [DOI] [PubMed] [Google Scholar]
- 20.Ogungbenro K, Aarons L. Physiologically based pharmacokinetic modelling of methotrexate and 6-mercaptopurine in adults and children. Part 2: 6-mercaptopurine and its interaction with methotrexate. J Pharmacokinet Pharmacodyn. 2014;41:173–85. doi: 10.1007/s10928-014-9355-3. [DOI] [PubMed] [Google Scholar]
- 21.Kawai R, Mathew D, Tanaka C, Rowland M. Physiologically based pharmacokinetics of cyclosporine A: extension to tissue distribution kinetics in rats and scale-up to human. J Pharmacol Exp Ther. 1998;287:457–68. [PubMed] [Google Scholar]
- 22.Gertz M, Cartwright CM, Hobbs MJ, Kenworthy KE, Rowland M, Houston JB, Galetin A. Cyclosporine inhibition of hepatic and intestinal CYP3A4, uptake and efflux transporters: application of PBPK modeling in the assessment of drug-drug interaction potential. Pharm Res. 2013;30:761–80. doi: 10.1007/s11095-012-0918-y. [DOI] [PubMed] [Google Scholar]
- 23.Derijks LJ, Gilissen LP, Engels LG, Bos LP, Bus PJ, Lohman JJ, Curvers WL, Van Deventer SJ, Hommes DW, Hooymans PM. Pharmacokinetics of 6-mercaptopurine in patients with inflammatory bowel disease: implications for therapy. Ther Drug Monit. 2004;26:311–8. doi: 10.1097/00007691-200406000-00016. [DOI] [PubMed] [Google Scholar]
- 24.Zimm S, Collins JM, O'Neill D, Chabner BA, Poplack DG. Inhibition of first-pass metabolism in cancer chemotherapy: interaction of 6-mercaptopurine and allopurinol. Clin Pharmacol Ther. 1983;34:810–7. doi: 10.1038/clpt.1983.254. [DOI] [PubMed] [Google Scholar]
- 25.Valentin J. Basic anatomical and physiological data for use in radiological protection: reference values: ICRP Publication 89. Ann ICRP. 2002;32:1–277. [PubMed] [Google Scholar]
- 26.Jamei M, Turner D, Yang J, Neuhoff S, Polak S, Rostami-Hodjegan A, Tucker G. Population-based mechanistic prediction of oral drug absorption. AAPS J. 2009;11:225–37. doi: 10.1208/s12248-009-9099-y. [DOI] [PMC free article] [PubMed] [Google Scholar]
- 27.Johnson TN, Rostami-Hodjegan A, Tucker GT. Prediction of the clearance of eleven drugs and associated variability in neonates, infants and children. Clin Pharmacokinet. 2006;45:931–56. doi: 10.2165/00003088-200645090-00005. [DOI] [PubMed] [Google Scholar]
- 28.Yip R, Johnson C, Dallman PR. Age-related changes in laboratory values used in the diagnosis of anemia and iron deficiency. Am J Clin Nutr. 1984;39:427–36. doi: 10.1093/ajcn/39.3.427. [DOI] [PubMed] [Google Scholar]
- 29.Haycock GB, Schwartz GJ, Wisotsky DH. Geometric method for measuring body surface area: a height-weight formula validated in infants, children, and adults. J Pediatr. 1978;93:62–6. doi: 10.1016/s0022-3476(78)80601-5. [DOI] [PubMed] [Google Scholar]
- 30.DuBois D, DuBois EF. A formula to estimate the approximate surface area if height and weight be known. Arch Intern Med. 1916;17:863–71. [Google Scholar]
- 31.Poulin P, Theil FP. A priori prediction of tissue:plasma partition coefficients of drugs to facilitate the use of physiologically-based pharmacokinetic models in drug discovery. J Pharm Sci. 2000;89:16–35. doi: 10.1002/(SICI)1520-6017(200001)89:1<16::AID-JPS3>3.0.CO;2-E. [DOI] [PubMed] [Google Scholar]
- 32.Szumlanski CL, Honchel R, Scott MC, Weinshilboum RM. Human liver thiopurine methyltransferase pharmacogenetics – biochemical properties, liver-erythrocyte correlation and presence of isozymes. Pharmacogenetics. 1992;2:148–59. [PubMed] [Google Scholar]
- 33.Vanloon JA, Weinshilboum RM. Thiopurine methyltransferase isozymes in human renal tissue. Drug Metab Dispos. 1990;18:632–8. [PubMed] [Google Scholar]
- 34.Van Loon JA, Weinshilboum RM. Thiopurine methyltransferase biochemical genetics: human lymphocyte activity. Biochem Genet. 1982;20:637–58. doi: 10.1007/BF00483962. [DOI] [PubMed] [Google Scholar]
- 35.Woodson LC, Weinshilboum RM. Human kidney thiopurine methyltransferase. Purification and biochemical properties. Biochem Pharmacol. 1983;32:819–26. doi: 10.1016/0006-2952(83)90582-8. [DOI] [PubMed] [Google Scholar]
- 36.Hawwa AF, Collier PS, Millership JS, McCarthy A, Dempsey S, Cairns C, McElnay JC. Population pharmacokinetic and pharmacogenetic analysis of 6-mercaptopurine in paediatric patients with acute lymphoblastic leukaemia. Br J Clin Pharmacol. 2008;66:826–37. doi: 10.1111/j.1365-2125.2008.03281.x. [DOI] [PMC free article] [PubMed] [Google Scholar]
- 37.Lennard L, Lilleyman JS. Variable mercaptopurine metabolism and treatment outcome in childhood lymphoblastic leukemia. J Clin Oncol. 1989;7:1816–23. doi: 10.1200/JCO.1989.7.12.1816. [DOI] [PubMed] [Google Scholar]
- 38.2013. GetData Graph Digitizer, getdata-graph-digitizer.com/
- 39.Relling MV, Hancock ML, Rivera GK, Sandlund JT, Ribeiro RC, Krynetski EY, Pui C-H, Evans WE. Mercaptopurine therapy intolerance and heterozygosity at the thiopurine S-methyltransferase gene locus. J Natl Cancer Inst. 1999;91:2001–8. doi: 10.1093/jnci/91.23.2001. [DOI] [PubMed] [Google Scholar]
- 40.Lennard L, Keen D, Lilleyman JS. Oral 6-mercaptopurine in childhood leukemia: parent drug pharmacokinetics and active metabolite concentrations. Clin Pharmacol Ther. 1986;40:287–92. doi: 10.1038/clpt.1986.178. [DOI] [PubMed] [Google Scholar]
- 41.Chrzanowska M, Kolecki P, Duczmal-Cichocka B, Fiet J. Metabolites of mercaptopurine in red blood cells: a relationship between 6-thioguanine nucleotides and 6-methylmercaptopurine metabolite concentrations in children with lymphoblastic leukemia. Eur J Pharm Sci. 1999;8:329–34. doi: 10.1016/s0928-0987(99)00027-5. [DOI] [PubMed] [Google Scholar]
- 42.Adam de Beaumais T, Dervieux T, Fakhoury M, Medard Y, Azougagh S, Zhang D, Yakouben K, Jacqz-Aigrain E. The impact of high-dose methotrexate on intracellular 6-mercaptopurine disposition during interval therapy of childhood acute lymphoblastic leukemia. Cancer Chemother Pharmacol. 2010;66:653–8. doi: 10.1007/s00280-009-1205-4. [DOI] [PubMed] [Google Scholar]
- 43.Welch J, Lennard L, Morton GC, Lilleyman JS. Pharmacokinetics of mercaptopurine: plasma drug and red cell metabolite concentrations after an oral dose. Ther Drug Monit. 1997;19:382–5. doi: 10.1097/00007691-199708000-00003. [DOI] [PubMed] [Google Scholar]
- 44.Beal S, Sheiner LB, Boeckmann A. Guides User's. Icon Development Solutions. MD, USA: Ellicott City; 1989. Bauer RJ. NONMEM, 2009. [Google Scholar]
- 45.MATLAB. 2013a. 8.1.0.604. Natick, Massachusetts: The MathWorks Inc.
- 46.Rostami-Hodjegan A, Tucker GT. Simulation and prediction of in vivo drug metabolism in human populations from in vitro data. Nat Rev Drug Discov. 2007;6:140–8. doi: 10.1038/nrd2173. [DOI] [PubMed] [Google Scholar]
- 47.Salem F, Johnson TN, Barter ZE, Leeder JS, Rostami-Hodjegan A. Age related changes in fractional elimination pathways for drugs: assessing the impact of variable ontogeny on metabolic drug-drug interactions. J Clin Pharmacol. 2013;53:857–65. doi: 10.1002/jcph.100. [DOI] [PubMed] [Google Scholar]
- 48.Goodman LS, Gilman A. In: Goodman & Gilman's the pharmacological basis of therapeutics. Gilman AG, Hardman JG, Limbird L, Rall T, editors. New York, London: McGraw-Hill, Health Professions Division; 1996. [Google Scholar]


