

Abstract
Aims
Anrukinzumab is an anti-IL13 monoclonal antibody. The goals of this study are to characterize the pharmacokinetics of anrukinzumab in healthy volunteers and different disease states and to identify covariates.
Methods
A population pharmacokinetic (PK) model was developed in NONMEM, using data from five clinical studies including healthy volunteers, asthma and ulcerative colitis (UC) patients. Different dosing regimens including different routes of administration were also included in the data.
Results
The PK of anrukinzumab were described by a two compartment model with first order absorption and elimination. The population estimates (relative standard error) of the volumes of distribution in the central (Vc) and peripheral (Vp) compartments were 3.8 (4.6%) and 2.2 l (8.7%), respectively. In non-UC patients, the population estimate of the systemic clearance (CL) and inter-compartmental CL was 0.00732 l h–1 (4.9%) and 0.0224 l h–1 (15.4%). For subcutaneous administration, the absorption rate constant was 0.012 h–1 (6.6%) and bioavailability was nearly 100% in healthy and mild to moderate asthma patients. Both V and CL increased with body weight. CL (but not V) decreased with increasing baseline albumin concentrations. UC patients had an increased CL of 72.3% (10.5%), after correction for differences in body weight and albumin. Moderate to severe asthma patients had decreased bioavailability compared with other populations.
Conclusions
Anrukinzumab's PK behave like a typical antibody. UC patients were identified to have a faster CL of anrukinzumab than healthy volunteers and asthma patients. This finding suggests a higher dose level may be required for this population.
Keywords: population PK, pharmacokinetics, monoclonal antibody, IL13, asthma, ulcerative colitis, NONMEM, IMA-638, anrukinzumab, healthy volunteers
What is Already Known about this Subject
Anrukinzumab is an anti-IL13 antibody which has been tested in healthy volunteers, asthma and ulcerative colitis (UC) patients. Its pharmacokinetics (PK) have not been described before.
What this Study Adds
This is the first published analysis to compare pharmacokinetics for a monoclonal antibody in healthy volunteers, asthma patients and UC patients using a single population PK model. The results suggest that UC patients have faster clearance for anrukinzumab than asthma patients and healthy volunteers.
Introduction
Interleukin-IL13 (IL-13) is a type 2 cytokine and plays a critical role in regulating inflammatory immune responses 1. It has effects on many cell types including B cells, monocytes, macrophages, epithelial cells, smooth muscle cells and neurons 1. Due to the pleiotropic effects of IL-13, it has been indicated in the pathogenesis of many diseases including asthma 2,3[], scleroderma 4 as well as inflammatory bowel diseases 5,6[].
Anrukinzumab is a humanized anti-IL13 monoclonal antibody (IgG1) that inhibits the downstream signal of IL-13/IL-13Rα1 through a blocking interaction between IL-13 and IL-4Ra. It does not inhibit the IL-13 interaction with IL-13Rα1 or IL-13Rα2 7,8[]. Anrukinzumab has been tested in asthma and ulcerative colitis (UC) patients in phase II studies. In addition, it has also been tested in healthy volunteers during early development.
In drug development, doses are often chosen to achieve targeted exposure that will provide the desired pharmacological effect. If disease states impact on pharmacokinetic (PK) parameters and, consequently, exposure, different doses may be needed in different indications. For example, for infliximab, an anti-TNF antibody therapeutics, dosing recommendation for inflammatory bowel diseases (IBD) (5 mg kg–1 every 8 weeks) is higher than for rheumatoid arthritis (3 mg kg–1 every 8 weeks) 9. The higher dose required for infliximab in IBD may be due to lower exposure than in other diseases. However, this hypothesis cannot be supported by published population PK models for infliximab for multiple indications 10–13. Clearance (CL) of infliximab in UC is 0.017 l h–1 10 and CL in RA is 0.019 l h–1 12 indicating slightly higher CL than in UC. However, without a combined analysis, it is difficult to determine whether a small difference is significant. CL in ankylosing spondylitis (0.0010–0.011 l h–1) has been reported by another independent population PK analysis and was lower than in both UC and RA 11,13[]. In addition, there is no PK information available for infliximab in healthy volunteers. Applying covariate analysis using a single population PK model to incorporate all available PK data from various disease states and healthy volunteers will provide a more robust answer to the impact of disease on CL.
The aim of this report is to test whether PK parameters of anrukinzumab differ between healthy individuals and two populations (UC and asthma) representing major immune mediated inflammatory diseases. A population PK model using data from all the available clinical studies was developed to address the question.
Methods
Clinical studies and PK assessment
Anrukinzumab has been tested in five clinical studies. They were 1) a single dose escalation study with both i.v. and s.c. route of administration ranging from 0.3 mg kg–1 to 4 mg kg–1 in mild to moderate asthma patients, 2) a single dose escalation study with 0.3 mg kg–1 to 4 mg kg–1 s.c. administration in healthy Japanese and non-Japanese, 3) an allergen challenge study with two doses of 2 mg kg–1 s.c. administration in mild asthmatic patients, 4) a phase 2 efficacy study 18 in moderate to severe asthma patients with multiple s.c. doses ranging from 0.2 mg kg–1 to 2 mg kg–1 and 5) biomarker study in moderate to severe UC patients with i.v. administration ranging from 200 to 600 mg with faecal calprotectin change at week 14 as the primary end point. Details of the clinical studies are listed in Table1. Available PK data from all the studies were included in population PK model development.
Table 1.
Summary of clinical studies included in the analysis
| Study | Study description | Population | n | Dosing regimen | PK sampling schedule | Baseline IL-13 (ng ml–1) (mean ± SEM) |
|---|---|---|---|---|---|---|
| 1 | Single dose escalation study | Mild to moderate asthma patients | 37 | 3 mg kg–1 i.v., 0.3, 1, 2, 4 mg kg–1 s.c., single dose | Hour 0, 3, 6, 9, 12, 18, 24, 30, 36, 42, 48, 60 and 72, day 4, 5, 6, 7, 14, 21, 28, 35, 42, 56, 70 and 84 | 0.24 ± 0.05 |
| 2 | Single dose escalation and PK comparison between Japanese and non-Japanese | Healthy Japanese and non-Asian | 44 | 0.3, 1, 2, 4 mg kg–1 s.c., single dose | Hour 0, 3, 6, 9, 12, 18, 24, 30, 36, 42, 48, 60 and 72, day 4, 5, 6, 7, 14, 21, 28, 35, 42, 56, 70 and 84 | 0.16 ± 0.02 |
| 3 | Allergen challenge study | Mild asthmatic patients | 14 | 2 mg kg–1 s.c., total 2 doses 1 week apart | Day 1, 8, 14, 21, 35, 56, 84, 112, 140 and 168 | 0.21 ± 0.03 |
| 4 | Asthma efficacy study | Moderate to severe asthma patients | 97 | 0.2, 0.6 and 2 mg kg–1 s.c. on day 1, 8, 28, 56, and 84; 200 mg s.c. on day 1, 8, 28, 42, 56, 70 and 84. | Sparse sampling | 0.24 ± 0.03 |
| 5 | Biomarker study in UC | UC patients | 63 | 200, 400 and 600 mg i.v.; Total five doses: day 1, week 2, 4, 8 and 12. | Trough and peak for all doses, day 2, 4 and 7, week 14, 16, 18, 22, 26 and 30 | 1.29 ± 0.42 |
All protocols and consent forms were reviewed and approved by the institutional review boards for each of the study sites, and all subjects provided signed informed consent. All studies were conducted in accordance with the ethical standards of the Declaration of Helsinki.
The serum concentration of anrukinzumab was measured using the same validated ELISA assay in Pharmaceutical Product Development (PPD, Richmond, Virginia, USA) for all the studies. In this assay, recombinant human IL-13 was used as the capturing agent and horseradish peroxidase (HRP) conjugated mouse anti-human IgG antibody was used as the detection agent. The lower limit of quantification (LLOQ) was 31.2 ng ml–1 for studies 1 and 2, whereas it was 50 ng ml–1 for studies 3, 4 and 5.
Population PK model building
The population pharmacokinetic analysis was performed with the non-linear mixed effects modelling software NONMEM version 7.2. (ICON Development Solutions, Ellicott City, MD, USA). The first order conditional estimation method (FOCE) was used for estimation. Xpose (version 4.4) and R (version 2.15.2) were used to visualize the output and evaluate the models.
Anrukinzumab concentrations were logarithmically transformed and fitted simultaneously. PK samples with values below the limit of quantification were less than 2% of the total dataset, and therefore these measurements were excluded from analysis. The inter-individual variability (IIV) of pharmacokinetic parameters was described using an exponential model: PARi = PARpop ⋅ exp(ηi), where PARi is the empirical parameter in the ith patient, PARpop is the estimated population typical value of the parameter and ηi (etai)is the deviation from the population value for the ith patient. The values of ηi were assumed to be normally distributed, with a mean of 0 and variance of ω2 (i.e. η ∼ N(0, ω2)). For some parameters, ω2 was fixed to 0 if ω2 was not estimable. The residual variability was described by an additive model (on the log-transformed data), but other residual error models were also considered during model development. Base model selection was based on assessment of the diagnostic plots, the objective function value (OFV) change and relative standard error values.
Covariate model building
Since body weight (WT) is known as a covariate for antibody systemic clearance (CL) and volume of distribution (V) 14, it was included in the base model before testing additional covariates. When building the base model, the exponent of WT on CL was tested as a fixed value of 0.75 or was estimated. Similarly, the exponent of WT on volume of central compartment (Vc) and volume of peripheral compartment (Vp) was tested as a fixed value of 1 or was estimated. Stepwise covariate modelling (SCM) as implemented in PSN 3.5.4 was used for systematically testing additional covariates where a forward inclusion phase at P < 0.005 was followed by a backward elimination phase at P < 0.001. Both linear and power models were tested for continuous covariates.
Model evaluation
First, model goodness-of-fit was evaluated by the diagnostic plots including observed (DV) vs. population predicted concentrations (PRED), observed vs. individual predicted concentrations (IPRED), conditional weighted residuals (CWRES) vs. PRED concentrations and CWERS vs. time after dose. Next, the predictive performance of the final model was evaluated using visual predictive check (VPC, as implemented in PsN 3.5.4) comparing observed data with simulations of a 1000 replicate dataset stratified by treatment. In addition, a bootstrap was performed in PsN 3.5.4 with 2000 samples to investigate stability and accuracy of the parameter estimates and to obtain a confidence interval for the parameters.
Model simulation
To show the impact of faster CL on the PK profile beyond that caused by differences in body weight and albumin level concentration, the final model was used to simulate the PK profile in UC or WT and albumin matched non-UC subjects with five 200 mg i.v. doses of anrukinzumab given on day 0, weeks 2, 4, 8 and 12 mimicking the dosing frequency for the UC study (study 5). Simulations were made based on the point estimates of the population model. A total of 1000 subjects for each population were included in the simulation. Covariates of these 1000 subjects were generated based on the empirical covariate distributions from the UC study. The median and the 95% prediction intervals were calculated for each population.
Results
Subject characteristics
Anrukinzumab serum concentration data from 255 subjects in five studies were pooled for the population PK analysis. The detailed design for each study was presented in Table1. The pooled dataset included PK data obtained from both s.c. and i.v. routes of administration, a wide doses range (0.2 mg kg–1 to 600 mg), a flat and weight based dosing scheme, single dose and multiple doses and most importantly different populations including healthy volunteers, patients with different severity of asthma and UC patients. Baseline characteristics and demographics of subjects included in the analysis are summarized in Table2. Since there is no detailed information on the severity of the asthma for individual patients in the database, the severity of asthma was defined based on the study. For study 1, the inclusion criteria required forced expiratory volume (FEV1) to be > 70% and the Asthma control questionnaire (ACQ-5) score to be ≤ 1 at baseline and thus were defined as mild to moderate. For study 4, the inclusion criteria required FEV1 to be between 55% and 80% and ACQ-5 ≥ 2 and thus were defined moderate to severe. For study 5, UC patients with a total Mayo score of 4–10 were included.
Table 2.
Demographics and baseline characteristics of subjects and route of administration
| Characteristics | n = 255 |
|---|---|
| Gender, n (%) | |
| Male | 165 (65) |
| Female | 90 (35) |
| Race, n(%) | |
| White | 185 (73) |
| Black | 31 (12) |
| Asian | 30 (12) |
| Others | 9 (3) |
| Age (years), median (mean ± SD) | 37 (38 ± 13) |
| Weight (kg), median (mean ± SD) | 81.3 (82.6 ± 18.7) |
| Disease state, n (%) | |
| Healthy volunteers | 44 (17) |
| Mild to moderate asthma | 51 (20) |
| Moderate to severe asthma | 97 (38) |
| Ulcerative colitis | 63 (25) |
| Route of administration, n (%) | |
| i.v. | 71 (28) |
| s.c. | 184 (72) |
Base model
A two compartment structure model with first order absorption and elimination described the data well. Parameters in the structural model included CL, volume of central compartment (Vc), volume of peripheral compartment (Vp), inter-compartmental CL (Q), absorption rate constant (Ka) and absolute bioavailability (F). The inter-individual variability was included for CL, Vc, Vp and Ka parameters. Vc and Vp were assigned the same η values and assumed full correlation. Covariance between ηs for CL and V was included. F was constrained between 0 and 1 for s.c. administration. WT was included in the base model as a covariate for CL, Vc and Vp. A fixed exponent of 0.75 for CL and estimated exponent of Vc/Vp led to the lowest OFV with a more stable model (covariance step solved successfully). Comparing with fixing the exponent for Vc/Vp to 1, estimation of the exponent for Vc/Vp lowered OFV by 5.4. The parameter values for the base model are listed in Table3.
Table 3.
Parameters from the base and final models
| Parameter | Base model (OFV = −5829) | Final model (OFV = −6099) | ||||
|---|---|---|---|---|---|---|
| value | RSE | value | RSE | Bootstrap Median | Bootstrap 95% CI | |
| Fixed effect | ||||||
| CL | CLpop• (WT/75)0.75• (ALB/4.3)θalbumin• (1 + θUC) | |||||
| CLpop (l h–1) | 0.00887 | 5.8% | 0.00732 | 4.9% | 0.00728 | 0.00670, 0.00777 |
| θalbumin | – | – | −1.07 | 4.9% | −1.06 | −1.43, −0.65 |
| fθUC (for UC only) | – | – | 0.728 | 10.5% | 0.729 | 0.588, 0.900 |
| Vc | Vc,pop• (WT/75)θWT | |||||
| Vc,pop (l) | 3.85 | 5.4% | 3.81 | 4.6% | 3.80 | 3.50, 4.10 |
| θWT (for Vc and Vp) | 0.841 | 4.7% | 0.688 | 9.0% | 0.689 | 0.578, 0.817 |
| Q | Qpop | |||||
| Qpop (l h–1) | 0.0222 | 11.7% | 0.0224 | 15.4% | 0.0222 | 0.0168, 0.0286 |
| Ka | Ka,pop | |||||
| pop (h–1) | 0.0109 | 7.6% | 0.0119 | 6.6% | 0.0119 | 0.0105, 0.0137 |
| Vp | Vp,pop• (WT/75)θWT | |||||
| Vp,pop (l) | 2.27 | 8.1% | 2.17 | 8.7% | 2.16 | 1.84, 2.45 |
| F | Fpop• (1 + θSA) | |||||
| Fpop | 0.862 | 6.4% | 0.973 | 6.0% | 0.973 | 0.878, 1.000 |
| θSA (for moderate to severe asthma) | – | −0.309 | 9.5% | −0.306 | −0.358, −0.248 | |
| Random effect | ||||||
| ω, CL | 44.8% | 5.5% | 31.6% | 5.2% | 31.4% | 28.1%, 34.6% |
| ω, Vc and Vp | 28.7% | 75.4% | 26.5% | 7.4% | 26.3% | 22.6%, 30.5% |
| ω, correlation of CL and (Vc and Vp) | 0.655 | 8.6% | 0.727 | 5.0% | 0.731 | 0.652, 0.795 |
| ω, Ka | 55.6% | 8.1% | 54.0% | 8.4% | 53.6% | 44.7%, 62.4% |
| Residual variability | 23.5% | 4.6% | 23.5% | 4.6% | 23.4% | 21.4%, 25.5% |
ALB, albumin
CI, confidence interval
CL, systemic clearance
F, bioavailability
Ka, absorption rate
Q, inter-compartmental clearance
RSE, relative standard error, obtained from NONMEM covariance step
PARpop, population typical value
Vc, volume of central compartment
Vp, volume of peripheral compartment.
Plots of η for CL(η1) and V (η2) against various covariates (Figure1A) suggested that CL was elevated in UC and moderate to severe asthma patients compared with healthy volunteers and mild to moderate asthma patients with the most increase observed for UC patients. CL also showed a negative correlation with baseline albumin concentration.
Figure 1.
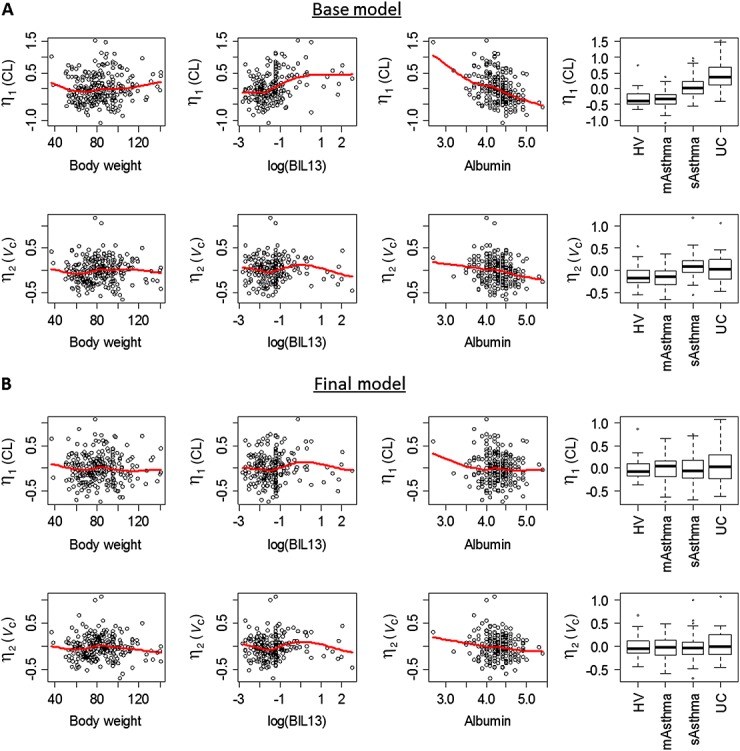
Relationship between selected covariates and pharmacokinetic parameters in the base model (A) and the final model (B). The solid red line is a smooth curve fit of the data computed by loess. In the boxplots on the right, the thick line shows median, box shows the first and the third quartiles, and the bars show 1.5 *interquartile range. CL, clearance; V, total volume of distribution; BIL13, serum baseline IL-13 level; HV, healthy volunteers; mAsthma, mild to moderate asthma patients; sAsthma, moderate to severe asthma patients; UC, ulcerative colitis patients
Final model
A formal covariates testing was performed using SCM from PsN as described in the Methods section. Age, baseline IL-13, baseline albumin, gender, having UC, having moderate to severe asthma or having mild to moderate asthma were tested as covariates for CL and V. Since Vc and Vp have the same η values, it suggested that the data did not contain enough information to separate covariate effects on these two parameters, and therefore the covariate was only tested for Vc in SCM. Identified covariates for Vc would have been added as covariates for Vp as well in the final model, but there was no covariate identified for Vc in addition to WT. In addition, since visual inspection (Figure1A) showed that ηs for both CL and V were slightly elevated for moderate to severe asthma patients, it suggested that it could be due to the difference in bioavailability. Therefore, having moderate to severe asthma or having mild to moderate asthma were tested as covariates for F. Since UC patients only received i.v. administration, having UC was not tested as a covariate for F. The covariate testing showed that baseline IL-13 was not a significant covariate for either CL or V. In addition to the pre-specified covariate effects of WT, the final model included body weight, baseline albumin and UC disease as covariates for CL and moderate to severe asthma disease as a covariate for F. The ω on CL reduced from 44.8% in the base model to 31.6 % in the final model. CL for UC patients was elevated by 72.8% as compared with the CL for non-UC subjects. ηs for CL and V were plotted against various covariates for the final model (Figure1B) and no trend could be observed suggesting the final model properly captured the available covariates. The relationship between CL and baseline Mayo score for UC patients was explored graphically (Figure2). Since no trend was observed based on the plot, no further covariate analysis on Mayo score was conducted.
Figure 2.
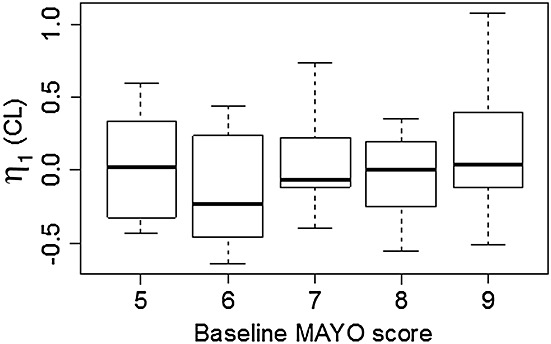
Relationship between baseline Mayo score and CL for ulcerative colitis patients. In the boxplot, the thick line shows median, box shows the first and the third quartiles, and the bars show 1.5 *interquartile range.
The parameter values for the final model are listed in Table3. Relative standard error (RSE) for all the fixed effect and random effect parameters were all less than 20%. Diagnostic plots for the final model are shown in Figure3. There was no systematic bias or lack of fit as indicated by these plots. The final model was also evaluated by VPCs from 1000 simulations stratified by dose. Representative plots from six treatment groups from both i.v. and s.c. routes of administration and different disease states are shown in Figure4. For each of the three percentiles, the observed and simulated data agreed well. To validate the model further, 2000 bootstrap runs were performed. The median values and 95% confidence intervals (CIs) from the bootstrap estimation are listed in Table3. The bootstrap results were very similar to the NONMEM estimates from the final model, supporting the stability of the population PK model. The significance of the included covariates was further supported by the bootstrap analysis, as none of the 95% CIs for the covariate effects included zero (if the parameter value for covariate effect is zero, it represents the null hypothesis). In the final model, the half-life for non-UC subjects was 567 h (95% CI 548–586 h) and for UC patients, it was 328 h (95% CI 301–352 h).
Figure 3.
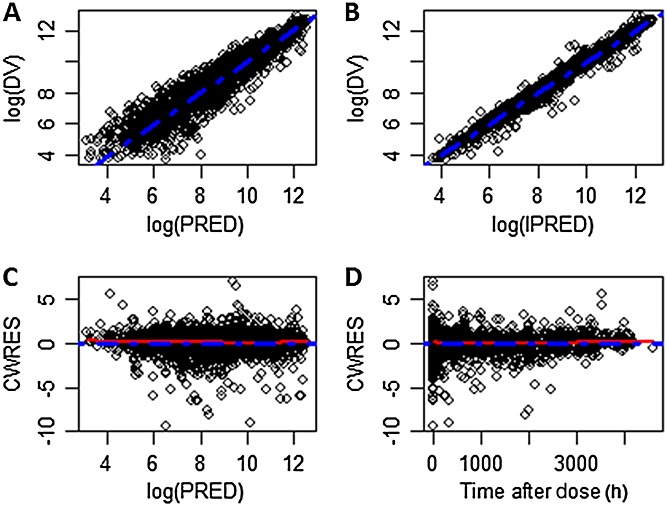
Goodness-of-fit plots for the final model. A) Observed vs. population predicted serum anrukinzumab concentrations on a log scale. B) Observed vs. individual predicted serum anrukinzumab concentrations on log scale. C) Conditional weighted residual vs. population predicted serum anrukinzumab concentrations. D) Conditional weighted residual vs. time after dose (h). The broken blue line represents the line of identity in panels A and B and the zero line in panels C and D. The broken red line represents a smooth curve fit of the data. DV, observed concentration; PRED, predicted concentration; IPRED, individual predicted concentration; CWRES, conditional weighted residual
Figure 4.
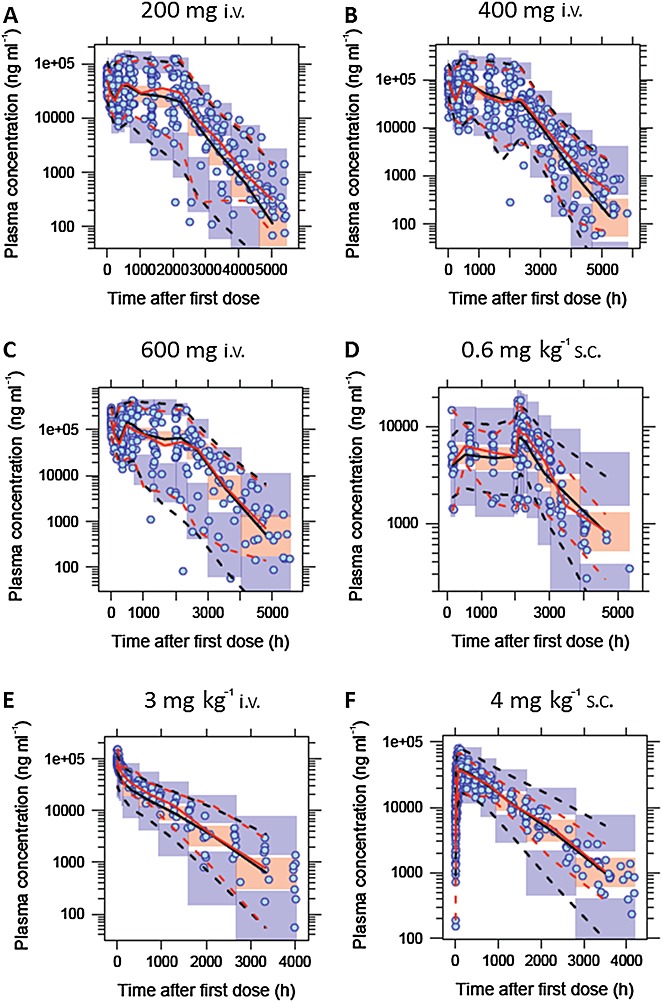
Visual predictive check for the final model stratified by dose. Examples included are A) 200 mg i.v. (study 5, UC patients), B) 400 mg i.v. (study 5, UC patients), C) 600 mg i.v. (study 5, UC patients), D) 0.6 mg kg–1 s.c. (study 4, moderate to severe asthma patients), E) 3 mg kg–1 i.v. (study 1, mild to moderate asthma patients) and F) 4 mg kg–1 s.c. (studies 1 and 2, healthy volunteers and mild to moderate asthma patients). The circles show the observed data. The solid red lines represent the median of the observed data. The broken red lines represent the 5th and 95th percentiles of the observed data. The solid black lines represent the simulated median and the orange shaded area represents its 95% confidence interval. The broken black lines represent the 5th and 95th percentiles based on simulation and the blue shaded areas around the broken black lines represent their the 95% confidence interval, respectively
Model simulation
To illustrate the impact of faster CL on exposure in UC patients, simulation of exposure for subjects with or without UC was performed with covariate matched population and the only difference between the two populations was CL. Median and 95% prediction interval are plotted in Figure5. The PK profiles showed reduced exposure in UC patients compared with non-UC subjects when the same dose of anrukinzumab was administered.
Figure 5.
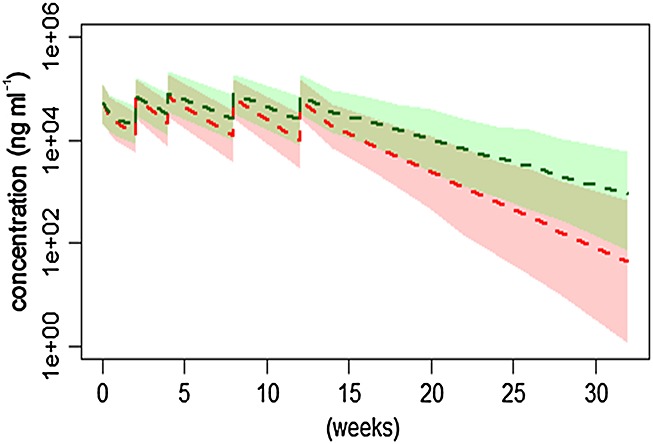
Concentration vs. time profiles of anrukinzumab given as multiple i.v. 200 mg doses to UC patients or non-UC subjects. The broken lines show median profiles and the shaded areas show 95% prediction interval.  ,UC;
,UC;  ,non-UC
Discussion
A population PK model was created for anrukinzumab, an anti-IL13 monoclonal antibody with data from five clinical trials conducted in different disease states including healthy volunteers, asthma patients and UC patients. A two compartment model with first order absorption and elimination described all the available PK data for anrukinzumab well. The population estimates of the Vc and Vp compartments were 3.8 and 2.2 l, respectively. The Vc was very close to plasma volume and both parameters were within the typical range for monoclonal antibodies 14. The mean CL of all the non-UC patients was 0.20 l day–1 (i.e. 0.00732 l per h), which was very similar to the typical CL of endogenous IgG of 0.21 l day–1 and within the reported typical range of 0.2–0.5 l day–1 for monoclonal antibodies 14. Both CL and V increased with body weight, which is often observed with other therapeutic monoclonal antibodies 14 and is consistent with the mechanism of metabolism for monoclonal antibodies. The half-life for non-UC subjects was 567 h (95% confidence interval 548–586 h). Overall, the PK properties of anrukinazumab are consistent with a typical monoclonal antibody.
Albumin was also identified as a covariate for CL which has been reported before for other monoclonal antibodies []10,15. Since both IgG and albumin have a similar degradation mechanism, where binding to FcRn protects them from degradation 16,17[], it is reasonable to expect that the CL of albumin and IgG are correlated and consequently, albumin concentration is a covariate for monoclonal antibody CL. Age and gender were not identified as covariates for CL or V.
Moderate to severe asthma was identified as a covariate for bioavailability. It was not expected that asthma disease would impact on the bioavailability of the drug. However, since the entire moderate to severe asthma patient data were from a multicentre phase 2 study with s.c. injection, the decreased bioavailability could due to inaccurate dose administration. Sparse PK sampling was used for that study. Therefore PK characterization heavily relied on the population PK model where PK information from other studies was used.
UC disease was identified as a significant covariate with an estimated 73% higher CL in this population. This is consistent with the results from non-compartmental analysis of PK data 18. Within the UC population, the relationship between CL and Mayo score was explored graphically (Figure2). There was no support for the hypothesis that different levels of clinical disease severity would have different CLs across the investigated UC population. Baseline serum IL-13 was elevated further in UC patients compared with asthma patients who had slightly elevated baseline IL-13 compared with healthy volunteers (Table1). However, the PK for anukinzumab were dose proportional in all the studies (data not shown) including the initial single dose escalation study with a relatively low dose (0.3 mg kg–1). In addition baseline IL-13 level was not a significant covariate for the CL of anukinzumab in the covariate test. Altogether, this evidence suggests that increased CL in UC patients is not likely due to target mediated drug disposition. Although most of the previous experience in healthy volunteers and asthma patients with anrukinzumab are with the s.c. route of administration, there was one cohort of i.v. administration included in the single dose escalation study (Table1, study 1). In that study, there was no significant difference in CL between i.v. and s.c. administration, suggesting that the i.v. route is not the reason for the faster CL observed for UC patients. No anti-anrukinzumab antibody (ADA) has been reported by using the quasi-quantitative ELISA assay in any of the studies so that it is unlikely that ADAs contribute to the difference in CL. In the UC study, mesalamine was the only permitted concomitant medication for which no impact on CL has been reported so far. Methotrexate, steroid and anti-TNF therapies were required to be stopped 7 days, 30 days and five half-lives before study randomization, respectively. Therefore, it is also unlikely that the concomitant medications contributed to the difference observed in CL. An alternative explanation for the increased CL may be disease related (but IL-13 independent). Although the disease-related mechanisms impacting on CL could not be determined, potential explanations include increased inflammation state and intestinal CL 19. For infliximab, inflammation has been shown to be related to the CL of the drug 10,12,20[]. Increased intestinal CL of antibody has been reported for UC and Crohn's disease 21. However, it is unclear whether the increased intestinal CL is significant enough to impact on systemic antibody CL.
There is one precaution for the IL-13 measurement. Although the same assay for IL-13 was used for all the studies, the test was run at a different laboratory for the UC study whereas the same laboratory was used for all the other studies. During the re-validation of the IL-13 assay for the UC study, the LLOQ for the assay was increased due to matrix interference with UC serum samples. This increase in LLOQ resulted in three subjects (5%) receiving active treatment in the study with no detectable IL-13 at baseline in the UC study. The samples with no detectable baseline IL-13 were excluded from the covariate analysis. Since the majority of the baseline values were detectable, the few missing samples should not have had an impact on the conclusion that baseline IL-13 was not a significant covariate.
In conclusion, a population PK model for anrukinzumab has identified several covariates for PK parameters. Particularly, having UC disease was identified as a significant covariate, associated with increased CL. This is, as far as we know, the first time a population PK modelling with covariate testing approach to compare antibody PK parameters in healthy volunteers, asthma patients and UC patients has been conducted. An increasing number of monoclonal antibodies are being investigated for the treatment of UC and other inflammatory diseases. While this is the only example we are aware of that UC disease impacts on CL through a TMDD independent mechanism, it would be interesting to see if disease related changes in CL are a general phenomenon for monoclonal antibodies. If confirmed, dose adjustment might be needed to treat different diseases.
Competing Interests
This study was funded by Pfizer. FH and SM are employees of Pfizer Inc. JK is an employee of Pfizer AB. WR has served as a speaker, a consultant and/or an advisory board member for Abbott Laboratories, Abbvie, Aesca, Amgen, AM Pharma, Aptalis, Astellas, Astra Zeneca, Avaxia, Bioclinica, Biogen IDEC, Bristol-Myers Squibb, Cellerix, Chemocentryx, Celgene, Centocor, Celltrion, Danone Austria, Elan, Falk Pharma GmbH, Ferring, Galapagos, Genentech, Grünenthal, Inova, Janssen, Johnson & Johnson, Kyowa Hakko Kirin Pharma, Lipid Therapeutics, MedImmune, Millenium, Mitsubishi Tanabe Pharma Corporation, MSD, Novartis, Ocera, Otsuka, PDL, Pharmacosmos, Pfizer, Procter & Gamble, Prometheus, Robarts Clinical Trial, Schering-Plough, Setpointmedical, Shire, Takeda, Therakos, Tigenix, UCB, Vifor, Yakult, Zyngeniaand 4SC.
The authors would like to thank the Pfizer IMA-638 study team for designing and conducting the clinical studies and the Pfizer clinical programming and writing group for providing programming support for the combined PK dataset. We would also like to thank Dr Anne Heatherington for support and guidance in the PK analysis.
References
- 1.Wynn TA. IL-13 effector functions. Annu Rev Immunol. 2003;21:425–56. doi: 10.1146/annurev.immunol.21.120601.141142. [DOI] [PubMed] [Google Scholar]
- 2.Neurath MF, Finotto S, Glimcher LH. The role of Th1/Th2 polarization in mucosal immunity. Nat Med. 2002;8:567–73. doi: 10.1038/nm0602-567. [DOI] [PubMed] [Google Scholar]
- 3.Kasaian MT, Miller DK. IL-13 as a therapeutic target for respiratory disease. Biochem Pharmacol. 2008;76:147–55. doi: 10.1016/j.bcp.2008.04.002. [DOI] [PubMed] [Google Scholar]
- 4.McMahan ZH. Wigley FM. Vol. 23. Expert Opin Investig Drugs: Novel investigational agents for the treatment of scleroderma; 2014. pp. 183–98. [DOI] [PubMed] [Google Scholar]
- 5.Muzes G, Molnar B, Tulassay Z, Sipos F. Changes of the cytokine profile in inflammatory bowel diseases. World J Gastroenterol. 2012;18:5848–61. doi: 10.3748/wjg.v18.i41.5848. [DOI] [PMC free article] [PubMed] [Google Scholar]
- 6.Fuss IJ, Heller F, Boirivant M, Leon F, Yoshida M, Fichtner-Feigl S, Yang Z, Exley M, Kitani A, Blumberg RS, Mannon P, Strober W. Nonclassical CD1d-restricted NK T cells that produce IL-13 characterize an atypical Th2 response in ulcerative colitis. J Clin Invest. 2004;113:1490–7. doi: 10.1172/JCI19836. [DOI] [PMC free article] [PubMed] [Google Scholar]
- 7.Kasaian MT, Raible D, Marquette K, Cook TA, Zhou S, Tan XY, Tchistiakova L. IL-13 antibodies influence IL-13 clearance in humans by modulating scavenger activity of IL-13Ralpha2. J Immunol. 2011;187:561–9. doi: 10.4049/jimmunol.1100467. [DOI] [PubMed] [Google Scholar]
- 8.Kasaian MT, Tan XY, Jin M, Fitz L, Marquette K, Wood N, Cook TA, Lee J, Widom A, Agostinelli R, Bree A, Schlerman FJ, Olland S, Wadanoli M, Sypek J, Gill D, Goldman SJ, Tchistiakova L. Interleukin-13 neutralization by two distinct receptor blocking mechanisms reduces immunoglobulin E responses and lung inflammation in cynomolgus monkeys. J Pharmacol Exp Ther. 2008;325:882–92. doi: 10.1124/jpet.108.136515. [DOI] [PubMed] [Google Scholar]
- 9.2015. Highlights of Prescribing Information - REMICADE ; Available online at: http://www.accessdata.fda.gov/drugsatfda_docs/label/2015/103772s5370lbl.pdf (last accessed 2 September 2015)
- 10.Fasanmade AA, Adedokun OJ, Ford J, Hernandez D, Johanns J, Hu C, Davis HM, Zhou H. Population pharmacokinetic analysis of infliximab in patients with ulcerative colitis. Eur J Clin Pharmacol. 2009;65:1211–28. doi: 10.1007/s00228-009-0718-4. [DOI] [PMC free article] [PubMed] [Google Scholar]
- 11.Xu Z, Seitz K, Fasanmade A, Ford J, Williamson P, Xu W, Davis HM, Zhou H. Population pharmacokinetics of infliximab in patients with ankylosing spondylitis. J Clin Pharmacol. 2008;48:681–95. doi: 10.1177/0091270008316886. [DOI] [PubMed] [Google Scholar]
- 12.Ternant D, Ducourau E, Perdriger A, Corondan A, Le Goff B, Devauchelle-Pensec V, Solau-Gervais E, Watier H, Goupille P, Paintaud G, Mulleman D. Relationship between inflammation and infliximab pharmacokinetics in rheumatoid arthritis. Br J Clin Pharmacol. 2014;78:118–28. doi: 10.1111/bcp.12313. [DOI] [PMC free article] [PubMed] [Google Scholar]
- 13.Ternant D, Mulleman D, Lauferon F, Vignault C, Ducourau E, Wendling D, Goupille P, Paintaud G. Influence of methotrexate on infliximab pharmacokinetics and pharmacodynamics in ankylosing spondylitis. Br J Clin Pharmacol. 2012;73:55–65. doi: 10.1111/j.1365-2125.2011.04050.x. [DOI] [PMC free article] [PubMed] [Google Scholar]
- 14.Dirks NL, Meibohm B. Population pharmacokinetics of therapeutic monoclonal antibodies. Clin Pharmacokinet. 2010;49:633–59. doi: 10.2165/11535960-000000000-00000. [DOI] [PubMed] [Google Scholar]
- 15.Rosario M, Dirks N, Gastonguay M, Fox I, Milton A. Population pharmacokinetic modelling of vedolizumab in patients with ulcerative colitis or Crohn's disease Poster 9th Congress of the European Crohn's and Colitis Organisation. Denmark: Copenhagen; 2014. P385. [Google Scholar]
- 16.Roopenian DC, Akilesh S. FcRn: the neonatal Fc receptor comes of age. Nat Rev Immunol. 2007;7:715–25. doi: 10.1038/nri2155. [DOI] [PubMed] [Google Scholar]
- 17.Kim J, Bronson CL, Hayton WL, Radmacher MD, Roopenian DC, Robinson JM, Anderson CL. Albumin turnover: FcRn-mediated recycling saves as much albumin from degradation as the liver produces. Am J Physiol- Gastr L. 2006;290:G352–60. doi: 10.1152/ajpgi.00286.2005. [DOI] [PubMed] [Google Scholar]
- 18.Reinisch W, Panes J, Khurana S, Toth G, Hua F, Comer GM, Hinz M, Page K, O'Toole M, McDonnell Moorehead T, Zhu H, Sun Y, Cataldi F. 2015. Anrukinzumab, an anti-interleukin 13 monoclonal antibody, in active UC: efficacy and safety from a phase IIa randomised multicentre study. Gut January 7, DOI: 10.1136/gutjnl-2014-308337. [Epub ahead of print] [DOI] [PubMed]
- 19.Ordas I, Mould DR, Feagan BG, Sandborn WJ. Anti-TNF monoclonal antibodies in inflammatory bowel disease: pharmacokinetics-based dosing paradigms. Clin Pharmacol Ther. 2012;91:635–46. doi: 10.1038/clpt.2011.328. [DOI] [PubMed] [Google Scholar]
- 20.Wolbink GJ, Voskuyl AE, Lems WF, de Groot E, Nurmohamed MT, Tak PP, Dijkmans BA, Aarden L. Relationship between serum trough infliximab levels, pretreatment C reactive protein levels, and clinical response to infliximab treatment in patients with rheumatoid arthritis. Ann Rheum Dis. 2005;64:704–7. doi: 10.1136/ard.2004.030452. [DOI] [PMC free article] [PubMed] [Google Scholar]
- 21.Kapel N, Meillet D, Favennec L, Magne D, Raichvarg D, Gobert JG. Evaluation of intestinal clearance and faecal excretion of alpha 1-antiproteinase and immunoglobulins during Crohn's disease and ulcerative colitis. Eur J Clin Chem Clin. 1992;30:197–202. doi: 10.1515/cclm.1992.30.4.197. [DOI] [PubMed] [Google Scholar]