

Abstract
The anabolic effects of dietary protein on skeletal muscle depend on adequate skeletal muscle perfusion, which is impaired in older people. This study explores fed state muscle microvascular blood flow, protein metabolism and exercise training status in older men. We measured leg blood flow (LBF), muscle microvascular blood volume (MBV) and muscle protein turnover under post-absorptive and fed state (i.v. Glamin to double amino acids, dextrose to sustain glucose ∼7–7.5 mmol l−1) conditions in two groups: 10 untrained men (72.3 ± 1.4 years; body mass index (BMI) 26.5 ± 1.15 kg m2) and 10 men who had undertaken 20 weeks of fully supervised, whole-body resistance exercise training (RET) (72.8 ± 1.4 years; BMI 26.3 ± 1.2 kg m2). We measured LBF by Doppler ultrasound and muscle MBV by contrast-enhanced ultrasound. Muscle protein synthesis (MPS) was measured using [1, 2-13C2] leucine with breakdown (MPB) and net protein balance (NPB) by ring-[D5] phenylalanine tracers. Plasma insulin was measured via ELISA and indices of anabolic signalling (e.g. Akt/mTORC1) by immunoblotting from muscle biopsies. Whereas older untrained men did not exhibit fed-state increases in LBF or MBV, the RET group exhibited increases in both LBF and MBV. Despite our hypothesis that enhanced fed-state circulatory responses would improve anabolic responses to nutrition, fed-state increases in MPS (∼50–75%; P < 0.001) were identical in both groups. Finally, whereas only the RET group exhibited fed-state suppression of MPB (∼–38%; P < 0.05), positive NPB achieved was similar in both groups. We conclude that RET enhances fed-state LBF and MBV and restores nutrient-dependent attenuation of MPB without robustly enhancing MPS or NPB.
Key points
Increases in limb blood flow in response to nutrition are reduced in older age.
Muscle microvascular blood flow (MBF) in response to nutrition is also reduced with advancing age and this may contribute to age-related ‘anabolic resistance’.
Resistance exercise training (RET) can rejuvenate limb blood flow responses to nutrition in older individuals.
We report here that 20 weeks of RET also restores muscle MBF in older individuals.
Restoration of MBF does not, however, enhance muscle anabolic responses to nutrition.
Introduction
Skeletal muscles facilitate whole-body locomotory function but also represent the body’s largest metabolically active protein reservoir and glucose disposal site (Wolfe, 2006). Given these crucial functional and metabolic properties, age-related losses of muscle mass (sarcopenia) and strength represent major health problems. As a consequence of sarcopenia, older people suffer diminished independence, often resulting in frailty (Fried et al., 2001).
In addition to sarcopenia, the link between ageing and development of cardiovascular and metabolic disease is striking. For example, decreased arterial compliance with increasing age is associated with hypertension and coronary artery disease (Lind & Lithell, 1993; Dinenno et al., 1999;DeSouza et al., 2002). Additionally, older individuals exhibit 20–30% reductions in limb artery blood flow under both post-absorptive (Donato et al., 2006) and postprandial conditions (Skilton et al., 2005) when compared to younger individuals. A less explored facet of ageing is that of muscle microvascular blood flow (MBF) and the distribution of blood flow between nutritive and non-nutritive routes (Clark et al., 2006; Clark, 2008; Durham et al., 2010). In principle, blunting of muscle MBF under fed conditions may contribute to age-related declines in insulin action and muscle protein anabolism (Durham et al., 2010) by reducing delivery of insulin and amino acids (AAs) (Clark et al., 2003; Timmerman et al., 2010). As increasing post-absorptive muscle MBF by sodium nitroprusside, or femoral artery insulin infusion may promote muscle anabolism (Timmerman et al., 2010), it is plausible that this may also be true in the fed state. Moreover, we and others have previously shown that feeding older people did not, by itself, increase muscle MBF (Raitakari et al., 2000; Timmerman et al., 2010) or protein anabolism measured by an arterio-venous balance method (Timmerman et al., 2012), providing further support for the notion that in older people increasing fed state MBF may be required to increase muscle protein anabolism.
A substantial body of epidemiological and experimental evidence has established a causal relationship between cardio-metabolic conditions and preventable risk factors, such as physical inactivity (Blair et al., 1989). Indeed, it has been recognised for a long time that exercise training, and in particular resistance exercise training (RET), can not only improve muscle mass and function in older subjects (Strasser et al., 2009) but also decreases risk of cardiovascular disease (Cornelissen et al., 2011). In support of this, our previous work showed that RET can correct age-related reductions in whole leg blood flow (LBF) in response to feeding alone or feeding plus exercise (Phillips et al., 2012), and other workers recently reported that even a single bout of dynamic exercise could enhance fed-state muscle microvascular blood volume (MBV) and thereby improve post-exercise, post-feeding protein anabolism (Timmerman et al., 2012). Rather than investigating links between acute exercise, blood flow and metabolism, our aim was to determine the effects of RET upon fed-state muscle MBV and muscle protein metabolism (synthesis (MPS), breakdown (MPB) and net protein balance (NPB)) in older people. We hypothesised that adaptations associated with RET would lead to enhanced fed-state MBV and as a result muscle protein anabolism.
Methods
Subject characteristics
We recruited two groups of older men: one untrained group (72.3 ± 1.4 years; body mass index (BMI), 26.5 ± 1.15 kg m2, n = 10); and one group who underwent a programme of 20 weeks of fully supervised RET (72.8 ± 1.4 years; BMI 26.3 ± 1.2 kg m2, n = 10). Groups were matched for age, BMI, lean mass (whole-body and leg), resting blood pressure and fasting glucose (Table1). Whereas untrained men underwent only one metabolic study (to provide trained vs. untrained comparisons) we also gathered data on muscle mass (by dual energy X-ray absorptiometry (DXA)) and strength (sum of six 1-repetition maximum (1-RM) assessments) in individuals assigned to RET before and after the 20 weeks to confirm the expected physiological adaptations. All subjects were initially screened by means of a medical questionnaire, physical examination and resting ECG with exclusions for overt muscle wasting (>2 SD below age norms; Baumgartner et al., 1998), metabolic, respiratory or cardiovascular disorders and other signs and symptoms of ill health. All subjects had normal blood chemistry, were normotensive (blood pressure < 140/90 mmHg) and were not taking medication. All subjects performed activities of daily living and recreation but did not routinely participate in moderate to high intensity aerobic exercise and had not participated in RET in the last 2 years. All subjects gave their written, informed consent to participate after all procedures and risks were explained. This study was approved by The University of Nottingham Ethics Committee and complied with the Declaration of Helsinki and the UK Human Tissue Authority.
Table 1.
Lean mass and strength in untrained and RET men
| Old untrained | Old RET (before) | Old RET (after) | |
|---|---|---|---|
| Lean whole body mass (kg) | 52.1 ± 1.66 | 53.7 ± 1.29 | 54.2 ± 1.332 |
| Lean leg mass (kg) | 8.42 ± 0.43 | 8.46 ± 0.28 | 8.61 ± 0.312 |
| Strength (N) | N/A | 487 ± 24 | 676 ± 35* |
| Fasting glucose (mmol l−1) | 5.1 ± 0.1 | 5.1 ± 0.2 | N/A |
| Systolic BP (mmHg) | 132 ± 4 | 132 ± 4 | N/A |
| Diastolic BP (mmHg) | 85 ± 3 | 79 ± 3 | N/A |
| Resting HR (b.p.m.) | 68 ± 2 | 62 ± 4 | N/A |
P < 0.0001 vs. RET before training
P < 0.1 vs. RET before training.
Resistance exercise training (RET)
The fully supervised RET programme was based on previously published recommendations for exercise intensity and duration (Singh, 2002) and as used by us previously (Phillips et al., 2012). Subjects trained three times per week, with each session lasting ∼60 min. During 4 weeks of induction training (to ensure adoption of, and adherence to, correct technique) intensity was increased from 40 to 60% 1-RM. For the remaining 16 weeks of training, intensity was set at 70% 1-RM, with multiple sets of 12 repetitions and 2 min of rest between sets. The same number of repetitions (16 sets of 12 repetitions) were performed each session for the eight exercises: seated chest press; latissimus-pull down; seated lever row; leg extension; leg curl; leg press; back extension and abdominal curl. 1-RM assessments were made every 4 weeks to ensure that the intensity of training was constant, i.e. 70% 1-RM. Subjects would have been excluded for non-compliance, defined as non-attendance for more than six consecutive sessions, < 75% attendance or failure to complete the exercise regime on > 15% attendance; however, none was excluded.
Acute studies
The untrained and RET groups were instructed to refrain from exercise for 72 h prior to each acute study day and from alcohol and caffeine for 24 h. Subjects fasted from 21.00 h the night before (water ad libitum) and reported to the laboratory at 09.00 h. After a DXA scan to determine body composition, subjects then had polyethylene catheters inserted, under aseptic conditions, into the antecubital veins of both arms (one for tracer infusion and the other for perflutren microbubble infusion (Definity; Lantheus Medical Imaging, Billerica, MA, USA)) and also both the femoral vein and the artery of one leg (for blood sampling), with 1% lidocaine as anaesthetic. Blood samples were taken every 20 min throughout. A primed, continuous infusion (0.7 mg kg−1, 1 mg kg h−1) of [1, 2-13C2] leucine and (0.3mg kg−1, 0.6 mg kg h−1) ring-[D5] phenylalanine (99 and 98 at.%, respectively; both CIL, Cambridge, MA, USA) was started at 0 h and maintained for the duration of the study with an increase (to avoid tracer dilution) to 1.5 mg kg h−1 (leucine) and 0.9 mg kg h−1 (phenylalanine) when intravenous ‘feeding’ began (130 min). Muscle biopsies of m.vastus lateralis were taken at –10, 120 and 250 min from one leg using the conchotome technique (Dietrichson et al., 1987), with 1% lidocaine as local anaesthetic (Fig. 1). Muscle was washed in ice-cold PBS before freezing in liquid N2 and storage at –80°C until analysis.
Figure 1.
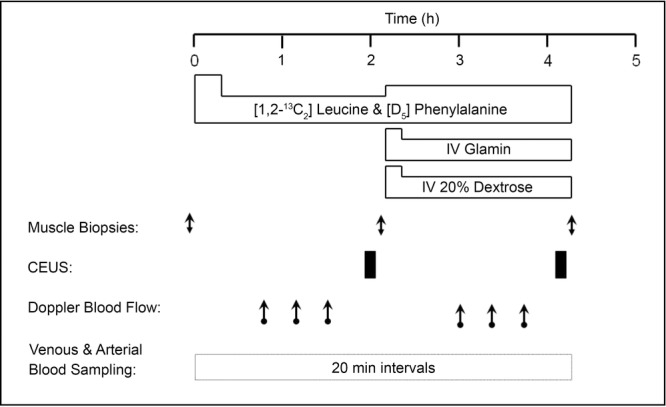
Acute study protocol
Intravenous feeding
The i.v. nutrition consisted of a primed, continuous infusion of Glamin (Fresenius Kabi, Bad Homburg, Germany) (34 mg kg−1, 102 mg kg h−1) and 20% dextrose infused at a rate sufficient to maintain blood glucose at 7–7.5 mmol l−1.
Leg blood flow (LBF)
At 50 min, measurements of LBF (femoral artery) were made over 40 min, with these values designated as ‘post-absorptive’. This was repeated at 180 min (50 min after the start of Glamin and dextrose infusions) with these measurements labelled as ‘fed’. A mean value from three measurements on each leg (no significant differences were observed between the three measurements) was obtained for LBF, using Doppler ultrasound (iU22; Philips Ultrasound, CA, USA). All measurements were taken with the subject supine, with no visual or aural stimuli. A linear array 9 to 3 MHz frequency probe (Philips Ultrasound) was used to measure mean blood velocity and arterial lumen diameter in the common femoral arteries of both legs. Measurements were made 2–3 cm proximal to the bifurcation of the femoral artery to minimize the effect of turbulence; the insonation angle was < 60 deg. Arterial lumen diameter was measured by video callipers for each measurement and defined as the maximum distance between the media–adventitia interface of the near wall and the lumen–intima interface of the far wall of the vessel. LBF (l min−1) was calculated as: mean blood velocity ((cm s−1) × π × (femoral artery radius (mm))2/1000) × 60. Using the Doppler ultrasound technique to measure basal LBF we found a coefficient of variation of 9% for three independent measures under each condition assessed, suggesting that we could reliably detect changes of ∼18% of the basal value.
Microvascular blood volume (MBV)
At 110 min (basal) and 240 min (110 min after the start of Glamin and dextrose infusions; (fed)), measurements of MBV in the m. vastus lateralis were made using contrast-enhanced ultrasound (CEUS), as previously described (Sjøberg et al., 2011). The use of CEUS to estimate changes in MBV is based on the measurement of the acoustic backscatter of intravascular capsule-stabilised gas-filled microbubbles, with a linear relationship between the acoustic intensity (AI) generated by resonating microbubbles and their concentration in the operator-defined region of interest (ROI) (Wei et al., 1998). These microbubbles resonate at harmonics of the insonated frequency, allowing the ultrasound to detect signal from the microbubbles while supressing signal reflected by tissue (Mitchell et al., 2013). Selection of the probe placement by ultrasound ensured m. vastus lateralis was available for analysis. In brief, a linear array transducer (L9-3; Philips Ultrasound) was fixed to the thigh for the duration of the study to allow cross-sectional imaging of the m. vastus lateralis. A 1.5 ml suspension of perflutren micro-bubbles was diluted to 20 ml and infused at a rate of 1.2 ml min−1. Real-time imaging was performed at a low mechanical index (MI; 0.08) for 9 min to allow attainment of a steady-state micro-bubble signal. After this period a high MI (1.20) ‘flash’ was used to destroy the micro-bubbles, allowing recording of replenishment in the microvasculature of the ultrasound beam during the following 45 s period. Four destruction–replenishment cycles were recorded for each MBV measure. Data from these recordings were exported to quantification software (Q-Lab; Philips) for analysis. ROI were drawn free hand, selected to be free of obvious connective tissue and large blood vessels. The selected ROI was stored for each recording for a particular individual to ensure reproducibility, under both basal and fed conditions. The AI obtained during the first 0.5 s of recording was averaged and subtracted from that recorded later to eliminate background noise and contribution from any rapid filling vessels. Calculations were made in accordance with Wei et al. (1998) with AI vs. time curves fitted to the equation: y = A[1 – e−β(t-βt)], where t is time (s), βt the time used for background subtraction, y is the acoustic intensity, A is the plateau AI defined as MBV and β is the flow rate constant (s−1) that determines the rate of rise of AI (Wei et al., 1998).
Muscle protein synthesis (MPS)
For measures of MPS, ∼20 mg of muscle was used, as described previously (Kumar et al., 2012). In brief, the muscle was homogenised in ice-cold homogenisation buffer (50 mM Tris-HCl (pH 7.4), 50 mm NaF, 10 mm β-glycerophosphate disodium salt, 1 mm EDTA, 1 mm EGTA, 1 mm activated Na3VO4 (all Sigma-Aldrich, Poole, UK)) and a complete protease inhibitor cocktail tablet (Roche, West Sussex, UK) at 10 μl μg−1 of tissue. Homogenates were rotated for 10 min and the supernatant was collected by centrifugation at 13 000 g for 5 min at 4°C. The myofibrillar pellet was solubilised in 0.3 m NaOH, separated from the insoluble collagen by centrifugation and precipitated with 1 m perchloric acid (PCA). Protein-bound AAs were released by acid hydrolysis in Dowex H+ resin slurry overnight before being purified by ion exchange chromatography on Dowex H+ resin. The AAs were then derivatised as their n-acetyl-N-propyl esters as previously described (Wilkinson et al., 2008). Incorporation of [1, 2-13C2] leucine into protein was determined by gas chromatography-combustion-isotope ratio mass spectrometry ((GC-C-IRMS); Delta Plus XP, Thermofisher Scientific, Hemel Hempstead, UK) using our standard techniques (Babraj et al., 2005), with the fractional synthetic rate (FSR) of myofibrillar protein determined from the incorporation of [1, 2-13C2] leucine, using the mean precursor labelling (Ep) of venous α-KIC between successive muscle biopsies (Smith et al., 2008). In brief, the standard equation of ({ΔEm/Ep} × t−1) was applied where ΔEm is the change in labelling of myofibrillar protein leucine over time (t (h)) between two biopsy samples.
Plasma phenylalanine and α-KIC
Concentrations of arterial plasma phenylalanine were determined as previously described (Wilkinson et al., 2013). In brief, plasma proteins were precipitated with 100% ethanol and the supernatant was evaporated to dryness, reconstituted in 0.5 m HCl and the lipid fraction removed using ethyl acetate extraction; the remaining aqueous phase was dried and AAs were converted to their tert-butyldimethylsilyl (t-BDMS) derivatives and the labelling (actual percentage enrichment (APE)) of arterialised and venous ring-[D5] phenylalanine was determined using gas chromatography mass spectrometry (GC-MS). For venous α-KIC, following precipitation of the plasma proteins, the quinoxalinol KIC derivative was then formed and extracted into ethyl acetate, evaporated to dryness and derivatised to its t-BDMS-quinoxalinol form. Concentrations for arterial plasma phenylalanine were determined using a 2H2 phenylalanine internal standard, with reference to a standard curve of known concentration.
Rate of appearance (Ra), rate of disappearance (Rd) and NPB
Leg protein flux (i.e. leg muscle protein breakdown or Ra) was calculated from the arteriovenous dilution of ring-[D5] phenylalanine by using the following equation: [(Ea/Ev) – 1] × Ca × blood flow, where Ea and Ev are the values of AA enrichment at steady state in arterial and femoral venous plasma, respectively, and Ca is the mean concentration in the arterial blood with blood flow adjusted for the haematocrit (Hct) and leg volume, via DXA. Similarly, net protein balance was calculated from the arterial–venous concentration difference of phenylalanine, multiplied by the blood flow, corrected for Hct and expressed per 100 ml leg volume. Rate of disappearance (i.e. synthesis) is simply the sum of net balance and rate of appearance. For each period (post-absorptive and fed) the values for labelling and concentration were obtained from the mean of four separately analysed plasma samples, collected over the last hour of each period (Bennet et al., 1990).
Immunoblotting and plasma insulin
To investigate the possible effects of RET via enhanced LBF/MBV on anabolic signalling we measured protein phosphorylation of AKT and P70S6K1 (as probable indicators of such activity) in response to feeding. The supernatant (sarcoplasmic fraction), obtained from the myofibrillar preparation described above was standardised to a protein concentration of 1 mg ml−1 by dilution with Laemmli buffer, mixed and heated at 95°C for 5 min before 15 μg of protein per lane was loaded on to Criterion XT Bis-Tris 12% SDS-PAGE gels (Bio-Rad, Hemel Hempstead, UK) for electrophoresis at 200 V for ∼60 min. Proteins were electroblotted on to 0.2 μm PVDF membranes (Bio-Rad) at 100 V for 30 min and membranes blocked in 5% low-fat milk in TBS-T (Tris-buffered saline and 0.1% Tween-20; both Sigma-Aldrich, Poole, UK) for 1 h; membranes were rotated overnight with primary antibody (Cell Signaling Technology, Boston, MA, USA) at 1:2000 at 4°C. Membranes were washed (3×5 min) with TBS-T and incubated for 1 h at room temperature with HRP-conjugated anti-rabbit secondary antibody (Cell Signaling Technology, Hertfordshire, UK), before further washing (3×5 min) with TBS-T and incubation for 5 min with ECL reagents (enhanced chemiluminescence kit; Immunstar; Bio-Rad). Blots were imaged and quantified by peak density within the linear range using the Chemidoc XRS system (Bio-Rad). Coomassie staining was used to correct for loading (Welinder & Ekblad, 2011). Post-absorptive and fed plasma insulin concentrations were measured using undiluted samples and high-sensitivity insulin enzyme linked immunosorbent assays (ELISA; DRG Instruments GmbH, Marburg, Germany) according to the manufacturer’s protocol.
Statistical analyses
Group size for this study was determined by a power calculation based on the primary endpoint of MPS responses to nutrition, measured as FSR. This calculation suggested that we need 10 subjects per group to detect (with α of 0.05 and β of 0.85) a 25% difference between groups. Statistical analyses were performed using Graph Pad Prism Version 6.0 (La Jolla, CA, USA). All data are reported as means ± SEM with the threshold for significance being set at P < 0.05, and trends reported as P < 0.1. We applied two-way ANOVA with repeated measures, where appropriate, and Bonferroni post-hoc analysis to compare LBFs, indices of muscle protein turnover and degree of protein phosphorylation between the groups. Paired Student’s t tests were used to compare the effects of RET on muscle mass and strength and the effects of feeding on MBV; unpaired t tests were used to determine muscle mass differences between untrained and trained groups at baseline.
Results
Muscle mass and strength
Lean whole body and lean leg mass were determined by DXA with the leg analysed as the region inferior to the lowest visible point of the coccyx. There were no significant differences in lean whole body or lean leg mass between the groups either before or after RET. However, there was a trend for increased lean whole body (+0.92%, P = 0.08) and lean leg mass (+2.0%, P = 0.1) in the RET group. In the RET group, whole body strength assessed before and after RET (as the sum of six 1-RM assessments: seated chest press; latissimus-pull down; seated lever row; leg extension; leg curl; leg press) increased by 39.3 ± 4.5% (P < 0.0001; Table1).
Leg blood flow
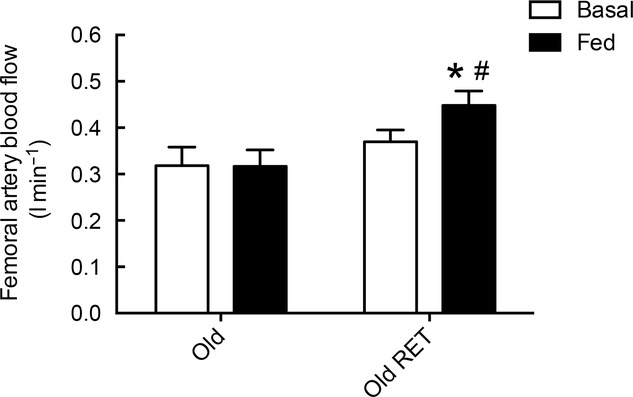
Post-absorptive LBF was not significantly different between the groups (0.32 ± 0.04 vs. 0.37 ± 0.03 l min−1). The untrained group did not demonstrate an increase in LBF in response to feeding (0.32 ± 0.04 vs. 0.32 ± 0.04 l min−1) whereas the RET group did (0.37 ± 0.03 vs. 0.45 ± 0.03 l min−1, P < 0.05). Fed LBF was significantly higher in the RET group compared to that in the untrained group (0.32 ± 0.04 vs. 0.45 ± 0.04 l min−1; P < 0.05; Fig. 2).
Figure 2.
Femoral artery blood flow
Femoral artery blood flow in untrained subjects (Old) and subjects after 20 weeks of resistance exercise training (Old RET) in post-absorptive and fed conditions (102 mg kg h−1 Glamin and 20% dextrose to maintain blood glucose at 7–7.5 mmol l−1). Values are means ± SEM for n = 10 in each group. *P < 0.05 vs. post-absorptive in the same group; #P < 0.05 vs. Old in the same condition. Analysis via ANOVA, with Bonferroni post hoc analysis.
Microvascular blood volume
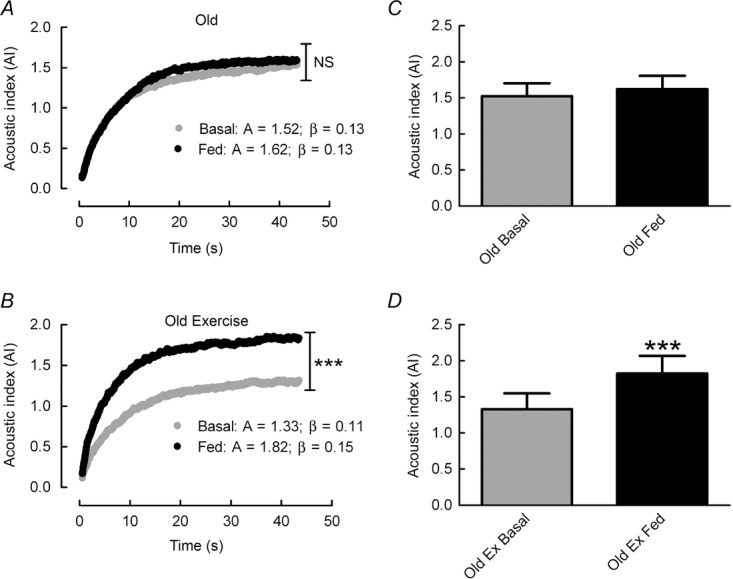
In agreement with Sjøberg et al. (2011) we found that during an infusion of 1.2ml min−1 of perflutren micro-bubbles a plateau signal was achieved at 5 min 44 s after a lag phase of approximately 60 s. Based on this, an infusion time of 9 min was used before measurements of MBV were obtained. A combined i.v. feeding strategy of 20% dextrose and a primed-constant infusion of Glamin resulted in a non-significant (7%) increase in MBV in the untrained group (A value: 1.52 ± 0.18 vs. 1.62 ± 0.19), whereas the RET group displayed a significant 44% increase in MBV in response to feeding (A value: 1.33 ± 0.22 vs. 1.82 ± 0.25; P < 0.001; Fig. 3). The non-significant increase in MBV in the untrained group demonstrates an age-related reduction in microvascular responses to nutrition as young untrained individuals in our previous work demonstrated a significant 25% increase in MBV, using the same i.v. feeding strategy (Phillips et al., 2014).
Figure 3.
Microvascular refilling curves
A and C, microvascular refilling curves after destruction of perflutren micro-bubbles in untrained (Old) subjects (A) and older subjects after 20 weeks of resistance exercise training (Old RET) (C) in post-absorptive and fed conditions (102 mg kg h−1 Glamin and 20% dextrose to maintain blood glucose at 7–7.5 mmol l−1). A = plateau value; β = flow rate constant. B and D, microvascular blood volume presented as the plateau value acoustic index (A value) in Old (B) and Old RET subjects (D). Values are means ± SEM for n = 10 in each group. ***P < 0.001 vs. post-absorptive in the same group. Analysis via paired Student’s t test.
Plasma and intracellular AA and keto-acid enrichment and concentration
Post-absorptive plasma phenylalanine concentrations were similar between the groups (untrained: 67.1 ± 3.0 vs. RET: 68.9 ± 6.8 μm) and increased significantly, but to the same extent in response to feeding in both groups (untrained: 119.9 ± 4.39 vs. RET: 127 ± 9.3 μm; P < 0.001). This pattern was repeated with intracellular phenylalanine concentrations (post-absorptive, untrained: 56.5 ± 3.4 vs. RET: 52.0 ± 5.7; fed, untrained: 90 ± 7.4 vs. RET: 97 ± 9.8 nmol ml–1). Steady-state plasma phenylalanine enrichment was achieved for both groups (untrained: 8.49 ± 0.61 and 7.81 ± 0.59; RET: 7.98 ± 0.51 and 7.51 ± 0.5 APE, during the post-absorptive and fed periods, respectively). Intracellular phenylalanine enrichment in both groups was 4.4 ± 0.4 APE during the post-absorptive phase and increased to 6.2 ± 0.4 APE in the untrained group and 6.0 ± 0.3 APE in the RET group during the fed period. Steady-state KIC enrichment was also observed throughout (post-absorptive, untrained: 4.80 ± 0.25 vs. RET: 4.93 ± 0.24 APE; fed, untrained: 5.80 ± 0.29 vs. RET: 6.05 ± 0.41 APE) and was not different between the groups.
Fractional synthetic rate
In contrast to the results for LBF and MBV, RET did not enhance FSR responses to feeding. There was a main effect of feeding (P < 0.001), but not training, on FSR. Post-absorptive FSR was not significantly different between the groups (untrained: 0.052 ± 0.006 vs. RET: 0.040 ± 0.004% h−1, P = 0.16). The untrained group did demonstrate an increased FSR in response to feeding (from 0.052 ± 0.006 to 0.074 ± 0.006% h−1, P < 0.01) but this response to feeding was not enhanced in the RET group (0.040 ± 0.004 to 0.070 ± 0.006% h−1; P < 0.001; Fig. 4A), with no significant different in fed-state FSR between the groups (0.074 ± 0.006 vs. 0.070 ± 0.006% h−1; P = 0.66).
Figure 4.

Myofibrillar fractional synthetic rate, rate of disappearance, rate of appearance and net protein balance
Myofibrillar fractional synthetic rate (FSR) (A), rate of disappearance (B), rate of appearance (C) and net protein balance (D) in response to feeding (102 mg kg h−1 Glamin and 20% dextrose to maintain blood glucose at 7–7.5 mmol l−1) in untrained subjects (Old) and older subjects after 20 weeks of resistance exercise training (Old RET). Values are means ± SEM for n = 10 in each group. *P < 0.05 vs. post-absorptive in the same group; **P < 0.01 vs. post-absorptive in the same group; ***P < 0.001 vs. post-absorptive in the same group. Analysis via ANOVA, with Bonferroni post hoc analysis.
Rate of appearance, rate of disappearance and NPB
As with FSR there was a main effect of feeding (P < 0.01), but not training, on MPB. There was no difference in post-absorptive MPB (Ra) between the two groups (untrained: 42.3 ± 5.5 vs. RET: 40.2 ± 5.0 nmol Phe 100 ml leg−1 min−1, P = 0.75). In addition, although there was no significant difference in fed-state rates of MPB between the two groups (untrained: 37.7 ± 3.8 vs. RET: 25.8 ± 4.0 nmol Phe 100 ml leg−1 min−1, P = 0.08) there was a trend for MPB to be lower in the RET group and only the RET group demonstrated a significant reduction in MPB in response to feeding (from 40.2 ± 5.0 to 25.8 ± 4.0 nmol Phe 100 ml leg−1 min−1; P < 0.05; Fig. 4C). There was no main effect of feeding or training on Rd and although Rd numerically increased in both groups in response to feeding (untrained: 36.9 ± 5.6 vs. 45.3 ± 4.4 nmol Phe 100 ml leg−1 min−1, P = 0.22; RET: 30.7 ± 6.7 vs. 36.5 ± 7.1 nmol Phe 100 ml leg−1 min−1, P = 0.37) these increases did not reach significance in either group, with no difference between the groups in either the post-absorptive or the fed condition (Fig. 4B). Contrary to Rd, but in keeping with Ra, there was a main effect of feeding on NPB (P < 0.001) with no main effect of training. In the post-absorptive condition, NPB was negative in both groups (untrained: –5.4 ± 2.7 vs. RET: –9.5 ± 2.5 nmol Phe 100 ml leg min−1), with no significant difference between the groups (P = 0.19). In response to feeding, NPB became positive in both groups (untrained: 7.6 ± 3.0, P < 0.05 vs. RET: 10.7 ± 4.4 nmol Phe 100 ml leg−1 min−1, P < 0.001 vs. post-absorptive state); however, despite such differences in MPB responses to feeding, NPB values were not significantly different between the groups (P = 0.38) (Fig. 4D).
Plasma glucose and insulin
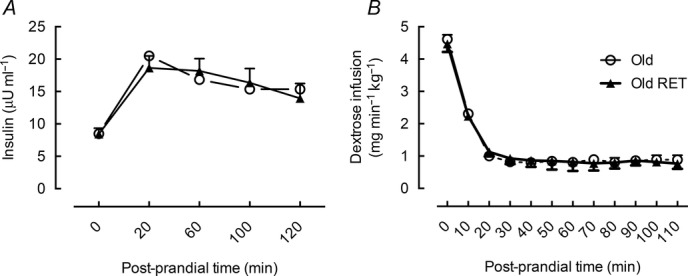
Despite the greater increase in LBF and MBV in response to feeding in the RET group this was not associated with an increased dextrose infusion to maintain a blood glucose of 7–7.5 mmol l−1, as there was no significant difference between the groups (mean required dextrose, untrained: 1.3 ± 0.07 vs. RET: 1.3 ± 0.14 mg min kg−1; Fig. 5B). This was also true for plasma insulin values, which were not significantly different between the groups (insulin area under the curve (AUC), untrained: 32.3 ± 6.5 vs. RET: 32.2 ± 2.4 μUnits ml−1; Fig. 5A).
Figure 5.
Plasma insulin and dextrose infusion required to maintain blood glucose
Plasma insulin values (A) and dextrose infusion required to maintain a blood glucose value of 7–7.5 mmol l−1 (B) in untrained (Old) and older subjects after 20 weeks of resistance exercise training (Old RET). Values for n = 10 in each group.
Immunoblotting
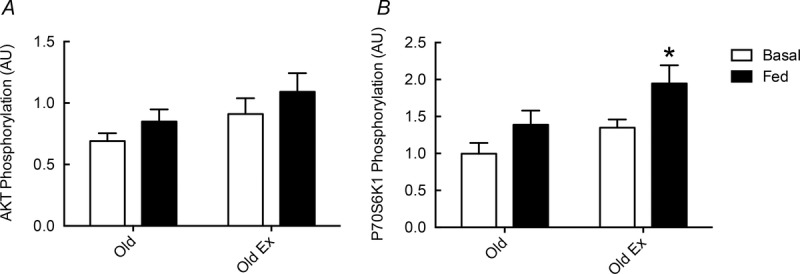
Neither post-absorptive (untrained: 1.00 ± 0.15 vs. RET: 1.35 ± 0.11) nor fed-state P70S6K1 phosphorylation (untrained: 1.39 ± 0.19 vs. RET: 1.95 ± 0.25) was significantly different between the groups. This was also true for AKT phosphorylation (post-absorptive, untrained: 0.69 ± 0.06 vs. RET: 0.91 ± 0.13; fed, untrained: 0.85 ± 0.10 vs. 1.09 ± 0.15). Only in the RET group was there a trend for increased AKT phosphorylation in response to feeding (0.91 ± 0.13 vs. 1.09 ± 0.15, P < 0.1). Both groups increased P70S6K1 phosphorylation in response to feeding (1.35 ± 0.11 vs. 1.95 ± 0.25, P < 0.05), although the change in the untrained group (1.00 ± 0.15 vs. 1.39 ± 0.19, P < 0.1) failed to reach significance (Fig. 6).
Figure 6.
Phosphorylation of AKT and P70S6K1 in response to feeding
Phosphorylation of AKT (A) and P70S6K1 (B) in response to feeding (102 mg kg h−1 Glamin and 20% dextrose to maintain blood glucose at 7–7.5 mmol l−1) in untrained subjects (Old) and older subjects after 20 weeks of resistance exercise training (Old RET). Values are arbitrary density metric units (AU) with means ± SEM for n = 10 in each group. *P < 0.05 vs. post-absorptive in the same group. Analysis via ANOVA, with Bonferroni post hoc analysis.
Discussion
In agreement with our previous work (Phillips et al., 2012), we have confirmed that age-related blunting of LBF responses to feeding can be reversed by RET. Moreover, we have now identified this blunted LBF to be associated with attenuated muscle microvascular responses to feeding. We now also report that although RET markedly improved whole-leg and muscle microvascular responses to feeding, this did not robustly improve muscle protein anabolic responses, in terms of either muscle protein synthesis or net protein balance; nonetheless, RET did restore the fed-state suppression of muscle protein breakdown seen in young subjects (Vincent et al., 2006).
A well-defined feature of nutrient intake in young and middle aged subjects is increased limb arterial blood flow (Raitakari et al., 2000) but as we reported previously, such responses are reduced in older people (Phillips et al., 2012). Although the mechanisms underlying these observations remain unclear, increased α-adrenergic tone (Casey & Joyner, 2012) and shrinking of the arteriolar network and its smooth muscle (Dinenno et al., 2001; Lacolley et al., 2012) probably contribute. Thus, the fact that previously unresponsive LBF, in this and our previous study (Phillips et al., 2012), could be enhanced by RET in older people might be the result of normalization of adrenergic activity and vascular remodelling associated with RET (Seals et al., 2009). Crucially, here we have shown that age-related decrements in LBF are associated with impairments in muscle MBV responses to feeding, findings consistent with reports of decrements in fed-state forearm MBF (inferred from indirect measurements) (Skilton et al., 2005) and also the absence of increased muscle MBV in older people fed essential AAs and sucrose (Timmerman et al., 2012). Whereas it is well established that acute bouts of exercise enhance microvascular perfusion in both human (Vincent et al., 2006) and rodent muscle (Sjøberg et al., 2011), the effects of an RET programme on muscle MBV, particularly in older adults, have until now remained poorly defined. Here, we have shown that 20 weeks of RET improved nutrient-dependent increases in both LBF and muscle MBV in older men, independently of ‘acute’ exercise hyperaemia (measurements took place > 72 h after the last bout of RET). As exercise is known to induce angiogenesis (Gavin et al., 2007), increases in muscle MBV are likely to result from increased capillarisation (McCall et al., 1996) and vascular remodelling of the arteriolar network (Weber et al., 2013).
Muscle protein anabolic responses after oral consumption (Atherton et al., 2010) or i.v. infusions of essential AAs include increases in MPS (Bennet et al., 1990; Anthony et al., 2000; Millward, 2012). Previous work by our group (Cuthbertson et al., 2005) and others (Volpi et al., 2000) has demonstrated ‘anabolic resistance’, whereby older men demonstrate blunted (compared to those in younger men) fed-state increases in MPS. Such anabolic resistance has not only been conjectured by us and others to contribute to the sarcopenia of ageing but it also appears to be a common feature of many kinds of muscle atrophy (e.g. with immobilisation (Glover et al., 2008), reduced physical activity (Breen et al., 2013), heart failure (Toth et al., 2010), obesity (Guillet et al., 2009) and cancer (Williams et al., 2012)), suggesting a final common pathway for a variety of insults resulting in diminished anabolism. Whereas the regulatory mechanisms of anabolic resistance remain poorly defined, possible links between sluggish muscle MBV and diminished anabolic responses to plasma nutrient availability may be a general feature of a number of conditions.
We have now defined relationships between fed-state muscle protein anabolic effects and MBV in both untrained and resistance exercise trained older individuals. Against our expectations, we found that despite RET resulting in greater (in comparison with an independent age-matched untrained group) fed-state LBF and MBV values, increases in MPS were similar between groups. These findings differ from those observed as a result of feeding 11 h after a single bout of previously unfamiliar treadmill exercise for 45 min, which led to greater MBV and MPS responses to feeding in older subjects (Timmerman et al., 2012). We speculate these differences are due to study design; that is, acute sensitisation of the microvasculature to exogenous nutrition in the hours (<12 h) after exercise in the aforementioned study (Smith et al., 2008) may have diminished by the time the measurements were made in the present study (>72 h after the last exercise bout); furthermore, the mode of exercise was different and no MBV measurements have been made in the fed state after acute resistance exercise in the untrained state when MPS is known to increase (Kumar et al., 2009). Finally, whereas our results in healthy elderly men are consonant with observations that chronic exercise training does not enhance resting myofibrillar protein synthesis in younger men (Kim et al., 2005), they are in contrast to the increased basal MPS observed in older obese males in response to 12 weeks of training (Smith et al., 2012). Such differences may be due to differences in subject characteristics (non-obese vs. obese) or study design, i.e. timing of biopsy in close proximity to the final exercise bout, anabolic stimulus or measurements of different muscle sub-fractions.
One of the most potent postprandial stimulants of microvascular recruitment is insulin, the plasma concentration of which increases after protein or carbohydrate intake (Gannon et al., 1988; Atherton et al., 2010). For example, clamping insulin at 75 μU ml−1 led to increases in MBV of ∼30% (Sjøberg et al., 2011), due to a redistribution of blood flow from non-nutritive to nutritive routes (Kim et al., 2006). In relation to postprandial muscle anabolism, our data and those of others show that the principal action of insulin is not to stimulate MPS, but rather to suppress MPB (Gelfand & Barrett, 1987; Louard et al., 1992; Greenhaff et al., 2008; Wilkes et al., 2009). Furthermore, we have also found there to be an age-related blunting of insulin-mediated suppression of MPB in older men (Wilkes et al., 2009). In agreement with our previous findings, here we found that MPB in untrained men remained unchanged on i.v. feeding despite insulin being raised to fed-state concentrations (15 U ml−1), sufficient to maximally suppress MPB in younger men (Strasser et al., 2009). Indeed, past work involving insulin clamps across physiological and supra-physiological concentrations (∼5–150 μU ml−1) have demonstrated a low threshold of insulin concentrations to achieve maximum (∼40%) suppression of MPB in fasted (Gelfand & Barrett, 1987; Louard et al., 1992) and fed conditions (Greenhaff et al., 2008). Moreover, the inhibition of MPB was not observed during AA feeding when insulin was clamped at post-absorptive concentrations, suggesting insulin was wholly responsible for the inhibition of MPB (Greenhaff et al., 2008). In contrast, using ‘local’ (e.g. femoral arterial) insulin infusions, others have suggested insulin can both inhibit MPB and stimulate MPS (Fujita et al., 2009). Nevertheless, such supra-physiological elevations of local insulin represent un-physiological states and may entirely reflect local and unique stimulatory effects of insulin upon microvascular recruitment, i.e. increasing local blood flow and delivery of AAs to the muscle, raising endogenous AA concentrations and generating a ‘pseudo-feeding’ response.
Remarkably, we found that RET restored postprandial suppression of MPB in older men, although this was not associated with any major enhancement of proximal insulin (i.e. AKT) signalling. This latter finding is unsurprising given that the relationship between the degree of fed-state AKT phosphorylation and that of suppression of MPB is poorly related (Greenhaff et al., 2008), and the mechanisms causing suppression of MPB under physiological hyperinsulinaemic conditions are currently poorly understood in detail. However, as changes in both MPS and NPB were comparable between the groups, any MPB effect was clearly insufficient to significantly improve net fed-state anabolism; nonetheless, this does not preclude the RET-induced suppression of MPB being physiologically important for slowing muscle mass loss or maintenance over a much longer period than studied herein.
Finally, we found that whether untrained or trained, our older subjects had identical insulin profiles and similar dextrose infusion rates were needed to achieve the desired blood glucose (7–7.5 mmol l−1), and thus they probably had similar whole body insulin sensitivity despite the differences in fitness. Thus, in agreement with Timmerman et al. (2010) we were unable to determine an association, on a cross-sectional basis, of RET on whole-body glucose clearance. Given that increases in MBV in response to feeding were higher in the RET group, heightened insulin sensitivity specifically in the endothelium and/or other parts of the microvasculature (Olson et al., 2006) (e.g. capillarisation; McGuigan et al., 2001) are probably mediating this increase in MBV, without affecting muscle glucose disposal.
We acknowledge some potential study limitations. Due to the highly invasive nature of the acute studies we performed, we chose not to study the same cohort longitudinally after 20 weeks of RET, choosing rather to minimize the burden on our subjects. We calculated sample size (n = 10) based upon achieving sufficient power to attain significance in our primary outcome: change in FSR in response to feeding (for which we achieved an effect size of 0.69 (partial η2)). Although assessment of MPS using the direct incorporation approach is the recognised gold standard for measuring myofibrillar (or mixed muscle) protein synthesis and data using this method are reported, a larger group size is required for AV balance approaches (to measure Rd and NPB), and hence the discrepancies in our muscle protein synthesis data using the two methods. Versus FSR, the AV balance methodologies are inherently more variable and less ‘accurate’ for detecting small changes in muscle-specific protein turnover. This is because it contains a contribution across the limb, from tissues other than muscle. It is also possible that artifacts may exist in the AV balance two-pool model, where limb blood flow is used to calculate Ra and NPB, which can skew interpretation under conditions of altered blood flow. In addition Rd is derived from Ra and NPB and not measured directly and therefore may represent a propagation of these errors. These (sample size and technical) limitations may explain some of the results we observed. For example, the Ra data showed a significant reduction in MPB in the RET group upon feeding (40.2 ± 5.0 vs. 25.8 ± 4.0, P < 0.01) but no significant difference in the seemingly similar numerical values comparing the fed-state MPB in the two groups (Old: 37.7 ± 3.8 vs. RET: 25.8 ± 4.0, P = 0.08). This disparity is explained by the differences in statistical power attributed to intra- vs. inter-individual comparisons and is probably a consequence of the inherent variation in AV balance measures and not using subjects to act as their own controls. Finally, that MPB is suppressed only in the RET group suggests, long term, that this could indeed have a positive impact on muscle maintenance. This is clearly a thesis requiring larger scale follow-up.
A fundamental limitation of the CEUS technique for measuring MBV is that it cannot be used to compare absolute values between individuals due to individual differences in the architecture of muscle blood vessels and definition of ROI; thus, we were unable to follow longitudinal changes in basal and fed MBV values, and these could not be directly compared between our subjects. However, delta changes within subjects in each group are comparable; thus, the 44% feeding-induced increase in MBV in the RET group is comparable to the untrained group that showed no significant change in MBV in response to our feeding regime. Furthermore, the effects (if any) of blood flow in modulating muscle protein turnover may depend, in a currently unknown way, upon the mode of feeding and the composition or volume of the feed, so that our results may not be applicable to effects of other patterns of feeding. For example, these results may not be fully representative of oral feeding, where additional factors such as incretins may elicit an effect, particularly on insulin secretion.
To conclude, we have shown that LBF and muscle MBV responses to mixed macronutrient feeding can be enhanced by RET. Nonetheless, although RET has notable potential to improve muscle function and mass (herein, increases of ∼39% in strength and 2% in lean leg mass) and enhance fed-state circulatory responses (LBF and MBF), it did not improve acute fed-state muscle anabolism in terms of increased MPS or better NPB, despite restoring a suppression of MPB (an observation warranting further investigation). The modest change in lean leg mass over 20 weeks suggests that any anabolic effects are probably very small and may be difficult to measure using these approaches. With regard to the improvements in muscle function without attendant gains in mass, it is well recognised that factors other than muscle size or volume significantly contribute to changes in strength; for example, neural activation and innervation, extracellular remodelling and changes in tendon properties all facilitate strength gains without affecting muscle mass (Narici et al., 2004; Reeves et al., 2004; Gabriel et al., 2006).
Finally, irrespective of postprandial muscle anabolism, and in addition to the obvious strength gains, there are likely to be other health benefits (e.g. decreased peripheral resistance and improved cardiac return) after RET in older people resulting from improved muscle microvascular responsiveness that warrant further study but are outwith the scope of this study.
Acknowledgments
We are grateful to our volunteers, and thank M. Baker and A. Gates for technical assistance. We also thank M. J. Rennie for his input into the study.
Glossary
- 1-RM
one-repetition maximum
- AA
amino acids
- AI
acoustic intensity
- APE
actual percentage enrichment
- AU
arbitrary unit
- AUC
area under the curve
- BMI
body mass index
- CEUS
contrast-enhanced ultrasound
- DXA
dual-energy X-ray absorptiometry
- ELISA
enzyme -linked immunosorbent assay
- FSR
fractional synthetic rate
- GC-C-IRMS
gas chromatography-combustion-isotope ratio mass spectrometry
- GC-MS
gas chromatography mass spectrometry
- Hct
haematocrit
- LBF
leg blood flow
- MBF
microvascular blood flow
- MBV
microvascular blood volume
- MI
mechanical index
- MPB
muscle protein breakdown
- MPS
muscle protein synthesis
- NPB
net protein balance
- PCA
perchloric acid
- Ra
rate of appearance
- Rd
rate of disappearance
- RET
resistance exercise training
- ROI
region of interest
- t-BDMS
tert-butyldimethylsilyl
Additional Information
Competing Interests
There are no competing interests to declare.
Author Contributions
All experiments were conducted at The University of Nottingham, Division of Medical Sciences and Graduate Entry Medicine, Royal Derby Hospital. The authors’ responsibilities were as follows: B.E.P., P.J.A., K.A.S., K.S. and J.P.W. were responsible for experimental design; B.E.P., K.V., M.C.L., K.S. and J.P.W. were responsible for data collection; B.E.P., P.J.A., D.J.W., K.S. and J.P.W. were responsible for data analysis and interpretation and drafted the manuscript. B.E.P. had primary responsibility for producing the final version of the manuscript and all authors critically read and approved the final manuscript. All persons designated as authors qualify for authorship and all those who qualify for authorship are listed.
Funding
This work was supported by a grant from The Dunhill Medical Trust (R87/1108) and UK BBSRC (BB/C516779/1). D.J.W. is funded by the MRC-ARUK Centre of Excellence for Musculoskeletal Ageing Research.
References
- Anthony JC, Anthony TG, Kimball SR, Vary TC. Jefferson LS. Orally administered leucine stimulates protein synthesis in skeletal muscle of post-absorptive rats in association with increased eIF4F formation. J Nutr. 2000;130:139–145. doi: 10.1093/jn/130.2.139. [DOI] [PubMed] [Google Scholar]
- Atherton PJ, Etheridge T, Watt PW, Wilkinson D, Selby A, Rankin D, Smith K. Rennie MJ. Muscle full effect after oral protein: time-dependent concordance and discordance between human muscle protein synthesis and mTORC1 signaling. Am J Clin Nutr. 2010;92:1080–1088. doi: 10.3945/ajcn.2010.29819. [DOI] [PubMed] [Google Scholar]
- Babraj JA, Cuthbertson DJR, Smith K, Langberg H, Miller B, Krogsgaard MR, Kjaer M. Rennie MJ. Collagen synthesis in human musculoskeletal tissues and skin. Am J Physiol Endocrinol Metab. 2005;289:E864–869. doi: 10.1152/ajpendo.00243.2005. [DOI] [PubMed] [Google Scholar]
- Baumgartner RN, Koehler KM, Gallagher D, Romero L, Heymsfield SB, Ross RR, Garry PJ. Lindeman RD. Epidemiology of sarcopenia among the elderly in New Mexico. Am. J. Epidemiol. 1998;147:755–763. doi: 10.1093/oxfordjournals.aje.a009520. [DOI] [PubMed] [Google Scholar]
- Bennet WM, Connacher AA, Scrimgeour CM, Jung RT. Rennie MJ. Euglycemic hyperinsulinemia augments amino acid uptake by human leg tissues during hyperaminoacidemia. Am J Physiol. 1990;259:E185–E194. doi: 10.1152/ajpendo.1990.259.2.E185. [DOI] [PubMed] [Google Scholar]
- Bennet WM, Connacher AA, Scrimgeour CM. Rennie MJ. The effect of amino acid infusion on leg protein turnover assessed by l-[15N]phenylalanine and l-[1-13C]leucine exchange. Eur J Clin Invest. 1990;20:41–50. doi: 10.1111/j.1365-2362.1990.tb01789.x. [DOI] [PubMed] [Google Scholar]
- Blair SN, Kohl HW, Paffenbarger RS, Clark DG, Cooper KH. Gibbons LW. Physical fitness and all-cause mortality. A prospective study of healthy men and women. JAMA. 1989;262:2395–2401. doi: 10.1001/jama.262.17.2395. [DOI] [PubMed] [Google Scholar]
- Breen L, Stokes KA, Churchward-Venne TA, Moore DR, Baker SK, Smith K, Atherton PJ. Phillips SM. Two weeks of reduced activity decreases leg lean mass and induces “anabolic resistance” of myofibrillar protein synthesis in healthy elderly. J Clin Endocrinol Metab. 2013;98:2604–2612. doi: 10.1210/jc.2013-1502. [DOI] [PubMed] [Google Scholar]
- Casey DP. Joyner MJ. Influence of α-adrenergic vasoconstriction on the blunted skeletal muscle contraction-induced rapid vasodilation with aging. J Appl Physiol. 2012;113:1201–1212. doi: 10.1152/japplphysiol.00734.2012. [DOI] [PMC free article] [PubMed] [Google Scholar]
- Clark MG, Rattigan S. Barrett EJ. Nutritive blood flow as an essential element supporting muscle anabolism. Curr Opin Clin Nutr Metab Care. 2006;9:185–189. doi: 10.1097/01.mco.0000222097.90890.c2. [DOI] [PubMed] [Google Scholar]
- Clark MG, Wallis MG, Barrett EJ, Vincent MA, Richards SM, Clerk LH. Rattigan S. Blood flow and muscle metabolism: a focus on insulin action. Am J Physiol Endocrinol Metab. 2003;284:E241–258. doi: 10.1152/ajpendo.00408.2002. [DOI] [PubMed] [Google Scholar]
- Clark MG. Impaired microvascular perfusion: a consequence of vascular dysfunction and a potential cause of insulin resistance in muscle. Am J Physiol Endocrinol Metab. 2008;295:E732–50. doi: 10.1152/ajpendo.90477.2008. [DOI] [PMC free article] [PubMed] [Google Scholar]
- Cornelissen VA, Fagard RH, Coeckelberghs E. Vanhees L. Impact of resistance training on blood pressure and other cardiovascular risk factors: a meta-analysis of randomized, controlled trials. Hypertension. 2011;58:950–958. doi: 10.1161/HYPERTENSIONAHA.111.177071. [DOI] [PubMed] [Google Scholar]
- Cuthbertson D, Smith K, Babraj J, Leese G, Waddell T, Atherton P, Wackerhage H, Taylor PM. Rennie MJ. Anabolic signaling deficits underlie amino acid resistance of wasting, aging muscle. FASEB J. 2005;19:422–424. doi: 10.1096/fj.04-2640fje. [DOI] [PubMed] [Google Scholar]
- DeSouza CA, Clevenger CM, Greiner JJ, Smith DT, Hoetzer GL, Shapiro LF. Stauffer BL. Evidence for agonist-specific endothelial vasodilator dysfunction with ageing in healthy humans. J Physiol. 2002;542:255–262. doi: 10.1113/jphysiol.2002.019166. [DOI] [PMC free article] [PubMed] [Google Scholar]
- Dietrichson P, Coakley J, Smith PE, Griffiths RD, Helliwell TR. Edwards RH. Conchotome and needle percutaneous biopsy of skeletal muscle. J Neurol Neurosurg Psychiatry. 1987;50:1461–1467. doi: 10.1136/jnnp.50.11.1461. [DOI] [PMC free article] [PubMed] [Google Scholar]
- Dinenno FA, Jones PP, Seals DR. Tanaka H. Limb blood flow and vascular conductance are reduced with age in healthy humans: relation to elevations in sympathetic nerve activity and declines in oxygen demand. Circulation. 1999;100:164–170. doi: 10.1161/01.cir.100.2.164. [DOI] [PubMed] [Google Scholar]
- Dinenno FA, Seals DR, DeSouza CA. Tanaka H. Age-related decreases in basal limb blood flow in humans: time course, determinants and habitual exercise effects. J Physiol. 2001;531:573–579. doi: 10.1111/j.1469-7793.2001.0573i.x. [DOI] [PMC free article] [PubMed] [Google Scholar]
- Donato AJ, Uberoi A, Wray DW, Nishiyama S, Lawrenson L. Richardson RS. Differential effects of aging on limb blood flow in humans. Am J Physiol Heart Circ Physiol. 2006;290:H272–278. doi: 10.1152/ajpheart.00405.2005. [DOI] [PubMed] [Google Scholar]
- Durham WJ, Casperson SL, Dillon EL, Keske MA, Paddon-Jones D, Sanford AP, Hickner RC, Grady JJ. Sheffield-Moore M. Age-related anabolic resistance after endurance-type exercise in healthy humans. FASEB J. 2010;24:4117–4127. doi: 10.1096/fj.09-150177. [DOI] [PMC free article] [PubMed] [Google Scholar]
- Fried LP, Tangen CM, Walston J, Newman AB, Hirsch C, Gottdiener J, Seeman T, Tracy R, Kop WJ, Burke G. McBurnie MA. Frailty in older adults: evidence for a phenotype. J Gerontol A Biol Sci Med Sci. 2001;56:M146–56. doi: 10.1093/gerona/56.3.m146. [DOI] [PubMed] [Google Scholar]
- Fujita S, Glynn EL, Timmerman KL, Rasmussen BB. Volpi E. Supraphysiological hyperinsulinaemia is necessary to stimulate skeletal muscle protein anabolism in older adults: evidence of a true age-related insulin resistance of muscle protein metabolism. Diabetologia. 2009;52:1889–1898. doi: 10.1007/s00125-009-1430-8. [DOI] [PMC free article] [PubMed] [Google Scholar]
- Gabriel DA, Kamen G. Frost G. Neural adaptations to resistive exercise: mechanisms and recommendations for training practices. Sports Med. 2006;36:133–149. doi: 10.2165/00007256-200636020-00004. [DOI] [PubMed] [Google Scholar]
- Gannon MC, Nuttall FQ, Neil BJ. Westphal SA. The insulin and glucose responses to meals of glucose plus various proteins in type II diabetic subjects. Metabolism. 1988;37:1081–1088. doi: 10.1016/0026-0495(88)90072-8. [DOI] [PubMed] [Google Scholar]
- Gavin TP, Drew JL, Kubik CJ, Pofahl WE. Hickner RC. Acute resistance exercise increases skeletal muscle angiogenic growth factor expression. Acta Physiol (Oxf) 2007;191:139–146. doi: 10.1111/j.1748-1716.2007.01723.x. [DOI] [PubMed] [Google Scholar]
- Gelfand RA. Barrett EJ. Effect of physiologic hyperinsulinemia on skeletal muscle protein synthesis and breakdown in man. J Clin Invest. 1987;80:1–6. doi: 10.1172/JCI113033. [DOI] [PMC free article] [PubMed] [Google Scholar]
- Glover EI, Phillips SM, Oates BR, Tang JE, Tarnopolsky MA, Selby A, Smith K. Rennie MJ. Immobilization induces anabolic resistance in human myofibrillar protein synthesis with low and high dose amino acid infusion. J Physiol. 2008;586:6049–6061. doi: 10.1113/jphysiol.2008.160333. [DOI] [PMC free article] [PubMed] [Google Scholar]
- Greenhaff PL, Karagounis LG, Peirce N, Simpson EJ, Hazell M, Layfield R, Wackerhage H, Smith K, Atherton P, Selby A. Rennie MJ. Disassociation between the effects of amino acids and insulin on signaling, ubiquitin ligases, and protein turnover in human muscle. Am J Physiol Endocrinol Metab. 2008;295:E595–604. doi: 10.1152/ajpendo.90411.2008. [DOI] [PMC free article] [PubMed] [Google Scholar]
- Guillet C, Delcourt I, Rance M, Giraudet C, Walrand S, Bedu M, Duche P. Boirie Y. Changes in basal and insulin and amino acid response of whole body and skeletal muscle proteins in obese men. J Clin Endocrinol Metab. 2009;94:3044–3050. doi: 10.1210/jc.2008-2216. [DOI] [PubMed] [Google Scholar]
- Kim J, Montagnani M, Koh KK. Quon MJ. Reciprocal relationships between insulin resistance and endothelial dysfunction: molecular and pathophysiological mechanisms. Circulation. 2006;113:1888–1904. doi: 10.1161/CIRCULATIONAHA.105.563213. [DOI] [PubMed] [Google Scholar]
- Kim PL, Staron RS. Phillips SM. Fasted-state skeletal muscle protein synthesis after resistance exercise is altered with training. J Physiol. 2005;568:283–290. doi: 10.1113/jphysiol.2005.093708. [DOI] [PMC free article] [PubMed] [Google Scholar]
- Kumar V, Atherton PJ, Selby A, Rankin D, Williams J, Smith K, Hiscock N. Rennie MJ. Muscle protein synthetic responses to exercise: effects of age, volume, and intensity. J Gerontol A Biol Sci Med Sci. 2012;67:1170–1177. doi: 10.1093/gerona/gls141. [DOI] [PubMed] [Google Scholar]
- Kumar V, Selby A, Rankin D, Patel R, Atherton P, Hildebrandt W, Williams J, Smith K, Seynnes O, Hiscock N. Rennie MJ. Age-related differences in the dose-response relationship of muscle protein synthesis to resistance exercise in young and old men. J Physiol. 2009;587:211–217. doi: 10.1113/jphysiol.2008.164483. [DOI] [PMC free article] [PubMed] [Google Scholar]
- Lacolley P, Regnault V, Nicoletti A, Li Z. Michel J-B. The vascular smooth muscle cell in arterial pathology: a cell that can take on multiple roles. Cardiovasc Res. 2012;95:194–204. doi: 10.1093/cvr/cvs135. [DOI] [PubMed] [Google Scholar]
- Lind L. Lithell H. Decreased peripheral blood flow in the pathogenesis of the metabolic syndrome comprising hypertension, hyperlipidemia, and hyperinsulinemia. Am Heart J. 1993;125:1494–1497. doi: 10.1016/0002-8703(93)90446-g. [DOI] [PubMed] [Google Scholar]
- Louard RJ, Fryburg DA, Gelfand RA. Barrett EJ. Insulin sensitivity of protein and glucose metabolism in human forearm skeletal muscle. J Clin Invest. 1992;90:2348–2354. doi: 10.1172/JCI116124. [DOI] [PMC free article] [PubMed] [Google Scholar]
- McCall GE, Byrnes WC, Dickinson A, Pattany PM. Fleck SJ. Muscle fiber hypertrophy, hyperplasia, and capillary density in college men after resistance training. J Appl Physiol. 1996;81:2004–2012. doi: 10.1152/jappl.1996.81.5.2004. [DOI] [PubMed] [Google Scholar]
- McGuigan MR, Bronks R, Newton RU, Sharman MJ, Graham JC, Cody DV. Kraemer WJ. Resistance training in patients with peripheral arterial disease: effects on myosin isoforms, fiber type distribution, and capillary supply to skeletal muscle. J Gerontol A Biol Sci Med Sci. 2001;56:B302–10. doi: 10.1093/gerona/56.7.b302. [DOI] [PubMed] [Google Scholar]
- Millward DJ. Knowledge gained from studies of leucine consumption in animals and humans. J Nutr. 2012;142:2212S–2219S. doi: 10.3945/jn.111.157370. [DOI] [PubMed] [Google Scholar]
- Mitchell WK, Phillips BE, Williams JP, Rankin D, Smith K, Lund JN. Atherton PJ. Development of a new Sonovue™ contrast-enhanced ultrasound approach reveals temporal and age-related features of muscle microvascular responses to feeding. Physiol Rep. 2013;1:e00119. doi: 10.1002/phy2.119. [DOI] [PMC free article] [PubMed] [Google Scholar]
- Narici MV, Reeves ND, Morse CI. Maganaris CN. Muscular adaptations to resistance exercise in the elderly. J Musculoskelet Neuronal Interact. 2004;4:161–164. [PubMed] [Google Scholar]
- Olson TP, Dengel DR, Leon AS. Schmitz KH. Moderate resistance training and vascular health in overweight women. Med Sci Sports Exerc. 2006;38:1558–1564. doi: 10.1249/01.mss.0000227540.58916.0e. [DOI] [PubMed] [Google Scholar]
- Phillips B, Williams J, Atherton P, Smith K, Hildebrandt W, Rankin D, Greenhaff P, Macdonald I. Rennie MJ. Resistance exercise training improves age-related declines in leg vascular conductance and rejuvenates acute leg blood flow responses to feeding and exercise. J Appl Physiol. 2012;112:347–353. doi: 10.1152/japplphysiol.01031.2011. [DOI] [PubMed] [Google Scholar]
- Phillips BE, Atherton PJ, Varadhan K, Wilkinson DJ, Limb M, Selby AL, Rennie MJ, Smith K. Williams JP. Pharmacological enhancement of leg and muscle microvascular blood flow does not augment anabolic responses in skeletal muscle of young men under fed conditions. Am J Physiol Endocrinol Metab. 2014;306:E168–76. doi: 10.1152/ajpendo.00440.2013. [DOI] [PubMed] [Google Scholar]
- Raitakari OT, Lai N, Griffiths K, McCredie R, Sullivan D. Celermajer DS. Enhanced peripheral vasodilation in humans after a fatty meal. J Am Coll Cardiol. 2000;36:417–422. doi: 10.1016/s0735-1097(00)00758-0. [DOI] [PubMed] [Google Scholar]
- Reeves ND, Narici MV. Maganaris CN. Effect of resistance training on skeletal muscle-specific force in elderly humans. J Appl Physiol. 2004;96:885–892. doi: 10.1152/japplphysiol.00688.2003. [DOI] [PubMed] [Google Scholar]
- Seals DR, Walker AE, Pierce GL. Lesniewski LA. Habitual exercise and vascular ageing. J Physiol. 2009;587:5541–5549. doi: 10.1113/jphysiol.2009.178822. [DOI] [PMC free article] [PubMed] [Google Scholar]
- Singh MAF. Exercise comes of age: rationale and recommendations for a geriatric exercise prescription. J Gerontol A Biol Sci Med Sci. 2002;57:M262–82. doi: 10.1093/gerona/57.5.m262. [DOI] [PubMed] [Google Scholar]
- Sjøberg KA, Rattigan S, Hiscock N, Richter EA. Kiens B. A new method to study changes in microvascular blood volume in muscle and adipose tissue: real-time imaging in humans and rat. Am J Physiol Heart Circ Physiol. 2011;301:H450–458. doi: 10.1152/ajpheart.01174.2010. [DOI] [PubMed] [Google Scholar]
- Skilton MR, Lai NT, Griffiths KA, Molyneaux LM, Yue DK, Sullivan DR. Celermajer DS. Meal-related increases in vascular reactivity are impaired in older and diabetic adults: insights into roles of aging and insulin in vascular flow. Am J Physiol Heart Circ Physiol. 2005;288:H1404–1410. doi: 10.1152/ajpheart.00484.2004. [DOI] [PubMed] [Google Scholar]
- Smith GI, Atherton P, Villareal DT, Frimel TN, Rankin D, Rennie MJ. Mittendorfer B. Differences in muscle protein synthesis and anabolic signaling in the post-absorptive state and in response to food in 65–80 year old men and women. PLoS One. 2008;3:e1875. doi: 10.1371/journal.pone.0001875. [DOI] [PMC free article] [PubMed] [Google Scholar]
- Smith GI, Villareal DT, Sinacore DR, Shah K. Mittendorfer B. Muscle protein synthesis response to exercise training in obese, older men and women. Med Sci Sports Exerc. 2012;44:1259–1266. doi: 10.1249/MSS.0b013e3182496a41. [DOI] [PMC free article] [PubMed] [Google Scholar]
- Strasser B, Keinrad M, Haber P. Schobersberger W. Efficacy of systematic endurance and resistance training on muscle strength and endurance performance in elderly adults–a randomized controlled trial. Wien Klin Wochenschr. 2009;121:757–764. doi: 10.1007/s00508-009-1273-9. [DOI] [PubMed] [Google Scholar]
- Timmerman KL, Dhanani S, Glynn EL, Fry CS, Drummond MJ, Jennings K, Rasmussen BB. Volpi E. A moderate acute increase in physical activity enhances nutritive flow and the muscle protein anabolic response to mixed nutrient intake in older adults. Am J Clin Nutr. 2012;95:1403–1412. doi: 10.3945/ajcn.111.020800. [DOI] [PMC free article] [PubMed] [Google Scholar]
- Timmerman KL, Lee JL, Fujita S, Dhanani S, Dreyer HC, Fry CS, Drummond MJ, Sheffield-Moore M, Rasmussen BB. Volpi E. Pharmacological vasodilation improves insulin-stimulated muscle protein anabolism but not glucose utilization in older adults. Diabetes. 2010;59:2764–2771. doi: 10.2337/db10-0415. [DOI] [PMC free article] [PubMed] [Google Scholar]
- Toth MJ, LeWinter MM, Ades PA. Matthews DE. Impaired muscle protein anabolic response to insulin and amino acids in heart failure patients: relationship with markers of immune activation. Clin Sci (Lond) 2010;119:467–476. doi: 10.1042/CS20100110. [DOI] [PMC free article] [PubMed] [Google Scholar]
- Vincent MA, Clerk LH, Lindner JR, Price WJ, Jahn LA, Leong-Poi H. Barrett EJ. Mixed meal and light exercise each recruit muscle capillaries in healthy humans. Am J Physiol Endocrinol Metab. 2006;290:E1191–1197. doi: 10.1152/ajpendo.00497.2005. [DOI] [PubMed] [Google Scholar]
- Volpi E, Mittendorfer B, Rasmussen BB. Wolfe RR. The response of muscle protein anabolism to combined hyperaminoacidemia and glucose-induced hyperinsulinemia is impaired in the elderly. J Clin Endocrinol Metab. 2000;85:4481–4490. doi: 10.1210/jcem.85.12.7021. [DOI] [PMC free article] [PubMed] [Google Scholar]
- Weber T, Beijer Å, Rosenberger A, Mulder E, Yang P, Schönau E, Bloch W. Rittweger J. Vascular adaptations induced by 6 weeks WBV resistance exercise training. Clin Physiol Funct Imaging. 2013;33:92–100. doi: 10.1111/j.1475-097X.2012.01166.x. [DOI] [PubMed] [Google Scholar]
- Wei K, Jayaweera AR, Firoozan S, Linka A, Skyba DM. Kaul S. Quantification of myocardial blood flow with ultrasound-induced destruction of microbubbles administered as a constant venous infusion. Circulation. 1998;97:473–483. doi: 10.1161/01.cir.97.5.473. [DOI] [PubMed] [Google Scholar]
- Welinder C. Ekblad L. Coomassie staining as loading control in Western blot analysis. J Proteome Res. 2011;10:1416–1419. doi: 10.1021/pr1011476. [DOI] [PubMed] [Google Scholar]
- Wilkes EA, Selby AL, Atherton PJ, Patel R, Rankin D, Smith K. Rennie MJ. Blunting of insulin inhibition of proteolysis in legs of older subjects may contribute to age-related sarcopenia. Am J Clin Nutr. 2009;90:1343–1350. doi: 10.3945/ajcn.2009.27543. [DOI] [PubMed] [Google Scholar]
- Wilkinson DJ, Hossain T, Hill DS, Phillips BE, Crossland H, Williams J, Loughna P, Churchward-Venne TA, Breen L, Phillips SM, Etheridge T, Rathmacher JA, Smith K, Szewczyk NJ. Atherton PJ. Effects of Leucine and its metabolite, β-hydroxy-β-methylbutyrate (HMB) on human skeletal muscle protein metabolism. J Physiol. 2013;59:2911–2923. doi: 10.1113/jphysiol.2013.253203. [DOI] [PMC free article] [PubMed] [Google Scholar]
- Wilkinson SB, Phillips SM, Atherton PJ, Patel R, Yarasheski KE, Tarnopolsky MA. Rennie MJ. Differential effects of resistance and endurance exercise in the fed state on signalling molecule phosphorylation and protein synthesis in human muscle. J Physiol. 2008;586:3701–3717. doi: 10.1113/jphysiol.2008.153916. [DOI] [PMC free article] [PubMed] [Google Scholar]
- Williams JP, Phillips BE, Smith K, Atherton PJ, Rankin D, Selby AL, Liptrot S, Lund J, Larvin M. Rennie MJ. Effect of tumor burden and subsequent surgical resection on skeletal muscle mass and protein turnover in colorectal cancer patients. Am J Clin Nutr. 2012;96:1064–1070. doi: 10.3945/ajcn.112.045708. [DOI] [PubMed] [Google Scholar]
- Wolfe RR. The underappreciated role of muscle in health and disease. Am J Clin Nutr. 2006;84:475–482. doi: 10.1093/ajcn/84.3.475. [DOI] [PubMed] [Google Scholar]