

Abstract
Background and Purpose
Recent reports have suggested that salidroside could protect cardiomyocytes from oxidative injury and stimulate glucose uptake in skeletal muscle cells by activating AMP-activated protein kinase (AMPK). The aim of this study was to evaluate the therapeutic effects of salidroside on diabetic mice and to explore the underlying mechanisms.
Experimental Approach
The therapeutic effects of salidroside on type 2 diabetes were investigated. Increasing doses of salidroside (25, 50 and 100 mg·kg−1·day−1) were administered p.o. to db/db mice for 8 weeks. Biochemical analysis and histopathological examinations were conducted to evaluate the therapeutic effects of salidroside. Primary cultured mouse hepatocytes were used to further explore the underlying mechanisms in vitro.
Key Results
Salidroside dramatically reduced blood glucose and serum insulin levels and alleviated insulin resistance. Hypolipidaemic effects and amelioration of liver steatosis were observed after salidroside administration. In vitro, salidroside dose-dependently induced an increase in the phosphorylations of AMPK and PI3K/Akt, as well as glycogen synthase kinase 3β (GSK3β) in hepatocytes. Furthermore, salidroside-stimulated AMPK activation was found to suppress the expression of PEPCK and glucose-6-phosphatase. Salidroside-induced AMPK activation also resulted in phosphorylation of acetyl CoA carboxylase, which can reduce lipid accumulation in peripheral tissues. In isolated mitochondria, salidroside inhibited respiratory chain complex I and disturbed oxidation/phosphorylation coupling and moderately depolarized the mitochondrial membrane potential, resulting in a transient increase in the AMP/ATP ratio.
Conclusions and Implications
Salidroside exerts an antidiabetic effect by improving the cellular metabolic flux through the activation of a mitochondria-related AMPK/PI3K/Akt/GSK3β pathway
Tables of Links
| Ligands | |
|---|---|
| ADP | Glutamate |
| AMP | Insulin |
| ATP | LY294002 |
| cAMP | Malate |
| Compound C | Metformin |
| Dexamethasone | Succinate |
These Tables list key protein targets and ligands in this article which are hyperlinked to corresponding entries in http://www.guidetopharmacology.org, the common portal for data from the IUPHAR/BPS Guide to PHARMACOLOGY (Pawson et al., 2014) and are permanently archived in the Concise Guide to PHARMACOLOGY 2013/14 (a,bAlexander et al., 2013a,b).
Introduction
Type 2 diabetes is a chronic metabolic disorder characterized by impaired homeostasis of lipid and carbohydrate metabolism, which ultimately results in insulin resistance and subsequent hyperglycaemia (Zheng et al., 2012). Excessive circulating lipids promote liver and muscle steatosis, which is tightly associated with the development of insulin resistance (Semenkovich, 2006; Zheng et al., 2012). At present, therapy for type 2 diabetes relies mainly on several non-insulin pharmacological agents such as metformin, sulfonylureas, thiazolidinediones, α-glucosidase inhibitors, glucagon-like peptide 1 agonists and dipeptidyl peptidase 4 inhibitors. The mechanisms of action involve reducing hepatic glucose production, stimulating insulin release, improving insulin sensitivity, retarding gut glucose absorption, as well as regulating insulin or glucagon secretion (Moller, 2001; Inzucchi et al., 2012). Notably, metformin is the most widely used first-line drug used for treating type 2 diabetes. In addition to decreasing hepatic glucose production (Miller et al., 2013), its mechanism of action also involves mitochondrial respiratory chain complex I inhibition (Brunmair et al., 2004).
AMP-activated protein kinase (AMPK) is a sensor of cellular energy charge, which becomes activated when the cellular AMP : ATP ratio is high through its interaction with AMP and phosphorylation by upstream kinase (Konrad et al., 2005). Previous studies demonstrated that transiently lowering cellular ATP, by inhibiting mitochondrial oxidative phosphorylation, could result in a greater demand on AMPK activation (Konrad et al., 2001; 2005; Brunmair et al., 2004). Once activated, AMPK can enhance mitochondrial ATP production by stimulating fatty acid oxidation and glucose uptake. AMPK activation suppresses the phosphorylation of insulin receptor substrate-1 (Ser636/639) and activates PI3K/Akt signalling (Tzatsos and Kandror, 2006; Chopra et al., 2012). AMPK also suppresses the dephosphorylation of glycogen synthase kinase 3β (GSK3β; Horike et al., 2008), which can be phosphorylated by Akt. Under physiological conditions, insulin inhibits glycogenolysis by promoting the Akt-dependent phosphorylation of GSK3β (Du et al., 2003).
Salidroside, a phenylpropanoid glycoside compound, is the active ingredient of the root of Rhodiola rosea, which is a precious plant growing at high-altitudes and has been used to treat high-altitude sickness for hundreds of years (Kelly, 2001; Panossian and Wagner, 2005). In an early study it was demonstrated that the Rhodiola tablet, which mainly contains an extract from the root of Rhodiola, improves hypoxia tolerance in people who ascend to high altitudes (Zhang et al., 1989). The levels of salidroside in the root extract of R. rosea is 2.7% (Panossian et al., 2010). Recent reports have suggested that salidroside has beneficial effects on alloxan-induced type 1 diabetic mice (Li et al., 2011a) and reduces the neural injury in streptozotocin-induced type 1 diabetic rats (Qu et al., 2012). Salidroside has also been shown to protect cardiomyocytes from oxidative injury activating the PI3K/Akt pathway (Zhu et al., 2011) and to stimulate glucose uptake in skeletal muscle cells by activating AMPK (Li et al., 2008) in vivo. However, whether or not salidroside is a suitable treatment for type 2 diabetes has not been elucidated.
In the present study, we investigated the effect of salidroside on db/db mice, a widely recognized rodent model for type 2 diabetes, and further explored its underlying mechanisms both in vivo and in vitro. We found that salidroside, indeed, has potential as a treatment for type 2 diabetes and its antidiabetic action was associated with a mitochondria- dependent AMPK/PI3K/Akt/GSK3β pathway in many of the affected tissues.
Methods
Animals
All experimental procedures were performed in accordance with International Guidelines for Care and Use of Laboratory Animals and were approved by the Animal Ethics Committee of Tongji Medical College, Huazhong University of Science and Technology. All studies involving animals are reported in accordance with the ARRIVE guidelines for reporting experiments involving animals (Kilkenny et al., 2010; McGrath et al., 2010). Every effort was made to minimize animal suffering and reduce the number of animals used. Male wild-type (WT) C57BLKS mice and C57BLKS/Leprdb (db/db) mice (8 weeks old) were purchased from the National Resource Centre for Mutant Mice (NRCMM; Nanjing, China). The animals were housed at 22 ± 2°C, 45–75% relative humidity and 12 h light–dark cycle. Before the experiment, the mice were kept for 1 week to acclimatize them to the conditions. Mice were treated p.o. with vehicle (0.9% saline), metformin (Beijing Coway Pharm. Co., Ltd, Beijing, China; 200 mg·kg−1·day−1) and salidroside (purity < 98%, National Institute for Food and Drug Control, Beijing, China; 25, 50 and 100 mg·kg−1·day−1; n = 12) for 8 weeks and then killed under anaesthesia after the blood samples had been collected. Liver, skeletal, adipose and pancreas tissues were obtained and liver weights (LW) measured. Male WT mice, 7 weeks of age, were randomly divided into two groups, treated with vehicle or salidroside (100 mg·kg−1·day−1) for 13 weeks (n = 7) and housed as stated above. A total of 26 male wild-type (WT) C57BLKS mice and 60 C57BLKS/Leprdb (db/db) mice were used in our experiments for in vivo research, and 30 male C57BL/6 mice were used for isolation of primary mouse hepatocytes in our experiments for in vitro research.
Glucose, body weight (BW) and serum insulin measurements
Postprandial blood glucose and BW of mice were monitored weekly after removal of food for 2 h (Hagberg et al., 2012). Glucose measurements were performed on blood drawn from the tail vein using glucose monitors (LifeScan, Inc., Milpitas, CA, USA). For the measurements of serum insulin levels, food was removed overnight for a maximum of 16 h, fasted blood glucose levels were detected and blood was then collected, and serum insulin concentrations were measured using an elisa kit (Abcam, Cambridge, MA, USA). The homeostasis model assessment-insulin resistance (HOMA-IR) index was calculated as previously described (Hsu et al., 2013).
I.p. glucose tolerance test (IPGTT) and i.p. insulin tolerance test (IPITT)
IPGTT and IPITT were performed in the morning on non-fasted mice that had their food removed 1 h before the experiment and were injected with either glucose or insulin i.p. as described previously (Hagberg et al., 2012; IPGTT 1 mg glucose g−1 BW and IPITT 1 mU insulin g−1 BW).
Biochemical analyses
The total cholesterol (TC), triglycerides (TG), HDL cholesterol (HDL-C), LDL cholesterol (LDL-C) and non-esterified fatty acid (NEFA) levels in serum were determined using commercial kits (BiosinoBio-Technology and Science Inc., Beijing, China) according to the manufacturer's instructions. TC and TG contents in livers and skeletal muscles were analysed as described previously (Han et al., 2009). Measurements of lipids were normalized to those of weights in the initial homogenate. NEFA levels in serum and glycogen contents in livers and skeletal muscles were analysed using commercial kits (Nanjing Jiancheng Bioengineering Institute, Nanjing, China) according to the manufacturer's instructions.
Histological analysis of liver, adipose and pancreas tissues
After the animals were killed, the excised livers, adipose and pancreas were rapidly fixed in 10% neutral-buffered formalin solution. After being embedded in paraffin, they were cut into 5 μm-thick sections and stained with haematoxylin-eosin (H&E). For the analysis of liver lipid infiltration, pieces of liver tissue were fixed and dehydrated in 30% sucrose solution at room temperature, and then were immersed in Optimal Cutting Temperature solution on dry ice for Oil Red O staining. The degree of lipid infiltration on H&E staining was scored on a scale of 0–4 with 0 being normal healthy tissue typically seen in WT mice and 4 being the worst, as described previously (Li et al., 2011b). Images of H&E staining of slices of adipose tissue were analysed using Cell Profiler Software as described previously (Trajkovski et al., 2011). For the immunohistochemical analysis of adipose tissues, the sections were stained with CD68 antibody (BA3638, Boster Biotechnology, Wuhan, China) at a 1:150 concentration followed by counter staining with haematoxylin. The nuclei of more than 1000 cells per mouse were counted. The ratio of CD68-positive nuclei was calculated as the number of nuclei of CD68-expressing cells divided by the total number of nuclei in section of each sample as described previously (Kamei et al., 2006). The size of pancreatic islet was determined from manually traced islet area as described previously (Shiota et al., 2012).
Culture of mouse hepatocytes
Primary hepatocytes were isolated from C57BL/6 mice as described previously (Collins et al., 2007; Chen et al., 2012). Briefly, the C57BL/6 mice were anaesthetized, and then Ca2+-free Hanks' balanced solution was perfused at 5 mL·min−1 for 8 min via the portal vein. The livers were treated in vivo until the procedure of continuous perfusion with serum-free DMEM containing 50 U·mL−1 collagenase type II (Invitrogen, Grand Island, NY, USA) and HEPES (15 mM). The viability of hepatocytes was examined with Trypan blue exclusion and only cells with viability over 95% were used. Primary hepatocytes were plated into collagen-coated 6-well plates or 35-mm dishes (5 × 10⁵ per well or dish) in DMEM with 10% FBS. Cells were grown to 70% confluence and then incubated in serum-free medium overnight before treatments. Cell viability was determined using the Cell Counting Kit-8 (Dojindo Laboratories, Kumamoto, Japan) according to the manufacturer's instructions.
RNA interference
For RNA interference experiments, HepG2 (China Center for Type Culture Collection, Wuhan, China) were transfected with 10 nM AMPK α1/α2 (sc-45312) or scrambled (sc-37007) short interfering RNA (siRNA; Santa Cruz Biotechnology, Santa Cruz, CA, USA) using Hiperfect transfection reagent (Qiagen, Valencia, CA, USA) for 48 h according to the manufacturer's instructions.
Glucose production assay
The glucose production from hepatocytes was measured as described previously (Collins et al., 2007). Briefly, primary mouse hepatocytes were incubated in the serum-free medium overnight and pretreated with 10 μM AMPK inhibitor Compound C (Sigma-Aldrich, St Louis, MO, USA) (Chanda et al., 2009) or 30 μM PI3K inhibitor LY294002 (Sigma-Aldrich; Matsumoto et al., 2006) for 30 min, followed by 10 μM salidroside, 10 nM insulin (Sigma-Aldrich) or 1 mM AMPK activator 5-aminoimidazole-4-carboxamide-1-β-d-ribofuranoside (AICAR; Selleckchem, Houston, TX, USA; Koo et al., 2005) for 3 h. After being washed with the pre-warmed glucose-free DMEM medium, cells were stimulated with 500 nM dexamethasone (Sigma-Aldrich) plus 100 μM cAMP (Sigma-Aldrich) in the presence of salidroside, insulin or AICAR for 3 h in glucose-free DMEM medium. Gluconeogenic substrates including 2 mM sodium pyruvate (Sigma-Aldrich) and 20 mM sodium lactate (Sigma-Aldrich; Collins et al., 2007) were added to some groups of cells. The glucose production via gluconeogenesis was then quantified. Glucose in the medium was quantified by using a glucose assay kit (BiosinoBio-Technology and Science Inc.) and normalized to cellular protein concentration. The protein concentration of the samples of each group was determined by using BCA protein assay kit (Thermo Scientific, Rockford, IL, USA) according to the manufacturer's instructions.
RNA extraction and real-time PCR
Total RNA was extracted from primary mouse hepatocytes using the TRIzol reagent (Invitrogen) and used to synthesize the first-strand cDNAs by using the RevertAid first-strand cDNA synthesis kit (Thermo Scientific). qPCR was performed using an ABI PRISM 7700 Sequence Detection System and SYBR Green qPCR kit (TOYOBO, Osaka, Japan). Primer sepuences are listed in Supporting Information Table S1. Expression levels were normalized to β-actin.
Lipid accumulation in primary mouse hepatocytes
Primary mouse hepatocytes were incubated in the serum-free medium overnight and treated for additional 24 h with 10 μM salidroside in the presence of 30 mM high glucose and 100 nM insulin (Li et al., 2011b). After treatment, Oil Red O staining was performed. Lipid content was measured as previously described (Hsu et al., 2012).
Western blotting
The experiments were carried out as described previously (Bian et al., 2014). The following primary antibodies were used at 1:1000 dilution: anti-AMPKα (#2532), anti-phospho-AMPKα Thr172 (#2535), anti-phospho-GSK3β Ser9 (#5558), anti-Acetyl CoA carboxylase (ACC; #3676), anti-ACC Ser79 (#3661) and anti-β-actin (#4970) purchased from Cell Signaling Technology (Beverly, MA, USA); anti-phospho-Akt Ser473 (#2118-1) purchased from Epitomics (Burlingame, CA, USA); anti-Akt (A0001) purchased from ABclonal Technology (ABclonal Biotech Co., Ltd., Cambridge, MA, USA); anti-GSK3β (22104-1-AP) purchased from Proteintech Group (Chicago, IL, USA) and anti-GLUT4 (sc-53566) purchased from Santa Cruz Biotechnology Inc. The goat anti-rabbit (A21020) and goat anti-mouse (A21010) secondary antibodies from Abbkine (Redlands, CA, USA) were used at 1:10 000 dilution.
Adenine nucleotide measurements and mitochondrial membrane potential (Δψm) assay
Cellular ATP and AMP levels were determined as described previously (Dasgupta and Milbrandt, 2007). The Δψm assay was based on a previous report (Qiu et al., 2010). Briefly, HepG2 were seeded in a 96-well plate and incubated in the serum-free medium overnight, and then treated with salidroside (0.1, 1, 10 μM) for 12 h. After being rinsed, a fresh medium containing 5, 5, 6, 6-tetrachloro-1, 1, 3, 3-tetraethylbenzimidazolcarbocyanine iodide (JC-1; Beyotime, China) was added to each well. Plates were incubated for 20 min in a humidified chamber with a 5% CO2 and 95% air mixture at 37°C, and each well was washed three times with Krebs-Ringer phosphate HEPES buffer. Fluorescence was measured with a microplate reader (Tecan Infinite 200 PRO, Tecan, Männedorf, Switzerland). The ratio of 530/610 nm (excitation/emission) to 485/535 nm reflects the Δψm. To assay the effects of short-time treatment of salidroside on Δψm, cells were preloaded with JC-1 after being deprived of serum. After the basal fluorescence had been measured, salidroside was added, and then the fluorescence was measured every 5 min until 30 min.
Determination of oxygen consumption rates
Liver mitochondria were prepared from 8-week-old male WT mice by using the Mitochondria Isolation kit (Nanjing Jiancheng Bioengineering Institute) according to the manufacturer's instruction. Oxygen consumption was measured with a clark-type oxygen electrode (Hansatech Instruments, Norfolk, UK) at 37°C in respiration buffer (Lefort et al., 2010). Mitochondria were pre-incubated for 3 min in respiration buffer additionally containing the indicated concentrations of salidroside or KCl. Oxygen consumption rates were measured in the presence of the substrate of interest: for complex I (5 mM glutamate + 5 mM malate), for complex II (10 mM succinate) + 4.5 μM rotenone. Subsequently, ADP was added to accelerate mitochondrial respiration, and finally the respiratory control rate (RCR) and ADP-to-oxygen ratio (P/O) were calculated as previously described (Brunmair et al., 2004).
Statistical analysis
All data are expressed as the means ± SEM from at least three independent experiments. SPSS 13.0 (SPSS, Inc., Chicago, IL, USA) was used for statistical analysis. Student's unpaired t-test was performed to analyse individual group statistical comparisons. Multiple-group comparisons were evaluated by one-way anova with post hoc testing. Values of P < 0.05 were considered to be statistically significant.
Results
Salidroside protects db/db mice against the onset of type 2 diabetes
Compared with saline control, salidroside (25, 50, 100 mg·kg−1·day−1) administered p.o. for 8 weeks improved hyperglycaemia in a dose-dependent manner in db/db mice and the maximum effect of 100 mg·kg−1·day−1 salidroside was similar to that of 200 mg·kg−1·day−1 metformin, although the initial decrease in glucose was lower than that induced by metformin (Figure 1A). However, there were no detectable changes in the BW of db/db mice treated with salidroside compared with their vehicle controls (Figure 1B). Since a feature of type 2 diabetes is glucose intolerance and insulin resistance (Eckel et al., 2005), we carried out glucose tolerance and insulin tolerance tests. In IPGTT and IPITT, salidroside treatment at concentrations of 25, 50 and 100 mg·kg−1·day−1 improved glucose tolerance and insulin sensitivity, which are both impaired in db/db mice (Figure 1C, D). The levels of serum insulin and the HOMA-IR index were markedly enhanced in db/db diabetic mice; these were also reversed by p.o. administration of salidroside and metformin (Figure 1E, F). We also tested the effect of salidroside in WT mice in our preliminary experiments. We found there were no changes in the postprandial blood glucose and BW of the WT mice during salidroside treatment (Supporting Information Fig. S1).
Figure 1.

Antidiabetic effect of salidroside (SAL) on db/db mice. Vehicle, metformin (Met) or SAL were administered orally to 9-week-old C57BLKS (WT) or db/db mice for 8 weeks, and postprandial blood glucose (A), BW (B), IPGTT (C) and IPITT (D) and AUC levels, fast serum insulin (E) and HOMA-IR index (F) were determined. ††P < 0.01 versus WT treated with vehicle; *P < 0.05, **P < 0.01 versus db/db mice treated with vehicle. Values are means ± SEM (A, B, n = 12; C–F, n = 6). White squares □ = WT; white triangles △ = db/db; white circles ○ = db/db + Met (200 mg·kg−1); black triangles ▴ = db/db + SAL (25 mg·kg−1); black squares ▪ = db/db + SAL (50 mg·kg−1); black circles • = db/db + SAL (100 mg·kg−1).
Salidroside improves lipid profiles in the serum, liver and skeletal muscle, as well as the glycogen in the liver of db/db mice
Figure 2A depicts the effect of salidroside on serum lipid profiles. Dyslipidaemia was ameliorated by salidroside treatment in db/db mice. It was shown that salidroside or metformin treatment inhibited the rise in the levels of serum TC, TG, LDL-C and NEFA in db/db mice. Moreover, salidroside (100 mg·kg−1·day−1) and metformin treatment increased the levels of HDL-C in db/db mice. However, it was noted that the basal levels of HDL-C in untreated db/db mice are also elevated, which is different from humans with obesity or diabetes. In db/db mice liver, significant lipid accumulation could be observed, which was substantially diminished by salidroside treatment in a dose-dependent manner (Figure 2B, C). The LW/BW ratio of db/db mice was increased compared with WT mice, but showed no change during salidroside treatment (Figure 2D). In accord with these results, an increase in liver TC and TG contents was also observed in db/db mice, and salidroside treatment down-regulated TG contents in liver (Figure 2E). Similarly, increases in TC and TG contents in skeletal muscle were also observed in db/db mice, and treatment with salidroside only at dose of 100 mg·kg−1·day−1 resulted in a fall in TG content (Figure 2F). Furthermore, the glycogen levels in the liver were decreased in db/db mice, but were up-regulated after treatment with salidroside (Figure 2G). In addition, both metformin and salidroside had no effects on the TC contents in liver and skeletal muscle tissues, or on the glycogen levels in skeletal muscle tissues (Figure 2H).
Figure 2.

Salidroside improves lipid profiles in the serum, liver and skeletal muscle, as well as the glycogen in the liver of db/db mice. Serum was obtained from WT or db/db mice treated with vehicle or SAL for 8 weeks, and serum TC, TG, HDL-C, LDL-C and NEFA levels (A) were measured. Liver sections were prepared from WT or db/db mice, H&E, oil red O staining (B) and evaluation of hepatic steatosis (C) were carried out. LW was expressed as a % of BW (D). Lipids were extracted from the liver (E) or skeletal muscle (F) of WT or db/db mice and TC or TG levels were measured. Glycogen concentrations were determined in liver tissues (G) and skeletal muscle (H). Scale bar = 300 μm. †P < 0.05; ††P < 0.01 versus WT treated with vehicle; *P < 0.05; **P < 0.01 versus db/db mice treated with vehicle. Values are means ± SEM (A, n = 6; B–F, n = 5; G, H, n = 6).
Effects of salidroside on the pathomorphism of adipose and pancreas tissues in db/db mice
As shown in Figure 3A, the increase in adipocyte size in db/db mice was blunted after salidroside treatment. In addition, CD68 staining reflected that more macrophages were scattered throughout adipose tissues in db/db mice than in WT mice, and salidroside reduced the number of macrophages in adipose tissues (Figure 3B). These results show that salidroside treatment alleviated the inflammation in adipose tissues of db/db mice. Notably, the adipocytes became smaller and the number of macrophages in adipose tissues was reduced after salidroside treatment, which reflects the increased insulin sensitivity (Di Gregorio et al., 2005; Goossens, 2008). Moreover, the pancreatic islets in vehicle-treated db/db mice were larger and had an irregular shape compared with those of WT mice. Metformin or salidroside treatment improved these conditions (Figure 3C). These results reveal that metformin or salidroside treatment improves insulin sensitivity, and consequently alleviates pathological hyperplasia of beta cells.
Figure 3.

Effects of salidroside on the pathomorphism of adipose and pancreas tissues in db/db mice. Adipose and pancreas tissue sections were prepared from WT or db/db mice. H&E staining and automated quantification of the average size of adipocytes (A) or islets (C) and CD68 staining in adipose tissues (B) were determined. Scale bar = 100 μm. ††P < 0.01 versus WT treated with vehicle; *P < 0.05, **P < 0.01 versus db/db mice treated with vehicle. Values are means ± SEM (n = 5).
Effects of salidroside on the activities of AMPK, ACC, Akt and GSK3β in vivo
To investigate whether AMPK, Akt and GSK3β might be responsible for the protective effect of salidroside, protein kinase activities in liver, skeletal muscle and adipose tissues were assessed by determining the phosphorylated forms of AMPK, Akt and GSK3β. As shown in Figure 4A and B, salidroside administered p.o. for 8 weeks was reversed the decreased phosphorylations of AMPK and Akt in liver and muscle tissues, as well as the reduced GLUT4 expression in skeletal muscle. Moreover, salidroside treatment increased the phosphorylations of Akt and GSK3β in skeletal muscle and adipose tissues. However, there was no significant difference in the phosphorylation of GSK3β in liver tissues, or in the phosphorylations of AMPK and ACC in adipose tissues.
Figure 4.

Effects of salidroside on AMPK, ACC, Akt and GSK3β phosphorylation and GLUT4 expression in db/db mice. Immunoblotting of protein extracts from liver, skeletal muscle and adipose tissues of WT or db/db mice treated with vehicle or SAL for 8 weeks. Phosphorylation of AMPK, ACC, Akt and GSK3β (A) and skeletal muscle GLUT4 (B) of WT or db/db mice were determined. †P < 0.05, ††P < 0.01 versus WT treated with vehicle; *P < 0.05, **P < 0.01 versus db/db mice treated with vehicle. Values are means ± SEM (n = 4).
Salidroside increases the phosphorylations of AMPK, ACC, Akt and GSK3β in vitro
In mouse cultured primary hepatocytes, salidroside effectively triggered the phosphorylation of AMPK, ACC, Akt and GSK3β. As shown in Figure 5C and D, salidroside stimulated the phosphorylation of AMPK, ACC, Akt and GSK3β in a time- and concentration-dependent manner. Salidroside treatment at the same doses had no cytotoxic effects on hepatocytes or HepG2 cells (Figure 5A, B).
Figure 5.
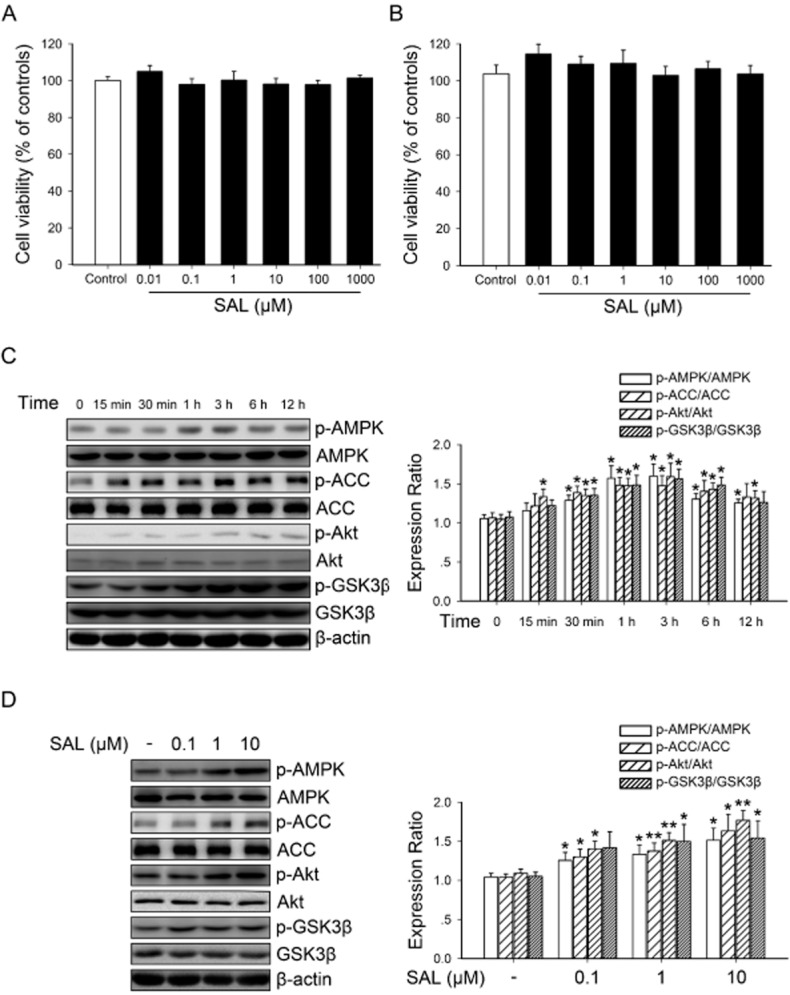
Effects of salidroside on AMPK, ACC, Akt and GSK3β phosphorylation in primary mouse hepatocytes. Primary mouse hepatocytes (A) or HepG2 (B) were incubated in the serum-free medium overnight and treated with 0.01 to 1000 μM SAL for 12 h and then cell viabilities were assayed. After being incubated in the serum-free medium overnight, primary mouse hepatocytes were treated with 10 μM SAL for the indicated periods of time (0–12 h) (C), or treated with SAL (0.1, 1, 10 μM) for 3 h (D). The phosphorylation of AMPK, ACC, Akt and GSK3β were determined by Western blotting. *P < 0.05, **P < 0.01 versus control. Values are means ± SEM (n = 4).
PI3K/Akt pathway is necessary for salidroside-induced AMPK-mediated GSK3β phosphorylation
To examine whether PI3K/Akt activation are necessary for AMPK-mediated GSK3β phosphorylation, hepatocytes were stimulated with salidroside with or without pretreatment with Compound C or LY294002 (Figure 6A, B). Both salidroside-induced and AICAR-induced Akt and GSK3β phosphorylation were inhibited by pre-incubation with the AMPK inhibitor, Compound C. Moreover, both salidroside-induced and insulin-induced Akt and GSK3β phosphorylation were inhibited by pre-incubation with the PI3K inhibitor LY294002, but pretreatment with LY294002 did not alter the phosphorylation of AMPK or ACC induced by salidroside. We further confirmed the role of AMPK in salidroside-induced Akt/GSK3β phosphorylations by using AMPK siRNA. As shown in Figure 6C, treatment with AMPK siRNA markedly suppressed the effect of salidroside on ACC, Akt and GSK3β phosphorylation. Thus, these results reveal that the PI3K/Akt pathway is necessary for salidroside-induced AMPK-mediated GSK3β phosphorylation.
Figure 6.

PI3K/Akt pathway is necessary for SAL-induced AMPK-mediated GSK3β phosphorylation. Cultured hepatocytes were treated with 10 μM Compound C (Comp.C) (A) or 30 μM LY294002 (LY) (B) for 30 min before treatment with 10 μM SAL, 1 mM AICAR or 10 nM insulin for 3 h. Cell lysates were immunoblotted for the phosphorylation of AMPK, ACC, Akt and GSK3β. *P < 0.05, **P < 0.01 versus control; ##P < 0.01 versus SAL alone; †P < 0.05, ††P < 0.01 versus AICAR (A) or insulin (B) alone. Values are means ± SEM (n = 4). HepG2 were transfected with AMPK or scrambled siRNA for 48 h, then cells were treated with 10 μM SAL for 3 h (C). Cell lysates were immunoblotted for the phosphorylation of AMPK, ACC, Akt and GSK3β. *P < 0.05, **P < 0.01 versus scrambled siRNA without SAL. Values are means ± SEM (n = 3).
AMPK activation by salidroside suppresses hepatic gluconeogenesis and lipid accumulation in hepatocytes
The hallmarks of type 2 diabetes are excessive hepatic glucose production and an abnormal lipid profile (Marchesini et al., 2001; Zheng et al., 2012). In liver, the activation of AMPK results in a decreased production of glucose as well as improved lipid homeostasis (Zang et al., 2004; Matsumoto et al., 2007). To confirm these results, we assessed the role of AMPK activation induced by salidroside in hepatic gluconeogenesis and lipid accumulation in hepatocytes. As shown in Figure 7A–D and Supporting Information Fig. S2A, salidroside indeed inhibited hepatic gluconeogenesis and suppressed gene expressions of glucose-6-phosphatase (G6Pase) and PEPCK, and these effects were prevented by blockade of AMPK activity. Moreover, as shown in Figure 7E–G, to further elucidate the mechanism by which salidroside-induced phosphorylation of AMPK regulates de novo lipogenesis in hepatocytes, the effects of salidroside on the activation of AMPK and ACC were determined in hepatocytes under high glucose plus insulin condition, mimicking hyperglycaemia and insulin resistance in vivo (Li et al., 2011b). Noticeably, salidroside stimulated the phosphorylation of AMPK and ACC in hepatocytes exposed to high glucose plus insulin. In addition, lipid analysis and Oil Red O staining showed that lipid accumulation was substantially reduced by salidroside. Moreover, salidroside enhanced the effects of insulin-stimulated phosphorylation of Akt and GSK3β in hepatocytes exposed to high glucose plus insulin (Figure 7H).
Figure 7.

AMPK activation may account for the inhibitory effects of salidroside on hepatic gluconeogenesis or on de novo fatty acid synthesis in primary mouse hepatocytes exposed to high glucose (HG) plus insulin. Cells were pretreated as described in Methods. The glucose production via gluconeogenesis was quantified (A, B). G6Pase and PEPCK mRNAs were subsequently measured by qPCR and normalized to β-actin (C, D). ††P < 0.01 versus control; *P < 0.05, **P < 0.01 versus dexamethasone/cAMP (Dex/cAMP) alone; #P < 0.05, ##P < 0.01 versus dexamethasone/cAMP (Dex/cAMP) plus SAL, AICAR or insulin respectively. Values are means ± SEM (n = 3). Hepatocytes were cultured in DMEM containing normal glucose (5.5 mM) overnight. Cells were then incubated in the serum-free medium overnight and treated for additional 24 h with SAL (10 μM) in the presence of HG (30 mM) and insulin (100 nM). After treatment, Oil Red O staining (E), lipid content (F) measurement were performed, and levels of p-AMPK and p-ACC (G) and insulin (10 nM, 20 min)-stimulated p-Akt and p-GSK3β (H) levels were determined by Western blotting. Scale bar: 200 μm. ††P < 0.01 versus normal glucose groups; *P < 0.05 versus HG plus insulin groups. Values are means ± SEM (n = 4).
Salidroside moderately depolarizes Δψm and inhibits mitochondrial respiration at complex I and disrupts oxidation/phosphorylation coupling
To examine whether the effects of salidroside-induced AMPK activation may be mediated by cellular metabolic changes, we conducted adenine nucleotide measurements and Δψm detections. As shown in Figure 8A and Supporting Information Fig. S2B, the AMP: ATP ratio increased after stimulation with salidroside in a concentration-dependent manner in both primary mouse hepatocytes and HepG2. The effect of salidroside on Δψm was also examined. A decrease in Δψm was noted when HepG2 were treated with salidroside for 12 h (Figure 8B). Kinetic measurements of Δψm within 30 min showed that a slight decrease was observed at each time point after stimulation with salidroside, when compared with that of control HepG2 cells (Figure 8C). Next, we detected oxygen consumption in isolated mitochondria. As shown in Figure 8D and Supporting Information Fig. S2C, in the presence of substrates for omplex I, salidroside reduced state 3 and 4 respiration rates, which represent the ADP-evoked respiration rate and resting respiration rate respectively. Furthermore, salidroside reduced RCR and the P/O in the presence of glutamate + malate. However, salidroside only mildly reduced state 3 respiration and respiratory control ratio of isolated mitochondria when incubated with succinate + rotenone.
Figure 8.

Activation of AMPK results from cellular metabolic changes induced by salidroside. Primary mouse hepatocytes were incubated in the serum-free medium overnight and treated with SAL (0.1, 1, 10 μM) for 12 h and then cellular AMP/ATP levels (A) were measured. After serum starvation, HepG2 were pretreated as described in Methods, the fluorescence was detected and Δψm was calculated (B, C). Oxygen consumption rates in isolated mitochondria were determined after treatment with SAL or KCl in the presence of substrates for complex I or II (D). The representative trace of this assay is referenced in Supporting Information Fig. S2C. Schematic diagram of SAL's action (E). CPT1, carnitine palmitoyltransferase 1; GS, glycogen synthase. *P < 0.05, **P < 0.01 versus control. Values are means ± SEM (n = 4).
Discussion and conclusions
The present study systematically investigated the pharmacological effects of salidroside in db/db mice, the rodent model for type 2 diabetes. We found that salidroside had a significant therapeutic action against type 2 diabetes by ameliorating insulin resistance and the underlying molecular mechanisms were associated with a mitochondria-related AMPK/PI3K/Akt/GSK3β signalling pathway.
Compared with WT mice, db/db mice developed a stably higher blood glucose and salidroside treatment effectively decreased blood glucose in db/db mice. Furthermore, db/db mice treated with salidroside showed more glucose tolerance and higher insulin sensitivity than untreated db/db mice. Importantly, the down-regulated phosphorylation of AMPK and Akt in liver and muscle tissues, as well as the reduction in GLUT4 expression in skeletal muscles in db/db mice were restored by salidroside treatment. Moreover, salidroside treatment dramatically increased the phosphorylation of Akt and GSK3β in adipose tissues. In vitro, salidroside caused a time- and dose-dependent increase in the phosphorylation of AMPK, Akt and GSK3β in hepatocytes. These observations indicate that the phosphorylation and activation of AMPK, Akt and GSK3β upon salidroside treatment may account for the salutary effects of salidroside on hyperglycaemia, hepatic steatosis and hyperlipidemia-related insulin resistance in vivo. In addition, salidroside-treated db/db mice exhibited an increased number of smaller adipocytes and a decreased number of larger ones. Notably, smaller adipocytes have been reported to be associated with increased insulin sensitivity in human and rodent animals (Trajkovski et al., 2011). These morphological observations also support the finding that salidroside treatment can ameliorate insulin resistance. Moreover, Akt and GSK3β are also possible targets for pharmacological intervention to promote beta cell survival (Srinivasan et al., 2005). Our results demonstrated that salidroside increases AMPK, Akt and GSK3β phosphorylation both in vivo and in vitro.
AMPK is composed of a catalytic α subunit and regulatory β/γ subunits. AMPK activation requires phosphorylation of the activation loop (Thr172) in the kinase domain of the α catalytic subunit (Suzuki et al., 2013). Under catabolic conditions, ATP is converted to ADP, which leads to the subsequent production of AMP through the activation of adenylate kinase. Increased cellular AMP induces allosteric activation of AMPK by binding to the AMPK γ regulatory subunit. Moreover, once phosphorylated on Thr172, AMPK is further directly activated by 2∼5-fold by AMP, and AMP binding also suppresses its inactivation due to dephosphorylation of Thr172 by protein phosphatases 2A and 2C (Oakhill et al., 2011). Activation of AMPK by metformin has been shown to decrease glucose production and to increase fatty acid oxidation in the liver (Hawley et al., 2002; Zang et al., 2004). Administration of the AMPK activator, AICAR, improves glucose tolerance and normalizes lipid profiles in the insulin-resistant Zucker rat (Buhl et al., 2002). Given the essential role of the AMP:ATP ratio in AMPK activation, we performed adenine nucleotide measurements. The AMP:ATP ratios in both primary mouse hepatocytes and HepG2 were increased by salidroside, which is similar to the effects of salidroside in skeletal muscle cells (Li et al., 2008). These results indicate that the AMPK-mediated signalling pathway is involved in the action of salidroside. To identify whether AMPK activated by salidroside was responsible for the phosphorylation of Akt and GSK3β, cells were treated with the selective AMPK inhibitor, Compound C. Pretreatment with Compound C reduced the salidroside-stimulated increase in the phosphorylation of Akt and GSK3β. Moreover, pretreatment with the PI3K inhibitor, LY249002, greatly diminished the phosphorylation of Akt and GSK3β evoked by salidroside or insulin. However, LY294002 did not block salidroside-stimulated AMPK activation. Thus, salidroside not only induced activation of AMPK but also caused the phosphorylation of Akt and GSK3β in an AMPK-dependent manner. These results indicate that the AMPK/PI3K/Akt/GSK3β signalling cascade is responsible for salidroside's pharmacological action.
The liver controls blood glucose levels mainly through glycogenolysis and gluconeogenesis. During fasting, the induction of hepatic gluconeogenesis is crucial to ensure proper energy homeostasis. Such an induction is dysregulated when hepatic insulin signalling goes awry in type 2 diabetes, resulting in excessive glucose production and further contributing to fasting hyperglycaemia in diabetes (Biddinger and Kahn, 2006; Kim et al., 2011; Sakai et al., 2012). Insulin negatively regulates the transcription of genes involved in hepatic glucose production such as those encoding PEPCK and G6Pase (Accili, 2004). AMPK and Akt act in the same direction in the liver by repressing the expressions of PEPCK and G6Pase (Lochhead et al., 2000; Towler and Hardie, 2007; Kim et al., 2008). To further confirm the effect of AMPK activation induced by salidroside, we assessed the role of salidroside-induced AMPK activation in hepatic gluconeogenesis. Our observations demonstrate that salidroside indeed inhibited hepatic gluconeogenesis and suppressed gene expressions of PEPCK and G6Pase. Treatment with LY294002 completely blocked the insulin-induced suppression of glucose production. However, LY294002 only partly blocked the inhibitory effect of salidroside on glucose production. Interestingly, Compound C almost completely blocked this effect of salidroside, indicating that salidroside-induced AMPK activation is involved in thisl effect. Furthermore, our results demonstrated that salidroside also stimulates the phosphorylation of AMPK and ACC in hepatocytes exposed to high glucose plus insulin, and aberrant lipid accumulation could be substantially reduced by salidroside. These results provide further insight into the mechanism by which salidroside exerts its beneficial effect on metabolism.
Recently, Qiu et al. reported that AICAR could decrease Δψm and inhibit oxidative phosphorylation in primary mouse hepatocytes (Qiu et al., 2010). A decrease in Δψm of ∼20% was observed when L6 muscle cells were treated with thiazolidinediones and metformin for 30 min (Qiu et al., 2010). In addition, troglitazone acutely reduced the Δψm in muscle cells and robustly stimulated AMPK activity (Konrad et al., 2005). These findings raised the possibility of searching novel therapeutics for diabetes from compounds that modulate mitochondrial function and thus active AMPK (Qiu et al., 2010). These perturbations affect mitochondrial oxidative metabolism, transiently lowering cellular levels of ATP and placing a greater demand on glycolysis to supply essential levels of ATP to maintain cellular viability (Konrad et al., 2005). In this study, we found that salidroside moderately depolarized Δψm in hepatocytes without significant cytotoxicity, and induced an increase in the cellular AMP:ATP ratio and thereafter AMPK activation. This may be due to inhibition of respiratory chain complex I and disruption of the oxidation/phosphorylation coupling in mitochondria. In addition, we have also shown that salidroside protects the endothelium against H2O2-induced injury by promoting mitochondrial biogenesis and function (Xing et al., 2014). Other studies have shown that salidroside has a beneficial effect on vasculogenesis and protects against oxidative endothelial injury (Tang et al., 2014), as well as reducing ischaemia-mediated myocardial damage (Zhong et al., 2010). These findings indicate that salidroside might represent a new therapeutic drug not only for type 2 diabetes, but also for diabetic complications, such as atherosclerosis and diabetic cardiomyopathy.
As summarized in Figure 8E, in the present study salidroside was shown to have antidiabetic effects in db/db mice and its underlying mechanisms were further elucidated both in vivo and in vitro. Specifically, the mild depolarization of the mitochondria-related AMPK/PI3K/Akt/GSK3β signalling pathway was demonstrated to be the major target of this compound isolated from high-altitude plants.
Acknowledgments
This work was supported by grant from the National Natural Science Foundation of China (81373413, 81072634, 81470458 and 81070190), grants from the Ministry of Education of China (NCET-10-0409, 2013YGYL008) as well as from the National Science and Technology Major Projects (2013zx09103-001-020, 2011zx09102-004-001).
Glossary
- ACC
Acetyl CoA carboxylase
- AICAR
5-aminoimidazole-4-carboxamide-1-β-d-ribofuranoside
- AMPK
AMP-activated protein kinase
- BW
body weight
- G6Pase
glucose-6-phosphatase
- GSK3β
glycogen synthase kinase 3β
- HDL-C
HDL cholesterol
- H&E
haematoxylin-eosin
- HOMA-IR index
homeostasis model assessment-insulin resistance index
- IPGTT
i.p. glucose tolerance test
- IPITT
i.p. insulin tolerance test
- JC-1
3-tetraethylbenzimidazolcarbocyanine iodide
- LDL-C
LDL cholesterol
- LW
liver weights
- PEPCK
phosphoenoylpyruvate carboxykinase
- P/O
ADP-to-oxygen ratio
- RCR
respiratory control rate
- SAL
salidroside
- siRNA
short interfering RNA
- TC
total cholesterol
- TG
triglycerides
- WT
wild-type
- Δψm
mitochondrial membrane potential
Author contributions
S. J., T. Z., X. Y. and Y. Z. conceived and designed the study. T. Z., X. Y. and S. J. analysed the research data and wrote the manuscript. T. Z., D. W., S. X., W. L., F. B., J. C., X. B., G. W. and X. C. carried out the experiments.
Conflict of interest
No potential conflicts of interest relevant to this article were reported.
Supporting Information
Figure S1 Effects of salidroside (SAL) on C57BLKS (WT) mice. Vehicle or SAL were administered orally to 7-week-old male WT mice for 13 weeks, and postprandial blood glucose (A), body weight (B), intraperitoneal glucose tolerance test (IPGTT) (C) and intraperitoneal insulin tolerance test (IPITT) (D) and area under curve (AUC) were determined. **P < 0.01 versus WT mice treated with vehicle. Values are means ± SEM (A–D, n = 7). White circles ○ = WT + vehicle; black circles • = WT + SAL (100 mg·kg−1).
Figure S2 (A) SAL enhances the effects of insulin on suppressing glucose production. ††P < 0.01 versus control; *P < 0.05, **P < 0.01 versus dexamethasone/cAMP (Dex/cAMP) alone. (B) HepG2 were incubated in the serum-free medium overnight and treated with SAL (0.1, 1, 10 μM) for 12 h and then cellular AMP/ATP levels were measured. **P < 0.01 versus control. (C) Experiment schematic diagram of oxygen consumption in isolated mitochondria. Values are means ± SEM (A, B, n = 4).
Table S1 qPCR primer sequences.
References
- Accili D. Lilly lecture 2003: the struggle for mastery in insulin action: from triumvirate to republic. Diabetes. 2004;53:1633–1642. doi: 10.2337/diabetes.53.7.1633. [DOI] [PubMed] [Google Scholar]
- Alexander SPH, Benson HE, Faccenda E, Pawson AJ, Sharman JL, Spedding M, et al. The Concise Guide to PHARMACOLOGY 2013/14: transporters. Br J Pharmacol. 2013a;170:1706–1796. doi: 10.1111/bph.12450. [DOI] [PMC free article] [PubMed] [Google Scholar]
- Alexander SPH, Benson HE, Faccenda E, Pawson AJ, Sharman JL, Spedding M, et al. The Concise Guide to PHARMACOLOGY 2013/14: enzymes. Br J Pharmacol. 2013b;170:1797–1867. doi: 10.1111/bph.12451. [DOI] [PMC free article] [PubMed] [Google Scholar]
- Bian F, Yang X, Zhou F, Wu PH, Xing S, Xu G, et al. C-reactive protein promotes atherosclerosis by increasing LDL transcytosis across endothelial cells. Br J Pharmacol. 2014;171:2671–2684. doi: 10.1111/bph.12616. [DOI] [PMC free article] [PubMed] [Google Scholar]
- Biddinger SB, Kahn CR. From mice to men: insights into the insulin resistance syndromes. Annu Rev Physiol. 2006;68:123–158. doi: 10.1146/annurev.physiol.68.040104.124723. [DOI] [PubMed] [Google Scholar]
- Brunmair B, Staniek K, Gras F, Scharf N, Althaym A, Clara R, et al. Thiazolidinediones, like metformin, inhibit respiratory complex I: a common mechanism contributing to their antidiabetic actions? Diabetes. 2004;53:1052–1059. doi: 10.2337/diabetes.53.4.1052. [DOI] [PubMed] [Google Scholar]
- Buhl ES, Jessen N, Pold R, Ledet T, Flyvbjerg A, Pedersen SB, et al. Long-term AICAR administration reduces metabolic disturbances and lowers blood pressure in rats displaying features of the insulin resistance syndrome. Diabetes. 2002;51:2199–2206. doi: 10.2337/diabetes.51.7.2199. [DOI] [PubMed] [Google Scholar]
- Chanda D, Li T, Song KH, Kim YH, Sim J, Lee CH, et al. Hepatocyte growth factor family negatively regulates hepatic gluconeogenesis via induction of orphan nuclear receptor small heterodimer partner in primary hepatocytes. J Biol Chem. 2009;284:28510–28521. doi: 10.1074/jbc.M109.022244. [DOI] [PMC free article] [PubMed] [Google Scholar]
- Chen Z, Sheng L, Shen H, Zhao Y, Wang S, Brink R, et al. Hepatic TRAF2 regulates glucose metabolism through enhancing glucagon responses. Diabetes. 2012;61:566–573. doi: 10.2337/db11-0474. [DOI] [PMC free article] [PubMed] [Google Scholar]
- Chopra I, Li HF, Wang H, Webster KA. Phosphorylation of the insulin receptor by AMP-activated protein kinase (AMPK) promotes ligand-independent activation of the insulin signalling pathway in rodent muscle. Diabetologia. 2012;55:783–794. doi: 10.1007/s00125-011-2407-y. [DOI] [PMC free article] [PubMed] [Google Scholar]
- Collins QF, Liu HY, Pi J, Liu Z, Quon MJ, Cao W. Epigallocatechin-3-gallate (EGCG), a green tea polyphenol, suppresses hepatic gluconeogenesis through 5'-AMP-activated protein kinase. J Biol Chem. 2007;282:30143–30149. doi: 10.1074/jbc.M702390200. [DOI] [PMC free article] [PubMed] [Google Scholar]
- Dasgupta B, Milbrandt J. Resveratrol stimulates AMP kinase activity in neurons. Proc Natl Acad Sci U S A. 2007;104:7217–7222. doi: 10.1073/pnas.0610068104. [DOI] [PMC free article] [PubMed] [Google Scholar]
- Di Gregorio GB, Yao-Borengasser A, Rasouli N, Varma V, Lu T, Miles LM, et al. Expression of CD68 and macrophage chemoattractant protein-1 genes in human adipose and muscle tissues: association with cytokine expression, insulin resistance, and reduction by pioglitazone. Diabetes. 2005;54:2305–2313. doi: 10.2337/diabetes.54.8.2305. [DOI] [PubMed] [Google Scholar]
- Du K, Herzig S, Kulkarni RN, Montminy M. TRB3: a tribbles homolog that inhibits Akt/PKB activation by insulin in liver. Science. 2003;300:1574–1577. doi: 10.1126/science.1079817. [DOI] [PubMed] [Google Scholar]
- Eckel RH, Grundy SM, Zimmet PZ. The metabolic syndrome. Lancet. 2005;365:1415–1428. doi: 10.1016/S0140-6736(05)66378-7. [DOI] [PubMed] [Google Scholar]
- Goossens GH. The role of adipose tissue dysfunction in the pathogenesis of obesity-related insulin resistance. Physiol Behav. 2008;94:206–218. doi: 10.1016/j.physbeh.2007.10.010. [DOI] [PubMed] [Google Scholar]
- Hagberg CE, Mehlem A, Falkevall A, Muhl L, Fam BC, Ortsater H, et al. Targeting VEGF-B as a novel treatment for insulin resistance and type 2 diabetes. Nature. 2012;490:426–430. doi: 10.1038/nature11464. [DOI] [PubMed] [Google Scholar]
- Han MS, Chung KW, Cheon HG, Rhee SD, Yoon CH, Lee MK, et al. Imatinib mesylate reduces endoplasmic reticulum stress and induces remission of diabetes in db/db mice. Diabetes. 2009;58:329–336. doi: 10.2337/db08-0080. [DOI] [PMC free article] [PubMed] [Google Scholar]
- Hawley SA, Gadalla AE, Olsen GS, Hardie DG. The antidiabetic drug metformin activates the AMP-activated protein kinase cascade via an adenine nucleotide-independent mechanism. Diabetes. 2002;51:2420–2425. doi: 10.2337/diabetes.51.8.2420. [DOI] [PubMed] [Google Scholar]
- Horike N, Sakoda H, Kushiyama A, Ono H, Fujishiro M, Kamata H, et al. AMP-activated protein kinase activation increases phosphorylation of glycogen synthase kinase 3beta and thereby reduces cAMP-responsive element transcriptional activity and phosphoenolpyruvate carboxykinase C gene expression in the liver. J Biol Chem. 2008;283:33902–33910. doi: 10.1074/jbc.M802537200. [DOI] [PMC free article] [PubMed] [Google Scholar]
- Hsu CL, Lin YJ, Ho CT, Yen GC. Inhibitory effects of garcinol and pterostilbene on cell proliferation and adipogenesis in 3T3-L1 cells. Food Funct. 2012;3:49–57. doi: 10.1039/c1fo10209e. [DOI] [PubMed] [Google Scholar]
- Hsu FL, Huang CF, Chen YW, Yen YP, Wu CT, Uang BJ, et al. Antidiabetic effects of pterosin A, a small-molecular-weight natural product, on diabetic mouse models. Diabetes. 2013;62:628–638. doi: 10.2337/db12-0585. [DOI] [PMC free article] [PubMed] [Google Scholar]
- Inzucchi SE, Bergenstal RM, Buse JB, Diamant M, Ferrannini E, Nauck M, et al. Management of hyperglycaemia in type 2 diabetes: a patient-centered approach. Position statement of the American Diabetes Association (ADA) and the European Association for the Study of Diabetes (EASD) Diabetologia. 2012;55:1577–1596. doi: 10.1007/s00125-012-2534-0. [DOI] [PubMed] [Google Scholar]
- Kamei N, Tobe K, Suzuki R, Ohsugi M, Watanabe T, Kubota N, et al. Overexpression of monocyte chemoattractant protein-1 in adipose tissues causes macrophage recruitment and insulin resistance. J Biol Chem. 2006;281:26602–26614. doi: 10.1074/jbc.M601284200. [DOI] [PubMed] [Google Scholar]
- Kelly GS. Rhodiola rosea: a possible plant adaptogen. Altern Med Rev. 2001;6:293–302. [PubMed] [Google Scholar]
- Kilkenny C, Browne W, Cuthill IC, Emerson M, Altman DG. Animal research: reporting in vivo experiments: the ARRIVE guidelines. Br J Pharmacol. 2010;160:1577–1579. doi: 10.1111/j.1476-5381.2010.00872.x. [DOI] [PMC free article] [PubMed] [Google Scholar]
- Kim DH, Perdomo G, Zhang T, Slusher S, Lee S, Phillips BE, et al. FoxO6 integrates insulin signaling with gluconeogenesis in the liver. Diabetes. 2011;60:2763–2774. doi: 10.2337/db11-0548. [DOI] [PMC free article] [PubMed] [Google Scholar]
- Kim YD, Park KG, Lee YS, Park YY, Kim DK, Nedumaran B, et al. Metformin inhibits hepatic gluconeogenesis through AMP-activated protein kinase-dependent regulation of the orphan nuclear receptor SHP. Diabetes. 2008;57:306–314. doi: 10.2337/db07-0381. [DOI] [PubMed] [Google Scholar]
- Konrad D, Somwar R, Sweeney G, Yaworsky K, Hayashi M, Ramlal T, et al. The antihyperglycemic drug alpha-lipoic acid stimulates glucose uptake via both GLUT4 translocation and GLUT4 activation: potential role of p38 mitogen-activated protein kinase in GLUT4 activation. Diabetes. 2001;50:1464–1471. doi: 10.2337/diabetes.50.6.1464. [DOI] [PubMed] [Google Scholar]
- Konrad D, Rudich A, Bilan PJ, Patel N, Richardson C, Witters LA, et al. Troglitazone causes acute mitochondrial membrane depolarisation and an AMPK-mediated increase in glucose phosphorylation in muscle cells. Diabetologia. 2005;48:954–966. doi: 10.1007/s00125-005-1713-7. [DOI] [PubMed] [Google Scholar]
- Koo SH, Flechner L, Qi L, Zhang X, Screaton RA, Jeffries S, et al. The CREB coactivator TORC2 is a key regulator of fasting glucose metabolism. Nature. 2005;437:1109–1111. doi: 10.1038/nature03967. [DOI] [PubMed] [Google Scholar]
- Lefort N, Glancy B, Bowen B, Willis WT, Bailowitz Z, De Filippis EA, et al. Increased reactive oxygen species production and lower abundance of complex I subunits and carnitine palmitoyltransferase 1B protein despite normal mitochondrial respiration in insulin-resistant human skeletal muscle. Diabetes. 2010;59:2444–2452. doi: 10.2337/db10-0174. [DOI] [PMC free article] [PubMed] [Google Scholar]
- Li F, Tang H, Xiao F, Gong J, Peng Y, Meng X. Protective effect of salidroside from Rhodiolae radix on diabetes-induced oxidative stress in mice. Molecules. 2011a;16:9912–9924. doi: 10.3390/molecules16129912. [DOI] [PMC free article] [PubMed] [Google Scholar]
- Li HB, Ge YK, Zheng XX, Zhang L. Salidroside stimulated glucose uptake in skeletal muscle cells by activating AMP-activated protein kinase. Eur J Pharmacol. 2008;588:165–169. doi: 10.1016/j.ejphar.2008.04.036. [DOI] [PubMed] [Google Scholar]
- Li Y, Xu S, Mihaylova MM, Zheng B, Hou X, Jiang B, et al. AMPK phosphorylates and inhibits SREBP activity to attenuate hepatic steatosis and atherosclerosis in diet-induced insulin-resistant mice. Cell Metab. 2011b;13:376–388. doi: 10.1016/j.cmet.2011.03.009. [DOI] [PMC free article] [PubMed] [Google Scholar]
- Lochhead PA, Salt IP, Walker KS, Hardie DG, Sutherland C. 5-aminoimidazole-4-carboxamide riboside mimics the effects of insulin on the expression of the 2 key gluconeogenic genes PEPCK and glucose-6-phosphatase. Diabetes. 2000;49:896–903. doi: 10.2337/diabetes.49.6.896. [DOI] [PubMed] [Google Scholar]
- Marchesini G, Brizi M, Bianchi G, Tomassetti S, Bugianesi E, Lenzi M, et al. Nonalcoholic fatty liver disease a feature of the metabolic syndrome. Diabetes. 2001;50:1844–1850. doi: 10.2337/diabetes.50.8.1844. [DOI] [PubMed] [Google Scholar]
- Matsumoto M, Han S, Kitamura T, Accili D. Dual role of transcription factor FoxO1 in controlling hepatic insulin sensitivity and lipid metabolism. J Clin Invest. 2006;116:2464–2472. doi: 10.1172/JCI27047. [DOI] [PMC free article] [PubMed] [Google Scholar]
- Matsumoto M, Pocai A, Rossetti L, Depinho RA, Accili D. Impaired regulation of hepatic glucose production in mice lacking the forkhead transcription factor Foxo1 in liver. Cell Metab. 2007;6:208–216. doi: 10.1016/j.cmet.2007.08.006. [DOI] [PubMed] [Google Scholar]
- McGrath JC, Drummond GB, McLachlan EM, Kilkenny C, Wainwright CL. Guidelines for reporting experiments involving animals: the ARRIVE guidelines. Br J Pharmacol. 2010;160:1573–1576. doi: 10.1111/j.1476-5381.2010.00873.x. [DOI] [PMC free article] [PubMed] [Google Scholar]
- Miller RA, Chu Q, Xie J, Foretz M, Viollet B, Birnbaum MJ. Biguanides suppress hepatic glucagon signalling by decreasing production of cyclic AMP. Nature. 2013;494:256–260. doi: 10.1038/nature11808. [DOI] [PMC free article] [PubMed] [Google Scholar]
- Moller DE. New drug targets for type 2 diabetes and the metabolic syndrome. Nature. 2001;414:821–827. doi: 10.1038/414821a. [DOI] [PubMed] [Google Scholar]
- Oakhill JS, Steel R, Chen ZP, Scott JW, Ling N, Tam S, et al. AMPK is a direct adenylate charge-regulated protein kinase. Science. 2011;332:1433–1435. doi: 10.1126/science.1200094. [DOI] [PubMed] [Google Scholar]
- Panossian A, Wagner H. Stimulating effect of adaptogens: an overview with particular reference to their efficacy following single dose administration. Phytother Res. 2005;19:819–838. doi: 10.1002/ptr.1751. [DOI] [PubMed] [Google Scholar]
- Panossian A, Wikman G, Sarris J. Rosenroot (Rhodiola rosea): traditional use, chemical composition, pharmacology and clinical efficacy. Phytomedicine. 2010;17:481–493. doi: 10.1016/j.phymed.2010.02.002. [DOI] [PubMed] [Google Scholar]
- Pawson AJ, Sharman JL, Benson HE, Faccenda E, Alexander SP, Buneman OP, et al. NC-IUPHAR. The IUPHAR/BPS Guide to PHARMACOLOGY: an expert-driven knowledgebase of drug targets and their ligands. Nucleic Acids Res. 2014;42(Database Issue):D1098–D1106. doi: 10.1093/nar/gkt1143. [DOI] [PMC free article] [PubMed] [Google Scholar]
- Qiu BY, Turner N, Li YY, Gu M, Huang MW, Wu F, et al. High-throughput assay for modulators of mitochondrial membrane potential identifies a novel compound with beneficial effects on db/db mice. Diabetes. 2010;59:256–265. doi: 10.2337/db09-0223. [DOI] [PMC free article] [PubMed] [Google Scholar]
- Qu ZQ, Zhou Y, Zeng YS, Lin YK, Li Y, Zhong ZQ, et al. Protective effects of a Rhodiola crenulata extract and salidroside on hippocampal neurogenesis against streptozotocin-induced neural injury in the rat. PLoS ONE. 2012;7:e29641. doi: 10.1371/journal.pone.0029641. [DOI] [PMC free article] [PubMed] [Google Scholar]
- Sakai M, Matsumoto M, Tujimura T, Yongheng C, Noguchi T, Inagaki K, et al. CITED2 links hormonal signaling to PGC-1alpha acetylation in the regulation of gluconeogenesis. Nat Med. 2012;18:612–617. doi: 10.1038/nm.2691. [DOI] [PubMed] [Google Scholar]
- Semenkovich CF. Insulin resistance and atherosclerosis. J Clin Invest. 2006;116:1813–1822. doi: 10.1172/JCI29024. [DOI] [PMC free article] [PubMed] [Google Scholar]
- Shiota A, Shimabukuro M, Fukuda D, Soeki T, Sato H, Uematsu E, et al. Telmisartan ameliorates insulin sensitivity by activating the AMPK/SIRT1 pathway in skeletal muscle of obese db/db mice. Cardiovasc Diabetol. 2012;11:139. doi: 10.1186/1475-2840-11-139. [DOI] [PMC free article] [PubMed] [Google Scholar]
- Srinivasan S, Ohsugi M, Liu Z, Fatrai S, Bernal-Mizrachi E, Permutt MA. Endoplasmic reticulum stress-induced apoptosis is partly mediated by reduced insulin signaling through phosphatidylinositol 3-kinase/Akt and increased glycogen synthase kinase-3beta in mouse insulinoma cells. Diabetes. 2005;54:968–975. doi: 10.2337/diabetes.54.4.968. [DOI] [PubMed] [Google Scholar]
- Suzuki T, Bridges D, Nakada D, Skiniotis G, Morrison SJ, Lin JD, et al. Inhibition of AMPK catabolic action by GSK3. Mol Cell. 2013;50:407–419. doi: 10.1016/j.molcel.2013.03.022. [DOI] [PMC free article] [PubMed] [Google Scholar]
- Tang Y, Vater C, Jacobi A, Liebers C, Zou X, Stiehler M. Salidroside exerts angiogenic and cytoprotective effects on human bone marrow-derived endothelial progenitor cells via Akt/mTOR/p70S6K and MAPK signalling pathways. Br J Pharmacol. 2014;171:2440–2456. doi: 10.1111/bph.12611. [DOI] [PMC free article] [PubMed] [Google Scholar]
- Towler MC, Hardie DG. AMP-activated protein kinase in metabolic control and insulin signaling. Circ Res. 2007;100:328–341. doi: 10.1161/01.RES.0000256090.42690.05. [DOI] [PubMed] [Google Scholar]
- Trajkovski M, Hausser J, Soutschek J, Bhat B, Akin A, Zavolan M, et al. MicroRNAs 103 and 107 regulate insulin sensitivity. Nature. 2011;474:649–653. doi: 10.1038/nature10112. [DOI] [PubMed] [Google Scholar]
- Tzatsos A, Kandror KV. Nutrients suppress phosphatidylinositol 3-kinase/Akt signaling via raptor-dependent mTOR-mediated insulin receptor substrate 1 phosphorylation. Mol Cell Biol. 2006;26:63–76. doi: 10.1128/MCB.26.1.63-76.2006. [DOI] [PMC free article] [PubMed] [Google Scholar]
- Xing S, Yang X, Li W, Bian F, Wu D, Chi J, et al. Salidroside stimulates mitochondrial biogenesis and protects against H2O2-induced endothelial dysfunction. Oxid Med Cell Longev. 2014;2014:904834. doi: 10.1155/2014/904834. [DOI] [PMC free article] [PubMed] [Google Scholar]
- Zang M, Zuccollo A, Hou X, Nagata D, Walsh K, Herscovitz H, et al. AMP-activated protein kinase is required for the lipid-lowering effect of metformin in insulin-resistant human HepG2 cells. J Biol Chem. 2004;279:47898–47905. doi: 10.1074/jbc.M408149200. [DOI] [PubMed] [Google Scholar]
- Zhang Z, Feng S, Hu G, Cao Z, Wang L. Effect of Rhodiola kirilowii (Regel.) Maxim on preventing high altitude reactions. A comparison of cardiopulmonary function in villagers at various altitudes. Zhongguo Zhong Yao Za Zhi. 1989;14:687. [PubMed] [Google Scholar]
- Zheng T, Shu G, Yang Z, Mo S, Zhao Y, Mei Z. Antidiabetic effect of total saponins from Entada phaseoloides (L.) Merr. in type 2 diabetic rats. J Ethnopharmacol. 2012;139:814–821. doi: 10.1016/j.jep.2011.12.025. [DOI] [PubMed] [Google Scholar]
- Zhong H, Xin H, Wu LX, Zhu YZ. Salidroside attenuates apoptosis in ischemic cardiomyocytes: a mechanism through a mitochondria-dependent pathway. J Pharmacol Sci. 2010;114:399–408. doi: 10.1254/jphs.10078fp. [DOI] [PubMed] [Google Scholar]
- Zhu Y, Shi YP, Wu D, Ji YJ, Wang X, Chen HL, et al. Salidroside protects against hydrogen peroxide-induced injury in cardiac H9c2 cells via PI3K-Akt dependent pathway. DNA Cell Biol. 2011;30:809–819. doi: 10.1089/dna.2010.1183. [DOI] [PubMed] [Google Scholar]
Associated Data
This section collects any data citations, data availability statements, or supplementary materials included in this article.
Supplementary Materials
Figure S1 Effects of salidroside (SAL) on C57BLKS (WT) mice. Vehicle or SAL were administered orally to 7-week-old male WT mice for 13 weeks, and postprandial blood glucose (A), body weight (B), intraperitoneal glucose tolerance test (IPGTT) (C) and intraperitoneal insulin tolerance test (IPITT) (D) and area under curve (AUC) were determined. **P < 0.01 versus WT mice treated with vehicle. Values are means ± SEM (A–D, n = 7). White circles ○ = WT + vehicle; black circles • = WT + SAL (100 mg·kg−1).
Figure S2 (A) SAL enhances the effects of insulin on suppressing glucose production. ††P < 0.01 versus control; *P < 0.05, **P < 0.01 versus dexamethasone/cAMP (Dex/cAMP) alone. (B) HepG2 were incubated in the serum-free medium overnight and treated with SAL (0.1, 1, 10 μM) for 12 h and then cellular AMP/ATP levels were measured. **P < 0.01 versus control. (C) Experiment schematic diagram of oxygen consumption in isolated mitochondria. Values are means ± SEM (A, B, n = 4).
Table S1 qPCR primer sequences.