

Abstract
The sigma-1 receptor (S1R) is a 223-amino-acid membrane protein that resides in the endoplasmic reticulum and the plasma membrane of some mammalian cells. The S1R is regulated by various synthetic molecules including (+)-pentazocine, cocaine and haloperidol and endogenous molecules such as sphingosine, dimethyltryptamine and dehydroepiandrosterone. Ligand-regulated protein chaperone functions linked to oxidative stress and neurodegenerative disorders such as amyotrophic lateral sclerosis (ALS) and neuropathic pain have been attributed to the S1R. Several client proteins that interact with S1R have been identified including various types of ion channels and G-protein coupled receptors (GPCRs). When S1R constructs containing C-terminal monomeric GFP2 and YFP fusions were co-expressed in COS-7 cells and subjected to FRET spectrometry analysis, monomers, dimers and higher oligomeric forms of S1R were identified under non-liganded conditions. In the presence of the prototypic S1R agonist, (+)-pentazocine, however, monomers and dimers were the prevailing forms of S1R. The prototypic antagonist, haloperidol, on the other hand, favoured higher order S1R oligomers. These data, in sum, indicate that heterologously expressed S1Rs occur in vivo in COS-7 cells in multiple oligomeric forms and that S1R ligands alter these oligomeric structures. We suggest that the S1R oligomerization states may regulate its function(s).
Keywords: chaperone, FRET spectrometry, ligand effect, sigma-1 receptor (S1R), stoichiometry
INTRODUCTION
The membrane bound mammalian sigma-1 receptor (S1R) [1–5] is ubiquitously located in most mammalian tissues [6,7]. S1R is primarily found in the endoplasmic reticulum [8,9] and in some cellular plasma membranes [10]. It functions as a molecular chaperone and serves as a partner for a variety of interacting proteins including the IP3 (inositol trisphosphate) type 3 receptor [11], the chaperone GRP78/BIP [12], G-protein coupled receptors (GPCRs) [12–15] and voltage-gated ion channels [10,16–19]. S1R suppresses the production of reactive oxygen species (ROS) in the retina [20], lung and liver and in cultured mammalian cells [21].
Many synthetic molecules bind with high affinity to S1R [5,22,23] including the (+)-isomers of benzomorphan derivatives such as (+)-pentazocine and dextromethorphan and neuroleptics such as haloperidol and fluphenazine. Endogenous molecules such as N,N-dimethyltryptamine [24], sphingosine and sphingosine derivatives [25] and steroids such as progesterone [26] and dehydroepiandrosterone [27] have also been identified as regulators of S1R.
Since the S1R has been identified in specialized post-synaptic cisternae in cholinergic synapses of spinal cord ventral horn motoneuron C-terminals [28,29] and in spinal cord dorsal root ganglia [30], the receptor may be a useful therapeutic target for the treatment of amyotrophic lateral sclerosis (ALS) and neurogenic pain [31,32]. Based on the results from hydrophobicity analyses, the use of S1R–GFP constructs [10] and S1R antibody probes [11], it has been concluded that the S1R contains two putative transmembrane (TM) helices with both the N- and the C-termini located on the intracellular side of membranes. The ligand-binding region of the S1R, identified by the use of specific radioiodinated photoprobes [33–36] and by mutagenesis [4,8], involves in some manner juxtaposition of a C-terminal hydrophobic region (residues 176–194) with a portion of TM2 (residues 91–109) and perhaps a portion of TM1. Further work involving site-directed mutagenesis guided by computer simulations suggested that residues Arg119, Asp126, Ile128, Glu172 and Tyr173 play essential roles in ligand binding [37].
In vitro oligomeric forms of the maltose-binding protein (MBP)–S1R fusion protein (MBP–S1R) (tetramer/hexamer/octamer) and the pure S1R have been reported [38] that depend, in large part, on a helix–helix dimerization GXXXG sequence (46–48) in putative TM2. High-molecular-mass forms (tetramer, pentamer) of the S1R were previously identified using radioiodinated photoaffinity labelling in rat liver microsomal membrane preparations [36]. Therefore, the emerging hypothesis is that S1R oligomerization states may be important for regulating S1R functions. In vitro, only the oligomeric forms of the S1R (tetramer/hexamer/octamer) bind [3H]–(+)-pentazocine specifically, whereas the S1R monomer does not bind [3H]–(+)-pentazocine [38]. Furthermore, S1R agonists and antagonists stabilize the oligomeric states of the receptor. These in vitro data are consistent with the idea that the ligand regulated function(s) of the S1R depend on the oligomeric states of the receptor. Currently, however, the details of S1R oligomerization in vivo remain poorly understood.
FRET, a process through which energy is transferred non-radiatively from an optically excited donor (D) fluorophore to a non-excited acceptor (A) fluorophore [39,40], has been used widely to probe heteromerization of more than two proteins [41], determine the average size of the homo-oligomers from average FRET efficiency values of populations of interacting molecules [42–44] and estimate the average fraction of associated compared with unassociated monomers in a population of homooligomerizing proteins in living cells [42,45].
Previous publications have demonstrated the feasibility of spectrally resolved fluorescence microscopy [46,47] and its use in quantitative FRET imaging [42,48–54]. In spectral FRET imaging, the fluorescence intensity of the sample co-expressing A– and D–tagged proteins of interest is measured for each image pixel over the whole range of the visible spectrum. By using a least-squares minimization procedure and the known spectral signature of the donor and acceptor tags, it is possible to precisely separate emission of donors from that of acceptors and therefore to compute an apparent FRET efficiency, Eapp, for each pixel in a FRET image. In this way, quantitative FRET measurements are made in a single sample scan and without recourse to acceptor photobleaching or sequential excitation of the sample at two different wavelengths which are used in standard FRET methods.
Based on spectral imaging technology, a method has been developed for the determination of stoichiometry and geometry of protein complexes in living cells. The knowledge of individual Eapp values for each image pixel allows one to generate distributions of FRET efficiencies or Eapp histograms by plotting the number of image pixels falling in a certain interval of Eapp values against the centre of the Eapp interval [49,50,55]. Such distributions are obviously more rich in information than the average FRET efficiencies of entire cells or cellular regions of interest [56], which is why this method has been used to probe the quaternary structure of protein complexes from the number of peaks in the Eapp histograms and their mutual relationships [49,50,55]. The histogram peaks collectively constitute a unique fingerprint of a specific oligomeric (or quaternary) structure [57], under the form of a ‘FRET spectrum’ of the complex; therefore this method has been dubbed FRET spectrometry [55].
In a different embodiment of the FRET spectrometry method an Eapp meta-histogram is constructed by collecting the positions of dominant peaks in the original (i.e. cell-level) histograms. In this way, the blur introduced in the histogram by the point spread function of optical microscopes is reduced at the expense of performing a large number of measurements. This approach has been used to determine the quaternary structure of an ATP-binding cassette (ABC) transporter involved in translocation of polysaccharides in bacteria [48]. Although in this context the method has been used to deal primarily with single-peaked histograms, we have recently realized that it can also be used to extract information regarding dimers from mixtures of monomers, dimers and higher order oligomers at high expression levels of proteins (i.e. those corresponding to more than a few molecules per pixel).
Since the expression levels of S1R appear to be rather high in our biological system (see below), in the present study we combine the meta-histogram approach with a method of analysis introduced herein, based on distributions of average FRET efficiencies across a statistical set of cells, to determine the different oligomeric states of S1R in living cells in the presence and absence of its agonist and antagonist. We report identification of variously regulated haloperidol and (+)-pentazocine S1R higher oligomer, dimer and monomer receptor populations when expressed in living COS-7 cells as GFP2/YFP pairs using FRET spectrometry and the new method of analysis introduced in the present paper.
MATERIALS AND METHODS
Source and use of drugs
(+)-Pentazocine was obtained from Sigma–Aldrich and haloperidol hydrochloride was obtained from Tocris Biosciences. (+)-Pentazocine was titrated with HCl in aqueous solution to a stock concentration of 10 mM. The aqueous stock of haloperidol HCl was also 10 mM. Cells were incubated with final concentrations of 100 μM for both the compounds in OptiMEM for approximately 1 h prior to imaging.
Genetic constructs
The human S1R cDNA (NM_005866, Origene Technology) was PCR amplified using Pfx polymerase (Invitrogen) replacing the stop codon with an MluI restriction enzyme recognition sequence (ACGCGT) and fused to the GFP2 or YFP fluorophore’s cDNA where the start ATG of the fluorophore was deleted to assure no expression of the fluorophore alone. The constructs were both C-terminal S1R fluorophore fusions. The reporter fluorophores were as described earlier [48,50] and consisted of a modified GFP sequence containing the point mutations F 64L, A206K for GFP2 and S65G, S72A, T203Y for the YFP. The C-fusion S1R donor and acceptor constructs were subcloned into a pCI/neo (Promega) eukaryotic expression vector and expressed by transient transfection using Lipofectamine 2000 (Life Technologies).
Fluorescent tags
GFP2 [58], presenting a two-photon excitation maximum at ~800 nm, was used as a donor of energy. GFP2 has a large Stokes shift, which allows one to avoid acceptor direct excitation in a FRET experiment [in contrast with the more popular variant (enhanced) GFP]. YFP was used as an acceptor, as it has an excitation spectrum that overlaps perfectly with the GFP2 emission [59,60], thereby leading to a very strong coupling through FRET with the donor. In addition to these convenient features, the excitation maxima of the two fluorescent proteins match perfectly the range of wavelengths of the laser used in our experiments (see below). To prevent non-specific oligomerization caused by the slight propensity of GFP variants to dimerize, the A206K mutation [61] was included in our fluorescent protein sequences.
Expression of fluorescently tagged S1Rs in mammalian cells
The fusion proteins S1R–GFP2 and S1R–YFP were transiently expressed in COS-7 cells, singly or in combination, by transfection using Lipofectamine 2000 (Invitrogen), according to the manufacturer’s directions. Briefly, COS-7 cells were maintained in T25 flasks in 5 ml of Dulbecco’s Modified Eagle Medium (DMEM, Life Technologies) with 10% FBS, 2 mM L-glutamine, 100 units/ml penicillin and 100 μg/ml streptomycin (complete medium). Cells were seeded in 2 ml of complete medium in 35 mm culture dishes with coverglass bottoms (see below) at approximately 40% confluency and cultured for 24 h. Plasmid DNA and Lipofectamine were diluted separately in 250 μl (each) of Opti-MEM® medium (Life Technologies), combined and then added to cells. We used 2 μg of DNA for a single-plasmid transfection reaction and 1–3 μg of each plasmid (total 4 μg) in co-transfection reactions. Control reactions included single-plasmid transfections and mock transfections (i.e. no DNA). Cells were cultured for an additional 24 h following transfection. The culture/transfection medium was replaced with 2 ml of Opti-MEM® prior to imaging.
Two-photon fluorescence micro-spectroscopy
Fluorescence images of the COS-7 cells expressing the proteins of interest were acquired using a two-photon excitation micro-spectroscope consisting of a Nikon Eclipse Ti™ (Nikon Instruments Inc.) microscope, equipped with an OptiMiS TruLine™ scanning/detection head (Aurora Spectral Technologies), which provides 1.1 nm spectral resolution. OptiMiS TruLine employs a line-scan protocol that leads to signals higher by at least two orders of magnitude than those achievable with a point-scan-based system for the same line dwell time [62]. An ultrashort-pulse laser (MaiTai™, Spectra Physics) was used for fluorescence excitation, which generates femtosecond pulses with centre wavelengths tunable between 690 and 1040 nm and full-width at half maximum of ~7 nm. A non-descanned detection scheme was used, in which the emitted fluorescence was projected through a transmission grating on to a cooled electron-multiplying charge-coupled device (EMCCD) camera (Andor, iXon X3 897). In this manner, full spectral information was obtained from each sample voxel on a time scale much shorter than that which would correspond to molecular diffusion [50]. This critical feature provides molecular-level sensitivity in live cells [55], as it avoids mixing of signals from different molecular species moving within and without a voxel during image acquisition.
Emission spectra
For determination of emission spectra of donors and acceptors, 0.17 mm thick (clear) Delta T® Culture Dishes (Bioptechs) containing COS-7 cells at approximately 90% confluency, expressing either S1R–GFP2 or S1R–YFP were used. Spectral images of cells expressing S1R–GFP2 were obtained following excitation with 800-nm laser pulses with an average power of ~250 mW at the entrance of the microscope. Since the light is spread along a line longer that that corresponding to a 512-pixels image, the average power per pixel is much less than that used in point-scan microscopes [62], which causes less photo-damage to the sample.
Emission spectra obtained from several cells expressing GFP2–S1R and excited at 800 nm were averaged and normalized with respect to their maximum emission intensities to obtain the normalized (or elementary) spectrum of the GFP2 donor (D). To obtain the emission spectrum of YFP, COS-7 cells expressing S1R–YFP were excited with 960-nm laser light, which corresponds to the maximum of the YFP two-photon excitation spectrum. Similar to the donor spectra, YFP spectra from several cells were averaged out and the resulting spectrum was normalized with respect to its maximum emission intensity to obtain the elementary acceptor (A) spectrum.
FRET efficiency determination
COS-7 cells were transfected to co-express S1R–GFP2 and S1R–YFP to determine whether they self-associate to form oligomers. Spectral images obtained from cells co-expressing S1R–GFP2 and S1R–YFP proteins were unmixed to obtain separate donor (denoted by kDA) and acceptor (kAD) images, as described previously [42,50]. The Eapp distribution in a given optical section of an imaged cell was determined for each image pixel using kDA and kAD and the following equation [50]:
| (1) |
where wA and wD are the integrals of the measured elementary spectra of A and D respectively. QD and QA are the quantum yields of D and A respectively and their values (QD and QA obtained = 0.55 = 0.61) were from the literature [42]. All the computations were performed using a program written in house using the Matlab programming environment (The MathWorks). Pseudo-FRET efficiencies for pixels showing only background noise were avoided by rejecting all the signal to noise ratios not exceeding a value of 1 for both donor and acceptor signals in the Eapp calculations. Also, in the calculations of the number of donors per pixel (n), only those pixels were included which exceeded the above mentioned threshold for the donor signal to noise ratio.
RESULTS
Determination of FRET efficiency distributions
Cells co-expressing S1R–GFP2 and S1R–YFP in the presence and absence of ligand were imaged using two-photon fluorescence micro-spectroscopy. Fluorescence images acquired at 200 different wavelength intervals spanning the visible spectrum from 430 to 650 nm (i.e. spectral resolution of 1.1 nm) were unmixed [42] to obtain 2D spatial distribution maps of the fluorescence of donors in the presence of acceptors (kDA) and of acceptors in the presence of donors (kAD). The Eapp for each pixel was computed from the kDA and kAD maps as described in ‘Materials and Methods’.
Typical results for cells co-expressing S1R–GFP2 and S1R–YFP in the absence of ligand are shown in Figure 1. The number of image pixels that fell into a particular range of Eapp values was plotted against their corresponding Eapp value to obtain the distribution of FRET efficiencies in the cell or the Eapp histogram, which constitutes a FRET spectrogram (or spectrum; Figure 1).
Figure 1. Homo-oligomerization in living COS-7 cells of SRs in the absence of ligands.

Three representative cells are shown in which the receptors are tagged with fluorescent proteins, GFP2 and YFP as donors and acceptors of energy respectively. The 2D maps of the fluorescence of donors in the presence of acceptors (kDA) and of acceptors in the presence of donors (kAD) were used to compute Eapp for each pixel. The Eapp histograms for each cell were generated by binning the pixels of the Eapp map according to their intensity values.
The use of FRET spectrograms allows one to discriminate FRET caused by specific interactions between the proteins of interest from unwanted stochastic FRET that is caused by simple molecular agglomeration [56,63]. Even more importantly, they allow one to determine the stoichiometry and sometimes even the quaternary structure of a protein complex [50,55].
The majority of the cells expressing S1Rs showed relatively broad Eapp histograms, whereas some presented single narrow peaks. The dominant peak for each histogram (broad as well as narrow) was fitted to a Gaussian function in order to determine the position of the peak. These peak positions were collected and binned (in intervals of 0.025) according to their value to obtain meta-histograms representing the total number of peak positions obtained for each Eapp value. The Eapp meta-histograms obtained for the S1Rs, in the absence and presence of ligands, are shown in Figure 2.
Figure 2. Meta-histograms of the peak positions determined experimentally (open circles) and its simulation using correlated Gaussian functions shown individually (cyan, red, blue, dark-green, pink, green, dark-pink and dark-red thin lines) and as a sum (black thick line) predicted by a theoretical model consisting of dimers and monomers described below.
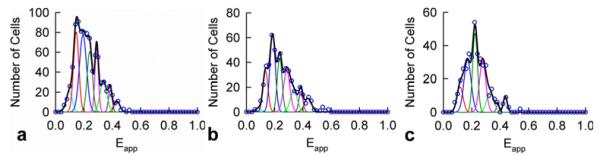
(a)Meta-histogram for 887 cells expressing S1Rs in the absence of ligand. The best-fit value for Ed is 0.433 and the most probable value of the number of donors per pixel (n) is 9.01. (b) Meta-histogram for 543 cells expressing S1Rs in the presence of haloperidol ligand (antagonist). The best-fit value for Ed and n are 0.435 and 8.69 respectively. (c) Meta-histogram for 390 cells expressing S1Rs in the presence of (+)-pentazocine (agonist). The best-fit values for Ed and n are 0.435 and 8.20 respectively. In all three panels, the Gaussian peaks correspond to the model shown in Figure 3 consisting of a mixture of FRET-productive (i.e. DA) dimers and non-FRET (i.e. DD) dimers and monomeric donors considered to be localized at the same image pixel (but beyond interaction distances).
Because the meta-histograms present several clearly visible peaks, we initially attempted to fit them to various models for single type of oligomers, including dimers, trimers, tetramers, hexamers etc., as described in recent publications [49,50,55]. Supplementary Figure S1 in Supplementary Data depicts one such model in which tetramers consisting of different combinations of donors and acceptors are characterized by five different predicted Eapp values. This model has been used with success in determining the quaternary structure of some GPCRs [55]. However, when applied to the analysis of the present S1R data, the results were mostly unsatisfactory, as the peaks in the experimental meta-histograms were distributed uniformly along the horizontal axis, whereas those predicted for the tetramer models were usually non-uniformly distributed (i.e. the Eapp differences between the positions of adjacent peaks were not constant). Similarly nonuniform distributions were also obtained for other large oligomers and with various geometries [55].
On the other hand, we were aware that computer simulations indicate that even populations of dimers, when mixed with monomeric donors, may also present several peaks in their histograms of FRET efficiencies [56]. Therefore, we next undertook the task of deriving analytical equations for a model consisting of mixtures of different oligomeric species. The most obvious mixture of oligomeric forms, which is also the simplest one, consisting of free monomers and dimers, produced the best results when applied to the interpretation of the experimental meta-histograms. This model and a detailed description of its practical use are described next.
Theoretical analysis of the meta-histograms in terms of mixtures of dimers and monomers
Our derivation starts from the definition of the Eapp, which represents the average FRET efficiency per donor or the sum of the FRET efficiencies of all the molecular complexes in a pixel divided by the number of donors at that pixel [55]. Since in our experiments we did not excite the acceptors directly by laser light, we can conveniently focus our analysis on monomeric donors (D) DD dimers and DA dimers, i.e. we consider no free monomeric acceptors (A) or AA dimers.
If the average number of donors per pixel is n and the number of FRET-productive (i.e. DA) dimers in a pixel is l, then the FRET efficiency at that pixel is given by the following equation:
| (2) |
with Ed being the pairwise FRET efficiency for the DA dimer and l an integer taking values between 1 and n. The total number of peaks is equal to the number of different combinations of donors and dimers (i.e. n).
An example for n = 9 is illustrated in Figure 3, giving nine different expressions for Eapp. The average value of n depends on the receptor expression level, whereas the number of pixels corresponding to each l value for a fixed value of n depends on the donor to acceptor ratio and the ratio of monomers to dimers. Therefore, the Eapp meta-histogram may be concisely expressed as:
| (3) |
where G[(l/n)Ed] is a Guassian function of amplitude Al and width σl, centred at (l/n)Ed.
Figure 3. Geometrical configurations and the corresponding mathematical expressions for Eapp of mixtures of dimers and donors, for the case where each pixel contains on average nine donors.

For larger numbers of donors, the number of predicted peaks increases proportionally. Free acceptors as well as dimers containing only acceptors were ignored as they are not excited directly by light and do not contribute to the measured signal.
To be precise, for in-homogeneous distributions of protein complexes within the cells, the experimental meta-histogram obtained from an extremely large number of cells should consist of a set of peaks described in eqn. (3), each corresponding to a narrow range of n values. Since, in practice, the number of cells cannot be infinitely large, the bin size for the experimental histogram cannot be set to arbitrarily low values and therefore most peaks corresponding to large n values will appear as blurred, leaving only those corresponding to relatively small n values as distinguishable features in the histogram.
The clearly distinct peaks in the meta-histograms shown in Figure 2 were simulated using eight Gaussian functions, with the location on the horizontal axis of their maxima predicted by the model depicted in Figure 3. The fitting of the simulated curves to the experimental ones was done by adjusting the following parameters: Al, σl, l, n and Ed. The process consisted of minimizing the mismatch between experimental and simulated data, as quantified by the following residual:
| (4) |
where ‘Experimental’ stands for the experimentally observed number of occurrences of a certain average Eapp value (plotted on the vertical axis in the histograms), ‘Simulated’ stands for the simulated values and ‘i’ is a summation index corresponding to individual data points.
As seen from Figure 2, the fit was excellent both for untreated and ligand-treated cells. An interesting feature of the model shown in Figure 3 is that, when monomeric donors are absent, all the peaks corresponding to the even values of l would be absent from the meta-histogram. The fact that all the peaks were present in our meta-histograms (Figure 2) therefore suggests that monomers of S1R are present along with dimers.
Probing for higher order oligomers
For mixtures of monomers, dimers and higher order oligomers at high expression levels, the meta-histogram approach helps extract information on dimers and free monomers from within the crowded set of peaks that higher order oligomer histograms present [55]. We will attempt here to explain how this process may occur. Because higher order oligomers are characterized by several combinations of donors and acceptors, the number of peaks in their cellular histograms is larger (compare five peaks for the rhombus tetramer shown in the Supplementary Data to a single peak for pure DA dimers). This leads to the following two effects: (1) For equal concentrations of dimers and high order oligomers, the amplitudes of the peaks in the cellular histograms corresponding to the larger oligomers are comparatively smaller (roughly by a factor of five, in the case of the rhombus tetramer), as the frequency of occurrence of each combination of donor and acceptor is smaller than that of a DA dimer. This could cause the shorter peaks to be systematically missed when counting the dominant peaks in each cellular histogram during generation of the meta-histograms. (2) When mixed with various combinations of DD dimers and D monomers, the large number of peaks corresponding to the higher order oligomers in the cellular histograms would degenerate into a much larger number of peaks, possibly leading to unresolvable crowding in the cellular histogram. Therefore, if the system is characterized by a combination of dimers and higher order oligomers, the meta-histogram will consist of a broad background corresponding to mixtures of high order oligomers ‘decorated’ by a set of more clearly visible peaks corresponding to simpler combinations of DA and DD dimers originating from regions of the cells with relatively low expression levels and hence low n values (see above). In light of the above observations, we performed detailed analysis on the Eapp histograms of individual cells to determine whether there are additional peaks occurring at values higher than Ed. Visual inspection of the individual histograms, such as the second and third histograms in Figure 1, indicated that indeed the histograms of some of the cells presented significant features beyond Ed, consistent with what would be seen if a significant contingent of higher order oligomers were also present [50].
To further test this hypothesis, we determined averages of Eapp for entire cells and plotted them against average numbers of donor-tagged receptors in the cells (ND). The value of ND for each cell was estimated from the fluorescence emission of donors corrected for FRET divided by 120, which was found previously to be the fluorescence emission per one donor molecule using our set-up [49]. This new method relies on the asymptotic behaviour of the distributions of cellular averages of Eapp at very high and very low donor concentrations respectively, to extract information on the smallest and largest oligomeric structure in the system. In this regard, it expands upon some earlier approaches (based on the dependence of average Eapp on donor–acceptor expression ratio [42,64,65]) by: (1) using the previously introduced theory of FRET in multimeric complexes [66], and (2) relying on distributions of cellular Eapp values rather than averages over many cells. The results of such computations performed for all the cells investigated in this work are presented in Figure 4, which reveals some interesting features.
Figure 4. Average Eapp, vs. average donor concentration for each cell for (a) Sigma1 receptors alone, or (b) in the presence of haloperidol or (c) (+)-pentazocine, respectively.
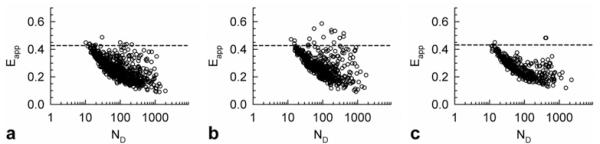
The dashed line, provided as a reference, corresponds to the pairwise FRET efficiency of a Sigma1 receptor dimer (or Ed), extracted as a fitting parameter, from the data fitting into the model (Figure 2).
The most striking of these features was that, at low ND values, Eapp values approach but do not exceed Ed, which corresponds to dimers and is represented by the dashed horizontal lines in Figure 4. This was true for all samples investigated and suggests that dimers are the largest structure of the S1R receptor formed at low expression levels. If higher order oligomers were present at those expression levels, the average value of Eapp for at least some of the cells would have significantly exceeded Ed (see Supplementary Data) [49].
By contrast, for much higher ND concentrations, the cells showed a relatively broad distribution of Eapp at any given ND value, which would be possible only if higher order oligomers were present in addition to dimers and monomers. This is because the FRET efficiency corresponding to large oligomers containing more acceptors than donors is expected to be significantly higher than Ed (corresponding to a dimer). For instance, for a rhombus tetramer (see Supplementary Figure S1 in Supplementary Data) consisting of three acceptors and one donor it is 3Ep/(1 + 2Ep), whereas for three donors and one acceptor it is equal to Ep, where the pairwise FRET efficiency Ep is approximately equal to Ed (assuming that no conformational changes occur when the dimers associate into tetramers). As a result and because the acceptor concentration may randomly take values over a broad interval, for a fixed donor concentration Eapp values range from below Ed to larger than Ed. This effect appeared to be stronger for haloperidol-treated cells than for untreated cells, where more cells reached and even exceeded Ed, which was roughly equal to 0.45 for that type of sample. By contrast, for all (+)-pentazocine-treated cells, the cellular average of Eapp remained well below Ed even at high donor concentrations; this observation is consistent with a dimer-dominated distribution.
In summary, these results indicate that: (i) untreated cells could harbour the S1R in monomeric, dimeric and even higher order oligomeric forms, (ii) haloperidol tends to stabilize them in a higher oligomeric state, (iii) whereas (+)-pentazocine has the opposite effect of stabilizing lower order oligomers (i.e. the dimers).
DISCUSSION
Possible effects of untagged S1R
Based on selective S1R covalent photoaffinity labelling experiments, COS-7 cells do not express S1Rs in high concentrations [24]. However, the presence of such endogenous receptors may not be completely dismissed. The same appearance of reduced oligomeric size could also be created by photobleaching of donors by the excitation light, though in our measurement system photobleaching is reduced dramatically compared with a system with point-scan excitation [62]. It is therefore interesting to speculate that, should such ‘dark’ receptors be present, at low expression levels of exogenous (i.e. tagged receptors), FRET would underestimate the size of the S1R oligomers. For instance, a dimer consisting of a dark endogenous protomer and a donor-tagged protomer would behave as if it were a monomeric donor; likewise, a tetramer consisting of two dark protomers, one acceptor-tagged and one donor-tagged protomer would show the same FRET signature as a DA dimer. For this situation to occur frequently enough, large amounts of endogenous S1R and/or high levels of photobleached tags would have to be present, which are both unlikely.
The case against the possibility that monomeric S1Rs may have an artefactual origin is strengthened by the observation made above that haloperidol seems to shift the equilibrium of S1Rs from dimers/monomers to a higher oligomeric state, which would not be possible if dark forms of the receptors were present, as haloperidol could not turn them into bright forms (i.e. fluorescently tagged). Therefore, our results are consistent with the concept that monomeric S1R is a species in its own right, which may self-associate to form dimers and higher order oligomers at high concentrations and/or in the presence of ligands or other molecular species that may be present in a biological cell.
Comparison to the literature
We provide in vivo evidence, using newly developed spectral FRET approaches [50,55] for monomer, dimer and higher oligomeric forms of the S1R when expressed in COS-7 cells. The S1R antagonist, haloperidol, favoured the distribution and/or stabilization of higher oligomeric forms of the S1R whereas the S1R agonist, (+)-pentazocine, favoured dimer forms (Figures 2 and 3). Several reports demonstrating native S1R oligomerization that may presage fundamental S1R regulatory mechanisms have been made. For example, in vitro analyses of highly purified MBP S1R fusion protein (MBP–4Ala–S1R) in dodecylmaltoside (DDM) showed oligomeric forms, including tetramers and hexamers/octamers that specifically bound [3H]-(+)-pentazocine [38]. The oligomeric forms were stabilized by both S1R agonists and antagonists. The monomeric form of the S1R did not bind [3H]-(+)-pentazocine [38]. High affinity radioiodinated S1R photoaffinity probes identified oligomeric forms of S1R in rat liver membranes [36]. The GXXXG sequence that occurs in putative TM2 of S1R is an important motif that, in part, determines the ability of the MBP–4Ala–S1R to oligomerize [38]. Additional residues of the S1R have also been implicated in S1R dimerization/oligomerization [32].
S1R ligands may regulate the activity of the receptor interaction with client proteins by altering the oligomeric/monomeric receptor ratio and favouring the oligomeric states. For example, AFM has demonstrated that S1R monomers bind with 4-fold stoichiometry to the voltage-gated sodium channel Nav1.5 [67]. Additionally, a 1:1 stoichiometry of S1R binding of the S1R monomer to the NMDA receptor subunit GluN1 has been reported [68]. As assessed by AFM, interaction of the S1R monomer with the Nav 1.5 sodium channel was reduced by pre-treatment of the S1R–Nav 1.5 ion channel complex with both haloperidol and (+)- pentazocine. One possible explanation for this observation is that S1R ligands stabilize associated (i.e. dimer and higher oligomeric) forms of the receptor thus reducing the concentration of monomers available for interaction with ion channels, NMDA receptors, GPCRs and other client proteins. Dissociation of the oligomeric states of the receptor to yield the monomeric form of the S1R may thus expose the C-terminus of the receptor for client protein interactions including its chaperone functions, as previously reported [69]. NMR-derived structures of the C-terminus have been reported recently [70]. The effects of an agonist (PRE084) and an antagonist (haloperidol) on the FRET signal from S1R containing CFP and YFP FRET pairs on the N- and C-terminals have recently been evaluated in vivo [71] and interpreted in terms of intramolecular conformational changes. However, it has been reported that S1R forms oligomers [32,36,38] which can also result in intermolecular FRET signals from the N- and C-termini of adjacent S1Rs that are assembled into oligomers. A final resolution of the complexity of agonist and antagonist regulation of the activity of S1R at the atomic level has yet to be discovered and may be due to subtle conformational changes that result in variable stabilization of the oligomeric forms.
The S1R interacts with many synthetic and natural ligands [5,72]. Photoaffinity labelling has identified a region of the S1R that juxtaposes a steroid-like binding domain (SBDLI) in TM2 (including the oligomerization GXXXG sequence) and a C-terminal SBDLII hydrophobic sequence [33–36]. The S1R ligand-binding site appears to be shared between monomers since the stoichiometry of binding of the antagonist BD1047 to the in vitro highly purified MBP–4Ala–S1R in the tetrameric form was found to be one BD1047 bound/dimer in the tetramer [38]. A stoichiometry of one ligand bound to one dimer was also proposed from the work of Chu et al. [73] who showed that a C-12 alkyl-containing photoprobe selectively and quantitatively derivatized His145 at a proposed S1R dimer interface. Further, a specific [3H]-ditolylguanidine ([3H]-DTG)-competent-binding dimerized form of the S1R was obtained by intermolecular disulfide bond formation of a N170C mutant upon expression in COS cells. Interestingly, several computational modelling studies of the binding of (+)-pentazocine and other S1R ligands to the S1R [37,74,75] indicate ligand binding to the monomeric form of the S1R receptor. Such findings, if confirmed, would predict a 1:1 binding stoichiometry of ligand to monomer, which would need to be carefully examined when interpreting oligomerization effects described in the present study and in other studies.
In summary, the application of the spectrally resolved FRET approach showed that S1R exists in vivo as a dynamic molecule capable of multiple homomeric interactions that are likely to regulate its multi-tasking function(s). Final resolution of the precise manner by which S1R agonists and antagonists interact with the S1R is also likely to require additional supporting structural biology approaches using solution NMR and/or X-ray diffraction.
Supplementary Material
Acknowledgments
FUNDING
This work was supported by the National Science Foundation [grant numbers PHY-1058470, IIP-1114305 and PHY-1126386] to V.R.
Abbreviations
- COS-7
CV-1 origin with SV40 genes
- Eapp
apparent FRET efficiency
- GPCR
G-protein coupled receptor
- MBP
maltose-binding protein
- ND
average numbers of donor-tagged receptors in the cells
- S1R
sigma-1 receptor
- SBDL
steroid-like binding domain
- TM
transmembrane
Footnotes
Conflict of Interest: Valerică Raicu is co-founder of Aurora Spectral Technologies LLC, which manufactured the OptiMiS TruLine™ scanning/detection head used in experiments described in the present paper.
AUTHOR CONTRIBUTION
AM, TM, DS, JY, and JO contributed to the study design, generated reagents and cell cultures, and performed measurements. GB and AM wrote computer routines for data analysis. VR developed theoretical models and analysis methods. AM, TM, GB and VR performed data analysis. VR and AR developed the study design and wrote the paper with input from all the authors.
REFERENCES
- 1.Hanner M, Moebius FF, Flandorfer A, Knaus HG, Striessnig J, Kempner E, Glossmann H. Purification, molecular cloning, and expression of the mammalian sigma1-binding site. Proc. Natl. Acad. Sci. U.S.A. 1996;93:8072–8077. doi: 10.1073/pnas.93.15.8072. CrossRef PubMed. [DOI] [PMC free article] [PubMed] [Google Scholar]
- 2.Jbilo O, Vidal H, Paul R, De Nys N, Bensaid M, Silve S, Carayon P, Davi D, Galiegue S, Bourrie B, et al. Purification and characterization of the human SR 31747A-binding protein. A nuclear membrane protein related to yeast sterol isomerase. J. Biol. Chem. 1997;272:27107–27115. doi: 10.1074/jbc.272.43.27107. CrossRef PubMed. [DOI] [PubMed] [Google Scholar]
- 3.Kekuda R, Prasad PD, Fei YJ, Leibach FH, Ganapathy V. Cloning and functional expression of the human type 1 sigma receptor (hSigmaR1) Biochem. Biophys. Res. Commun. 1996;229:553–558. doi: 10.1006/bbrc.1996.1842. CrossRef PubMed. [DOI] [PubMed] [Google Scholar]
- 4.Seth P, Ganapathy ME, Conway SJ, Bridges CD, Smith SB, Casellas P, Ganapathy V. Expression pattern of the type 1 sigma receptor in the brain and identity of critical anionic amino acid residues in the ligand-binding domain of the receptor. Biochim. Biophys. Acta. 2001;1540:59–67. doi: 10.1016/s0167-4889(01)00117-3. CrossRef PubMed. [DOI] [PubMed] [Google Scholar]
- 5.Su TP, Hayashi T, Maurice T, Buch S, Ruoho AE. The sigma-1 receptor chaperone as an inter-organelle signaling modulator. Trends Pharmacol. Sci. 2010;31:557–566. doi: 10.1016/j.tips.2010.08.007. CrossRef PubMed. [DOI] [PMC free article] [PubMed] [Google Scholar]
- 6.Langa F, Codony X, Tovar V, Lavado A, Gimenez E, Cozar P, Cantero M, Dordal A, Hernandez E, Perez R, et al. Generation and phenotypic analysis of sigma receptor type I (sigma 1) knockout mice. Eur. J. Neurosci. 2003;18:2188–2196. doi: 10.1046/j.1460-9568.2003.02950.x. CrossRef PubMed. [DOI] [PubMed] [Google Scholar]
- 7.Mei J, Pasternak GW. Molecular cloning and pharmacological characterization of the rat sigma1 receptor. Biochem. Pharmacol. 2001;62:349–355. doi: 10.1016/s0006-2952(01)00666-9. CrossRef PubMed. [DOI] [PubMed] [Google Scholar]
- 8.Ha Y, Dun Y, Thangaraju M, Duplantier J, Dong Z, Liu K, Ganapathy V, Smith SB. Sigma receptor 1 modulates endoplasmic reticulum stress in retinal neurons. Invest. Ophthalmol. Vis. Sci. 2011;52:527–540. doi: 10.1167/iovs.10-5731. CrossRef PubMed. [DOI] [PMC free article] [PubMed] [Google Scholar]
- 9.Hayashi T, Justinova Z, Hayashi E, Cormaci G, Mori T, Tsai SY, Barnes C, Goldberg SR, Su TP. Regulation of sigma-1 receptors and endoplasmic reticulum chaperones in the brain of methamphetamine self-administering rats. J. Pharmacol. Exp. Ther. 2010;332:1054–1063. doi: 10.1124/jpet.109.159244. CrossRef PubMed. [DOI] [PMC free article] [PubMed] [Google Scholar]
- 10.Aydar E, Palmer CP, Klyachko VA, Jackson MB. The sigma receptor as a ligand-regulated auxiliary potassium channel subunit. Neuron. 2002;34:399–410. doi: 10.1016/s0896-6273(02)00677-3. CrossRef PubMed. [DOI] [PubMed] [Google Scholar]
- 11.Hayashi T, Su TP. Regulating ankyrin dynamics: Roles of sigma-1 receptors. Proc. Natl. Acad. Sci. U.S.A. 2001;98:491–496. doi: 10.1073/pnas.98.2.491. CrossRef PubMed. [DOI] [PMC free article] [PubMed] [Google Scholar]
- 12.Hayashi T, Su TP. Sigma-1 receptor chaperones at the ER-mitochondrion interface regulate Ca(2+) signaling and cell survival. Cell. 2007;131:596–610. doi: 10.1016/j.cell.2007.08.036. CrossRef PubMed. [DOI] [PubMed] [Google Scholar]
- 13.Navarro G, Moreno E, Aymerich M, Marcellino D, McCormick PJ, Mallol J, Cortes A, Casado V, Canela EI, Ortiz J, et al. Direct involvement of sigma-1 receptors in the dopamine D1 receptor-mediated effects of cocaine. Proc. Natl. Acad. Sci. U.S.A. 2010;107:18676–18681. doi: 10.1073/pnas.1008911107. CrossRef PubMed. [DOI] [PMC free article] [PubMed] [Google Scholar]
- 14.Kim FJ, Kovalyshyn I, Burgman M, Neilan C, Chien CC, Pasternak GW. Sigma 1 receptor modulation of G-protein-coupled receptor signaling: potentiation of opioid transduction independent from receptor binding. Mol. Pharmacol. 2010;77:695–703. doi: 10.1124/mol.109.057083. CrossRef PubMed. [DOI] [PMC free article] [PubMed] [Google Scholar]
- 15.Villard V, Espallergues J, Keller E, Vamvakides A, Maurice T. Anti-amnesic and neuroprotective potentials of the mixed muscarinic receptor/sigma 1 (sigma1) ligand ANAVEX2–73, a novel aminotetrahydrofuran derivative. J. Psychopharmacol. 2011;25:1101–1117. doi: 10.1177/0269881110379286. CrossRef PubMed. [DOI] [PubMed] [Google Scholar]
- 16.Wilke RA, Mehta RP, Lupardus PJ, Chen Y, Ruoho AE, Jackson MB. Sigma receptor photolabeling and sigma receptor-mediated modulation of potassium channels in tumor cells. J. Biol. Chem. 1999;274:18387–18392. doi: 10.1074/jbc.274.26.18387. CrossRef PubMed. [DOI] [PubMed] [Google Scholar]
- 17.Johannessen M, Ramachandran S, Riemer L, Ramos-Serrano A, Ruoho AE, Jackson MB. Voltage-gated sodium channel modulation by sigma-receptors in cardiac myocytes and heterologous systems. Am. J. Physiol. Cell Physiol. 2009;296:C1049–C1057. doi: 10.1152/ajpcell.00431.2008. CrossRef PubMed. [DOI] [PMC free article] [PubMed] [Google Scholar]
- 18.Lupardus PJ, Wilke RA, Aydar E, Palmer CP, Chen Y, Ruoho AE, Jackson MB. Membrane-delimited coupling between sigma receptors and K + channels in rat neurohypophysial terminals requires neither G-protein nor ATP. J. Physiol. 2000;526(Pt 3):527–539. doi: 10.1111/j.1469-7793.2000.00527.x. CrossRef PubMed. [DOI] [PMC free article] [PubMed] [Google Scholar]
- 19.Carnally SM, Johannessen M, Henderson RM, Jackson MB, Edwardson JM. Demonstration of a direct interaction between sigma-1 receptors and acid-sensing ion channels. Biophys. J. 2010;98:1182–1191. doi: 10.1016/j.bpj.2009.12.4293. CrossRef PubMed. [DOI] [PMC free article] [PubMed] [Google Scholar]
- 20.Bucolo C, Drago F, Lin LR, Reddy VN. Sigma receptor ligands protect human retinal cells against oxidative stress. Neuroreport. 2006;17:287–291. doi: 10.1097/01.wnr.0000199469.21734.e1. CrossRef PubMed. [DOI] [PubMed] [Google Scholar]
- 21.Pal A, Fontanilla D, Gopalakrishnan A, Chae YK, Markley JL, Ruoho AE. The sigma-1 receptor protects against cellular oxidative stress and activates antioxidant response elements. Eur. J. Pharmacol. 2012;682:12–20. doi: 10.1016/j.ejphar.2012.01.030. CrossRef PubMed. [DOI] [PMC free article] [PubMed] [Google Scholar]
- 22.Ruoho AE, Chu UB, Ramachandran S, Fontanilla D, Mavlyutov T, Hajipour AR. The ligand binding region of the sigma-1 receptor: studies utilizing photoaffinity probes, sphingosine and N-alkylamines. Curr. Pharm. Des. 2012;18:920–929. doi: 10.2174/138161212799436584. CrossRef PubMed. [DOI] [PMC free article] [PubMed] [Google Scholar]
- 23.Berardi F, Abate C, Ferorelli S, Colabufo NA, Perrone R. 1-Cyclohexylpiperazine and 3,3-dimethylpiperidine derivatives as sigma-1 (sigma1) and sigma-2 (sigma2) receptor ligands: a review. Cent. Nerv. Sys. Agents Med. Chem. 2009;9:205–219. doi: 10.2174/1871524910909030205. CrossRef. [DOI] [PubMed] [Google Scholar]
- 24.Fontanilla D, Johannessen M, Hajipour AR, Cozzi NV, Jackson MB, Ruoho AE. The hallucinogen N,N-dimethyltryptamine (DMT) is an endogenous sigma-1 receptor regulator. Science. 2009;323:934–937. doi: 10.1126/science.1166127. CrossRef PubMed. [DOI] [PMC free article] [PubMed] [Google Scholar]
- 25.Ramachandran S, Chu UB, Mavlyutov TA, Pal A, Pyne S, Ruoho AE. The sigma1 receptor interacts with N-alkyl amines and endogenous sphingolipids. Eur. J. Pharmachol. 2009;609:19–26. doi: 10.1016/j.ejphar.2009.03.003. CrossRef. [DOI] [PMC free article] [PubMed] [Google Scholar]
- 26.Su TP, London ED, Jaffe JH. Steroid binding at sigma receptors suggests a link between endocrine, nervous, and immune systems. Science. 1988;240:219–221. doi: 10.1126/science.2832949. CrossRef PubMed. [DOI] [PubMed] [Google Scholar]
- 27.Moriguchi S, Yamamoto Y, Ikuno T, Fukunaga K. Sigma-1 receptor stimulation by dehydroepiandrosterone ameliorates cognitive impairment through activation of CaM kinase II, protein kinase C and extracellular signal-regulated kinase in olfactory bulbectomized mice. J. Neurochem. 2011;117:879–891. doi: 10.1111/j.1471-4159.2011.07256.x. CrossRef PubMed. [DOI] [PubMed] [Google Scholar]
- 28.Mavlyutov TA, Epstein ML, Andersen KA, Ziskind-Conhaim L, Ruoho AE. The sigma-1 receptor is enriched in postsynaptic sites of C-terminals in mouse motoneurons. An anatomical and behavioral study. Neuroscience. 2010;167:247–255. doi: 10.1016/j.neuroscience.2010.02.022. CrossRef PubMed. [DOI] [PMC free article] [PubMed] [Google Scholar]
- 29.Mavlyutov TA, Epstein ML, Liu P, Verbny YI, Ziskind-Conhaim L, Ruoho AE. Development of the sigma-1 receptor in C-terminals of motoneurons and colocalization with the N,N’-dimethyltryptamine forming enzyme, indole-N-methyl transferase. Neuroscience. 2012;206:60–68. doi: 10.1016/j.neuroscience.2011.12.040. CrossRef PubMed. [DOI] [PMC free article] [PubMed] [Google Scholar]
- 30.Gundlach AL, Largent BL, Snyder SH. Autoradiographic localization of sigma receptor binding sites in guinea pig and rat central nervous system with (+)3H-3-(3-hydroxyphenyl)-N-(1-propyl)piperidine. J. Neurosci. 1986;6:1757–1770. doi: 10.1523/JNEUROSCI.06-06-01757.1986. PubMed. [DOI] [PMC free article] [PubMed] [Google Scholar]
- 31.Al-Saif A, Al-Mohanna F, Bohlega S. A mutation in sigma-1 receptor causes juvenile amyotrophic lateral sclerosis. Ann. Neurol. 2011;70:913–919. doi: 10.1002/ana.22534. CrossRef PubMed. [DOI] [PubMed] [Google Scholar]
- 32.Kinoshita M, Matsuoka Y, Suzuki T, Mirrielees J, Yang J. Sigma-1 receptor alters the kinetics of Kv1.3 voltage gated potassium channels but not the sensitivity to receptor ligands. Brain Res. 2012;1452:1–9. doi: 10.1016/j.brainres.2012.02.070. CrossRef PubMed. [DOI] [PMC free article] [PubMed] [Google Scholar]
- 33.Pal A, Chu UB, Ramachandran S, Grawoig D, Guo LW, Hajipour AR, Ruoho AE. Juxtaposition of the steroid binding domain-like I and II regions constitutes a ligand binding site in the sigma-1 receptor. J. Biol. Chem. 2008;283:19646–19656. doi: 10.1074/jbc.M802192200. CrossRef PubMed. [DOI] [PMC free article] [PubMed] [Google Scholar]
- 34.Chen Y, Hajipour AR, Sievert MK, Arbabian M, Ruoho AE. Characterization of the cocaine binding site on the sigma-1 receptor. Biochemistry. 2007;46:3532–3542. doi: 10.1021/bi061727o. CrossRef PubMed. [DOI] [PubMed] [Google Scholar]
- 35.Fontanilla D, Hajipour AR, Pal A, Chu UB, Arbabian M, Ruoho AE. Probing the steroid binding domain-like I (SBDLI) of the sigma-1 receptor binding site using N-substituted photoaffinity labels. Biochemistry. 2008;47:7205–7217. doi: 10.1021/bi800564j. CrossRef PubMed. [DOI] [PMC free article] [PubMed] [Google Scholar]
- 36.Pal A, Hajipour AR, Fontanilla D, Ramachandran S, Chu UB, Mavlyutov T, Ruoho AE. Identification of regions of the sigma-1 receptor ligand binding site using a novel photoprobe. Mol. Pharmacol. 2007;72:921–933. doi: 10.1124/mol.107.038307. CrossRef PubMed. [DOI] [PubMed] [Google Scholar]
- 37.Brune S, Schepmann D, Klempnauer KH, Marson D, Dal Col V, Laurini E, Fermeglia M, Wunsch B, Pricl S. The sigma enigma: in vitro/in silico site-directed mutagenesis studies unveil sigma1 receptor ligand binding. Biochemistry. 2014;53:2993–3003. doi: 10.1021/bi401575g. CrossRef PubMed. [DOI] [PubMed] [Google Scholar]
- 38.Gromek KA, Suchy FP, Meddaugh HR, Wrobel RL, LaPointe LM, Chu UB, Primm JG, Ruoho AE, Senes A, Fox BG. The oligomeric states of the purified sigma-1 receptor are stabilized by ligands. J. Biol. Chem. 2014;289:20333–20344. doi: 10.1074/jbc.M113.537993. CrossRef PubMed. [DOI] [PMC free article] [PubMed] [Google Scholar]
- 39.Selvin PR. The renaissance of fluorescence resonance energy transfer. Nat. Struct. Biol. 2000;7:730–734. doi: 10.1038/78948. CrossRef PubMed. [DOI] [PubMed] [Google Scholar]
- 40.Lakowicz JR. Principles of Fluorescence Spectroscopy. Springer; New York: 2006. CrossRef. [Google Scholar]
- 41.Carriba P, Navarro G, Ciruela F, Ferre S, Casado V, Agnati L, Cortes A, Mallol J, Fuxe K, Canela EI, et al. Detection of heteromerization of more than two proteins by sequential BRET-FRET. Nat. Methods. 2008;5:727–733. doi: 10.1038/nmeth.1229. CrossRef PubMed. [DOI] [PubMed] [Google Scholar]
- 42.Raicu V, Jansma DB, Miller RJ, Friesen JD. Protein interaction quantified in vivo by spectrally resolved fluorescence resonance energy transfer. Biochem. J. 2005;385:265–277. doi: 10.1042/BJ20040226. CrossRef PubMed. [DOI] [PMC free article] [PubMed] [Google Scholar]
- 43.Pisterzi LF, Jansma DB, Georgiou J, Woodside MJ, Chou JT, Angers S, Raicu V, Wells JW. Oligomeric size of the M2 muscarinic receptor in live cells as determined by quantitative fluorescence resonance energy transfer (FRET) J. Biol. Chem. 2010;285:16723–16738. doi: 10.1074/jbc.M109.069443. CrossRef PubMed. [DOI] [PMC free article] [PubMed] [Google Scholar]
- 44.Maurel D, Comps-Agrar L, Brock C, Rives ML, Bourrier E, Ayoub MA, Bazin H, Tinel N, Durroux T, Prezeau L, et al. Cell–surface protein–protein interaction analysis with time-resolved FRET and snap-tag technologies: application to GPCR oligomerization. Nat. Methods. 2008;5:561–567. doi: 10.1038/nmeth.1213. CrossRef PubMed. [DOI] [PMC free article] [PubMed] [Google Scholar]
- 45.Chen L, Novicky L, Merzlyakov M, Hristov T, Hristova K. Measuring the energetics of membrane protein dimerization in mammalian membranes. J. Am. Chem. Soc. 2010;132:3628–3635. doi: 10.1021/ja910692u. CrossRef PubMed. [DOI] [PMC free article] [PubMed] [Google Scholar]
- 46.Haraguchi T, Shimi T, Koujin T, Hashiguchi N, Hiraoka Y. Spectral imaging fluorescence microscopy. Genes Cells. 2002;7:881–887. doi: 10.1046/j.1365-2443.2002.00575.x. CrossRef PubMed. [DOI] [PubMed] [Google Scholar]
- 47.Lansford R, Bearman G, Fraser SE. Resolution of multiple green fluorescent protein color variants and dyes using two-photon microscopy and imaging spectroscopy. J. Biomed. Opt. 2001;6:311–318. doi: 10.1117/1.1383780. CrossRef PubMed. [DOI] [PubMed] [Google Scholar]
- 48.Singh DR, Mohammad MM, Patowary S, Stoneman MR, Oliver JA, Movileanu L, Raicu V. Determination of the quaternary structure of a bacterial ATP-binding cassette (ABC) transporter in living cells. Integr. Biol. 2013;5:312–323. doi: 10.1039/c2ib20218b. CrossRef. [DOI] [PMC free article] [PubMed] [Google Scholar]
- 49.Patowary S, Alvarez-Curto E, Xu TR, Holz JD, Oliver JA, Milligan G, Raicu V. The muscarinic M3 acetylcholine receptor exists as two differently sized complexes at the plasma membrane. Biochem. J. 2013;452:303–312. doi: 10.1042/BJ20121902. CrossRef PubMed. [DOI] [PubMed] [Google Scholar]
- 50.Raicu V, Stoneman MR, Fung R, Melnichuk M, Jansma DB, Pisterzi LF, Rath S, Fox M, Wells JW, Saldin DK. Determination of supramolecular structure and spatial distribution of protein complexes in living cells. Nat. Photon. 2009;3:107–113. CrossRef. [Google Scholar]
- 51.Moss FJ, Imoukhuede PI, Scott K, Hu J, Jankowsky JL, Quick MW, Lester HA. GABA transporter function, oligomerization state, and anchoring: correlates with subcellularly resolved FRET. J. Gen. Physiol. 2009;134:489–521. doi: 10.1085/jgp.200910314. CrossRef PubMed. [DOI] [PMC free article] [PubMed] [Google Scholar]
- 52.Merzlyakov M, Chen L, Hristova K. Studies of receptor tyrosine kinase transmembrane domain interactions: the EmEx-FRET method. J. Membr. Biol. 2007;215:93–103. doi: 10.1007/s00232-007-9009-0. CrossRef PubMed. [DOI] [PMC free article] [PubMed] [Google Scholar]
- 53.Thaler C, Koushik SV, Blank PS, Vogel SS. Quantitative multiphoton spectral imaging and its use for measuring resonance energy transfer. Biophys. J. 2005;89:2736–2749. doi: 10.1529/biophysj.105.061853. CrossRef PubMed. [DOI] [PMC free article] [PubMed] [Google Scholar]
- 54.Neher RA, Neher E. Applying spectral fingerprinting to the analysis of FRET images. Microsc. Res. Tech. 2004;64:185–195. doi: 10.1002/jemt.20078. CrossRef PubMed. [DOI] [PubMed] [Google Scholar]
- 55.Raicu V, Singh DR. FRET Spectrometry: a new tool for the determination of protein quaternary structure in living cells. Biophys. J. 2013;105:1937–1945. doi: 10.1016/j.bpj.2013.09.015. CrossRef PubMed. [DOI] [PMC free article] [PubMed] [Google Scholar]
- 56.Singh DR, Raicu V. Comparison between whole distribution- and average-based approaches to the determination of fluorescence resonance energy transfer efficiency in ensembles of proteins in living cells. Biophys. J. 2010;98:2127–2135. doi: 10.1016/j.bpj.2010.01.048. CrossRef PubMed. [DOI] [PMC free article] [PubMed] [Google Scholar]
- 57.Raicu V, Diaspro A, editors. Nanoscopy and Multidimensional Optical Fluorescence Microscopy. CRC Press; Boca Raton: 2010. FRET-based determination of protein complex structure at nanometer length scale in living cells; pp. 13-1–13-18. [Google Scholar]
- 58.Zimmermann T, Rietdorf J, Girod A, Georget V, Pepperkok R. Spectral imaging and linear un-mixing enables improved FRET efficiency with a novel GFP2-YFP FRET pair. FEBS Lett. 2002;531:245–249. doi: 10.1016/s0014-5793(02)03508-1. CrossRef PubMed. [DOI] [PubMed] [Google Scholar]
- 59.Tsien RY. The green fluorescent protein. Annu. Rev. Biochem. 1998;67:509–544. doi: 10.1146/annurev.biochem.67.1.509. CrossRef PubMed. [DOI] [PubMed] [Google Scholar]
- 60.Lippincott-Schwartz J, Snapp E, Kenworthy A. Studying protein dynamics in living cells. Nat. Rev. Mol. Cell Biol. 2001;2:444–456. doi: 10.1038/35073068. CrossRef PubMed. [DOI] [PubMed] [Google Scholar]
- 61.Violin JD, Zhang J, Tsien RY, Newton AC. A genetically encoded fluorescent reporter reveals oscillatory phosphorylation by protein kinase C. J. Cell Biol. 2003;161:899–909. doi: 10.1083/jcb.200302125. CrossRef PubMed. [DOI] [PMC free article] [PubMed] [Google Scholar]
- 62.Biener G, Stoneman MR, Acbas G, Holz JD, Orlova M, Komarova L, Kuchin S, Raicu V. Development and experimental testing of an optical micro-spectroscopic technique incorporating true line-scan excitation. Int. J. Mol. Sci. 2014;15:261–276. doi: 10.3390/ijms15010261. CrossRef. [DOI] [PMC free article] [PubMed] [Google Scholar]
- 63.King C, Sarabipour S, Byrne P, Leahy DJ, Hristova K. The FRET signatures of noninteracting proteins in membranes: simulations and experiments. Biophys. J. 2014;106:1309–1317. doi: 10.1016/j.bpj.2014.01.039. CrossRef PubMed. [DOI] [PMC free article] [PubMed] [Google Scholar]
- 64.Li E, Hristova K. Imaging Forster resonance energy transfer measurements of transmembrane helix interactions in lipid bilayers on a solid support. Langmuir. 2004;20:9053–9060. doi: 10.1021/la048676l. CrossRef PubMed. [DOI] [PubMed] [Google Scholar]
- 65.You M, Li E, Wimley WC, Hristova K. Forster resonance energy transfer in liposomes: measurements of transmembrane helix dimerization in the native bilayer environment. Anal. Biochem. 2005;340:154–164. doi: 10.1016/j.ab.2005.01.035. CrossRef PubMed. [DOI] [PMC free article] [PubMed] [Google Scholar]
- 66.Raicu V. Efficiency of resonance energy transfer in homo-oligomeric complexes of proteins. J. Biol. Phys. 2007;33:109–127. doi: 10.1007/s10867-007-9046-z. CrossRef PubMed. [DOI] [PMC free article] [PubMed] [Google Scholar]
- 67.Balasuriya D, Stewart AP, Crottes D, Borgese F, Soriani O, Edwardson JM. The sigma-1 receptor binds to the Nav1.5 voltage-gated Na+ channel with 4-fold symmetry. J. Biol. Chem. 2012;287:37021–37029. doi: 10.1074/jbc.M112.382077. CrossRef PubMed. [DOI] [PMC free article] [PubMed] [Google Scholar]
- 68.Balasuriya D, Stewart AP, Edwardson JM. The sigma-1 receptor interacts directly with GluN1 but not GluN2A in the GluN1/GluN2A NMDA receptor. J. Neurosci. 2013;33:18219–18224. doi: 10.1523/JNEUROSCI.3360-13.2013. CrossRef PubMed. [DOI] [PMC free article] [PubMed] [Google Scholar]
- 69.Wu Z, Bowen WD. Role of sigma-1 receptor C-terminal segment in inositol 1,4,5-trisphosphate receptor activation: constitutive enhancement of calcium signaling in MCF-7 tumor cells. J. Biol. Chem. 2008;283:28198–28215. doi: 10.1074/jbc.M802099200. CrossRef PubMed. [DOI] [PMC free article] [PubMed] [Google Scholar]
- 70.Ortega-Roldan JL, Ossa F, Schnell JR. Characterization of the human sigma-1 receptor chaperone domain structure and binding immunoglobulin protein (BiP) interactions. J. Biol. Chem. 2013;288:21448–21457. doi: 10.1074/jbc.M113.450379. CrossRef PubMed. [DOI] [PMC free article] [PubMed] [Google Scholar]
- 71.Gomez-Soler M, Fernandez-Duenas V, Portillo-Salido E, Perez P, Zamanillo D, Vela JM, Burgueno J, Ciruela F. Predicting the antinociceptive efficacy of sigma(1) receptor ligands by a novel receptor fluorescence resonance energy transfer (FRET) based biosensor. J. Med. Chem. 2014;57:238–242. doi: 10.1021/jm401529t. CrossRef PubMed. [DOI] [PubMed] [Google Scholar]
- 72.Matsumoto RR, Nguyen L, Kaushal N, Robson MJ. Sigma (sigma) receptors as potential therapeutic targets to mitigate psychostimulant effects. Adv. Pharmacol. 2014;69:323–386. doi: 10.1016/B978-0-12-420118-7.00009-3. CrossRef PubMed. [DOI] [PubMed] [Google Scholar]
- 73.Chu UB, Ramachandran S, Hajipour AR, Ruoho AE. Photoaffinity labeling of the sigma-1 receptor with N-[3-(4-nitrophenyl)propyl]-N-dodecylamine: evidence of receptor dimers. Biochemistry. 2013;52:859–868. doi: 10.1021/bi301517u. CrossRef PubMed. [DOI] [PMC free article] [PubMed] [Google Scholar]
- 74.Laurini E, Col VD, Mamolo MG, Zampieri D, Posocco P, Fermeglia M, Vio L, Pricl S. Homology model and docking-based virtual screening for ligands of the sigma1 receptor. ACS Med. Chem. Lett. 2011;2:834–839. doi: 10.1021/ml2001505. CrossRef PubMed. [DOI] [PMC free article] [PubMed] [Google Scholar]
- 75.Laurini E, Marson D, Dal Col V, Fermeglia M, Mamolo MG, Zampieri D, Vio L, Pricl S. Another brick in the wall. Validation of the sigma1 receptor 3D model by computer-assisted design, synthesis, and activity of new sigma1 ligands. Mol. Pharm. 2012;9:3107–3126. doi: 10.1021/mp300233y. CrossRef PubMed. [DOI] [PubMed] [Google Scholar]
Associated Data
This section collects any data citations, data availability statements, or supplementary materials included in this article.