

Abstract
FH535 is a small-molecule inhibitor of the Wnt/β-catenin signaling pathway, which a substantial body of evidence has proven is activated in various cancers, including pancreatic cancer. Activation of the Wnt/β-catenin pathway plays an important role in tumor progression and metastasis. We investigated the inhibitory effect of FH535 on the metastasis and growth of pancreatic cancer cells. Western blotting and luciferase reporter gene assay indicated that FH535 markedly inhibited Wnt/β-catenin pathway viability in pancreatic cancer cells. In vitro wound healing, invasion, and adhesion assays revealed that FH535 significantly inhibited pancreatic cancer cell metastasis. We also observed the inhibitory effect of FH535 on pancreatic cancer cell growth via the tetrazolium and plate clone formation assays. Microarray analyses suggested that changes in the expression of multiple genes could be involved in the anti-cancer effect of FH535 on pancreatic cancer cells. Our results indicate for the first time that FH535 inhibits pancreatic cancer cell metastasis and growth, providing new insight into therapy of pancreatic cancer.
Keywords: pancreatic cancer, FH535, β-catenin, metastasis, growth
Introduction
Pancreatic cancer is one of the most aggressive human malignancies worldwide. Despite improvements in surgical and chemotherapeutic approaches over the past decades, the prognosis of pancreatic cancer remains dismal; the average overall 5-year survival rate is <5%.1 The reasons for this are the challenges associated with diagnosis, which tends to be late and uncertain; more importantly, therapeutic options are limited. Even with early diagnosis and surgical resection with curative intention, nearly all patients develop local recurrence or distant metastases following surgery and eventually succumb to the debilitating effects of metastatic growth.2,3 Conventional chemotherapy is rarely curative for metastatic pancreatic cancer. In recent years, there have been important advances in the organization of care for patients with pancreatic cancer; these advances have also resulted in more focused studies on surgical, oncological, and immunological treatment.
The Wnt/β-catenin pathway is a genetically conserved signaling pathway associated with a variety of human conditions such as birth defects and tumors. Abnormal Wnt/β-catenin pathway activation is closely related to the development of many cancers.4,5 An increasing amount of evidence demonstrates that both the β-catenin-dependent (canonical) and β-catenin-independent (non-canonical) Wnt signaling pathways play a key role in regulating pathological processes by facilitating tumor growth, migration, and invasion. In canonical Wnt signaling, glycogen synthase kinase-3β (GSK-3β) phosphorylates β-catenin at certain key residues, leading to its ubiquitination and subsequent degradation.5,6 Non-phosphorylated β-catenin accumulates in the cytoplasm, and pathway activation leads to nuclear accumulation of β-catenin and interaction with T-cell factor (TCF) transcription factors, subsequently stimulating the downstream target genes, which include the genes participating in cell metastasis and proliferation.7,8
Abnormal Wnt/β-catenin pathway activation plays an important role in human pancreatic cancer, where it causes extracellular matrix degradation and uncontrolled cell proliferation and differentiation.9 Recent studies have demonstrated that FH535 is a synthetic inhibitor of the canonical Wnt signaling pathway; it inhibits the growth of colon, lung, breast, and hepatocellular carcinoma lines,10,11 suggesting that small-molecule targeting of the Wnt/β-catenin pathway could be a promising therapeutic approach for cancers in which this pathway is activated.
In this study, we investigated the anti-cancer effect of FH535 on pancreatic cancer and explored the mechanisms underlying the effect, providing a rationale for further development of FH535 as a promising therapeutic agent for treating pancreatic cancer.
Materials and methods
Cell cultures and reagents
The human pancreatic cancer cell lines PANC-1 and BxPC-3 were purchased from American Type Culture Collection (ATCC) (Manassas, VA, USA). The cells were maintained in Dulbecco’s Modified Eagle’s Medium (DMEM; Thermo Fisher Scientific, Waltham, MA, USA) supplemented with 10% fetal calf serum (FCS), 100 U/mL penicillin, and 100 μg/mL streptomycin (Thermo Fisher Scientific) at 37°C in a 5% CO2 incubator under a humidified atmosphere; the cells were passaged every 2–3 days for exponential growth. FH535 was purchased from EMD Millipore (Billerica, MA, USA).
Western blotting
Total protein was extracted using a lysis buffer (50 mM Tris-HCl [pH 7.4], 150 mM NaCl, 1% Triton X-100, 0.1% sodium dodecyl sulfate [SDS], 1 mM EDTA) supplemented with a protease inhibitor cocktail kit and a phosphatase inhibitor cocktail kit (Hoffman-La Roche Ltd., Basel, Switzerland). The protein extracts were loaded, size-fractionated by SDS-polyacrylamide gel electrophoresis, and transferred to polyvinylidene difluoride membranes (Bio-Rad Laboratories Inc., Hercules, CA, USA). After blocking, the membranes were incubated with the primary antibodies mouse anti-β-catenin (Santa Cruz Biotechnology Inc., Dallas, TX, USA) and rabbit anti-β-actin (Proteintech Group Inc., Chicago, IL, USA) at 4°C overnight. Protein expression was determined using horseradish peroxidase-conjugated anti-mouse or anti-rabbit secondary antibodies, followed by detection using enhanced chemiluminescence (EMD Millipore). Band intensity was visualized using a JS-1035 image analysis scanning system (Shanghai Peiqing Science & Technology, Co., Ltd., Shanghai, People’s Republic of China).
Luciferase reporter assay
β-catenin is a dominant factor in the Wnt/β-catenin/TCF signaling pathway, which regulates gene transcription by binding β-catenin and TCF. The activity of this final step in the pathway can be precisely measured using a luciferase reporter construct. The reporter plasmid pTOPFLASH (TCF reporter plasmid; EMD Millipore) contains two sets (the second set is in the reverse orientation) of three copies of the TCF binding site (wild-type) upstream of the thymidine kinase minimal promoter and luciferase open reading frame. The internal control plasmid pRL-SV40 (Promega Corporation, Fitchburg, WI, USA) contains the Renilla luciferase gene. Cells were transiently cotransfected with pTOPFLASH plasmid (500 ng/well) and pRL-SV40 plasmid (100 ng/well) for 6 hours using Lipofectamine 2000 (Thermo Fisher Scientific) according to the manufacturer’s protocol. Then, the medium was renewed and FH535 was added. After 24 hours of treatment, cell lysates were subjected to the dual luciferase reporter assay according to the manufacturer’s recommendations; luciferase activity was measured using a luminometer (Turner Designs, Sunnyvale, CA, USA). The results are expressed as relative luciferase activity, ie, the ratio of firefly luciferase activity over Renilla luciferase activity.
Wound healing assay
Cells (1×10⁴/well) were seeded in 96-well plates and grown to confluence. The monolayer culture was artificially scrape wounded with a sterile micropipette tip to create a denuded zone of constant width. Each well was washed with phosphate-buffered saline twice to remove the detached cells before FH535 treatment. Cell migration to the wounded region was observed using an XDS-1B inverted microscope (MIC Optical and Electrical Instrument, Chongqing, People’s Republic of China) and photographed (×40 magnification). Images were captured at 0, 8, and 12 hours to monitor the wound healing process. The wound areas were measured using ImageJ (NIH, Bethesda, MA, USA).
Transwell invasion assay
We used a 24-well Transwell plate with an 8 μm pore size polycarbonate filter membrane (Corning Incorporated, Corning, NY, USA). Cells (1×10⁵) in 100 μL serum-free DMEM were added to the Matrigel-coated top chamber (BD Biosciences, San Jose, CA, USA); the bottom chamber contained DMEM with 10% FCS. The cells were incubated for 24 hours; cells that had invaded through the Matrigel-coated membrane were fixed and stained with crystal violet and counted under a light microscope in five random fields in a blinded fashion.
Adhesion assay
Cells were resuspended in complete medium and seeded in 24-well plates at 1×10⁴ cells/mL. After 5-hour incubation, the unattached cells were removed to another well. The attached and unattached cells were evaluated using the 3-[4,5-dimethylthiazol-2-yl] 2,5-diphenyltetrazolium bromide (MTT) assay. The adhesion rate was calculated as follows: (absorbance of attached cells/[absorbance of attached cells + absorbance of unattached cells]) ×100%.
MTT assay
Cell growth was evaluated using the MTT assay. Cells (5×10⁴/well) were seeded in 24-well tissue culture plates. Blank control was treated with DMSO. After FH535 treatment, MTT (Sigma-Aldrich Co., St Louis, MO, USA) was added to each well (final concentration, 0.5 mg/mL), followed by 4-hour incubation at 37°C. The medium was removed, and 800 μL of dimethyl sulfoxide was added to each well. The absorbance of the mixture was measured at 490 nm using a microplate enzyme-linked immunosorbent assay reader (Bio-Rad Laboratories Inc.). The relative cell viability was calculated as follows: relative cell viability = (mean experimental absorbance/mean control absorbance) ×100%.
Plate clone formation assay
Cells (200/well) were seeded in 24-well plates and treated after 12 hours. After 15 days, the cells were stained with 1% methylrosanilinium chloride, and the number of visible colonies was counted. The relative clone formation ability was calculated as follows: (mean experimental clone number/mean control clone number) ×100%.
Cell cycle analysis
Before treatment, the cells were serum starved for 24 hours to synchronize the cell cycle. Then, FCS was added to the cells, followed by various concentrations of FH535. Following 24 hours of FH535 treatment, the cells were fixed in 80% cooled ethanol and incubated with 0.5% Triton X-100 solution containing 1 mg/mL RNase A at 37°C for 30 minutes. Next, propidium iodide (Sigma-Aldrich Co.) was added to the wells (final concentration, 50 μg/mL), followed by 30-minute incubation in the dark. Cellular DNA content was analyzed using a fluorescence-activated cell sorter (Becton Dickinson, Franklin Lakes, NJ, USA). Data were processed using ModFit LT software (Verity Software House, Topsham, ME, USA).
Microarray assay
Sample preparation and processing were performed as described in the GeneChip Expression Analysis Manual (Agilent Technologies, Santa Clara, CA, USA). Differentially expressed genes were screened using Agilent 44K human whole-genome oligonucleotide microarrays. The selection criterion was greater than twofold difference in expression (difference in upregulated expression was greater than twofold; difference in downregulated expression was less than 0.5-fold). Hierarchical clustering of samples was performed using an average linkage algorithm using TIGR MultiExperiment Viewer (The Institute for Genomic Research, Rockville, MD, USA).
Statistical analysis
Each experiment was performed in at least triplicate. Results are expressed as the mean ± standard deviation. Statistical analysis was performed using an unpaired Student’s t-test. P<0.05 was considered significant.
Results
FH535 inhibited the β-catenin pathway in pancreatic cancer cells
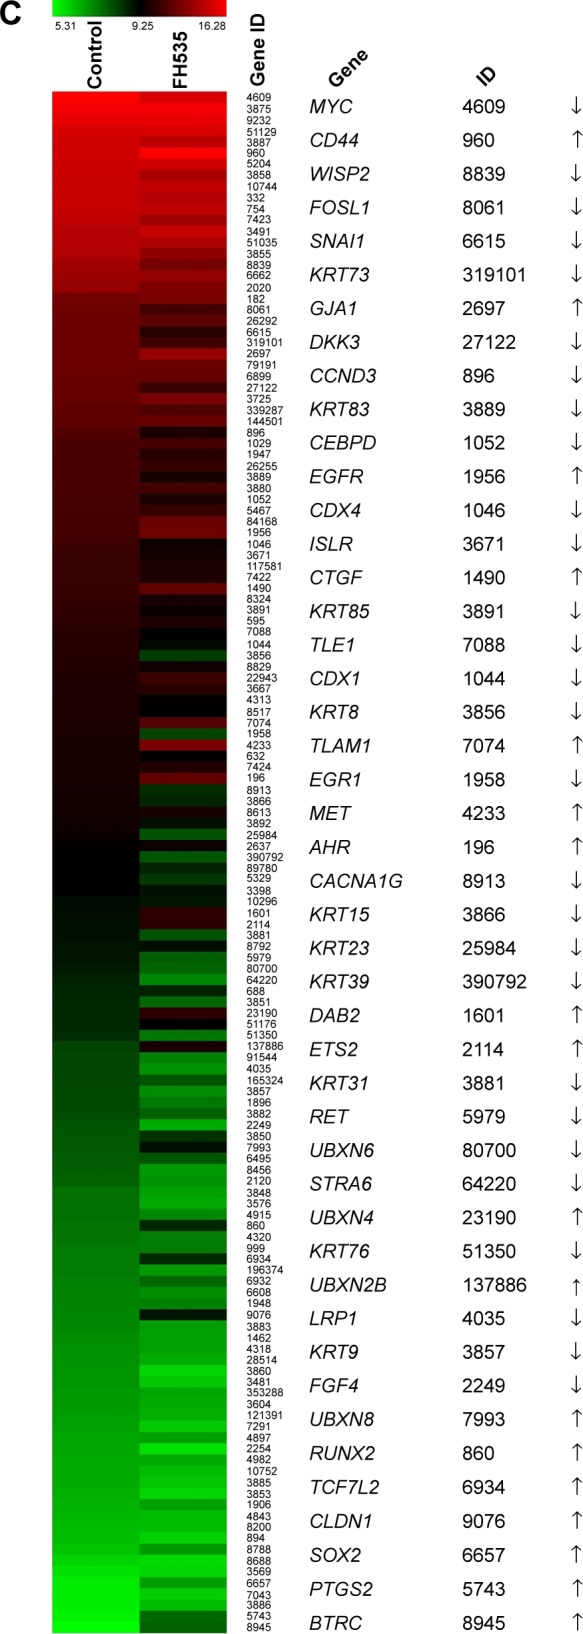
Treatment with 20 μM FH53512 did not affect nuclear or total β-catenin expression in the BxPC-3 cells, but downregulated nuclear and total β-catenin in the PANC-1 cells (Figure 1A). The luciferase reporter assay confirmed that FH535 suppressed TCF-dependent transcription, which may have led to dysregulation of the genes downstream of the β-catenin pathway (Figure 1B). To verify this, we performed microarray analyses to determine the mRNA expression changes in 138 genes downstream of the β-catenin pathway using Agilent 44K human whole-genome oligonucleotide microarrays (http://www.stanford.edu/group/nusselab/cgi-bin/wnt/target_genes); 20 μM FH535 upregulated or downregulated multiple genes (Figure 1C, Table 1).
Figure 1.

FH535 suppressed the Wnt/β-catenin pathway in pancreatic cancer cells.
Notes: (A) Time-dependent decrease by FH535 of nuclear and total β-catenin protein levels in PANC-1 cells; FH535 did not affect nuclear or total β-catenin expression in BxPC-3 cells. (B) Dose-dependent decrease by FH535 of TCF-dependent transcription. **P<0.01, significant differences vs the respective control groups. (C) Microarray analysis of expression regulation of genes downstream of the Wnt/β-catenin pathway upon 20 μM FH535 treatment. Up and down arrows indicate gene expression significantly upregulated or downregulated, respectively, by twofold.
Abbreviations: TCF, T-cell factor; h, hours.
Table 1.
Microarray analysis of expression regulation of genes downstream of the Wnt/β-catenin pathway upon 20 μM FH535 treatment
| Gene | ID | Normalized intensity
|
|
|---|---|---|---|
| Control | FH535 | ||
| MYC | 4609 | 16.268158 | 15.204586 |
| KRT18 | 3875 | 15.975001 | 16.022995 |
| PTTG1 | 9232 | 15.680945 | 15.73604 |
| ANGPTL4 | 51129 | 15.190848 | 15.278334 |
| KRT81 | 3887 | 15.0413 | 14.423697 |
| CD44 | 960 | 15.006962 | 16.199093 |
| PFDN5 | 5204 | 14.879261 | 14.964103 |
| KRT10 | 3858 | 14.799751 | 13.889791 |
| PTTG2 | 10744 | 14.772796 | 14.547727 |
| BIRC5 | 332 | 14.757564 | 14.219355 |
| PTTG1IP | 754 | 14.684395 | 14.533192 |
| VEGFB | 7423 | 14.498004 | 13.671163 |
| CYR61 | 3491 | 14.279853 | 14.790296 |
| UBXN1 | 51035 | 14.231482 | 14.049252 |
| KRT7 | 3855 | 14.184294 | 13.285099 |
| WISP2 | 8839 | 13.732449 | 12.493675 |
| SOX9 | 6662 | 13.574989 | 13.415171 |
| EN2 | 2020 | 13.393019 | 12.721889 |
| JAG1 | 182 | 12.427784 | 12.687155 |
| FOSL1 | 8061 | 12.344017 | 11.102832 |
| MYCBP | 26292 | 12.284651 | 11.974781 |
| SNAI1 | 6615 | 12.28132 | 10.385736 |
| KRT73 | 319101 | 12.23975 | 11.053284 |
| GJA1 | 2697 | 12.226766 | 13.521647 |
| IRX3 | 79191 | 12.224495 | 12.16053 |
| TBX1 | 6899 | 12.181493 | 12.043698 |
| DKK3 | 27122 | 12.076692 | 10.961267 |
| JUN | 3725 | 12.038464 | 12.673436 |
| MSL1 | 339287 | 11.920114 | 11.438548 |
| KRT80 | 144501 | 11.87818 | 12.039767 |
| CCND3 | 896 | 11.576098 | 10.075832 |
| CDKN2A | 1029 | 11.343829 | 11.097562 |
| EFNB1 | 1947 | 11.337793 | 10.368351 |
| PTTG3P | 26255 | 11.33311 | 10.750982 |
| KRT83 | 3889 | 11.319811 | 9.89329 |
| KRT19 | 3880 | 11.289505 | 11.101922 |
| CEBPD | 1052 | 11.196305 | 10.068165 |
| PPARD | 5467 | 11.19087 | 10.731722 |
| ANTXR1 | 84168 | 11.149265 | 12.122571 |
| EGFR | 1956 | 11.122326 | 12.333595 |
| CDX4 | 1046 | 10.933424 | 9.588729 |
| ISLR | 3671 | 10.854443 | 9.725897 |
| TWIST2 | 117581 | 10.853075 | 10.129753 |
| VEGFA | 7422 | 10.833399 | 10.087871 |
| CTGF | 1490 | 10.809845 | 11.98555 |
| FZD7 | 8324 | 10.711324 | 9.901575 |
| KRT85 | 3891 | 10.621079 | 9.606193 |
| CCND1 | 595 | 10.543621 | 10.14267 |
| TLE1 | 7088 | 10.343489 | 9.271956 |
| CDX1 | 1044 | 10.329419 | 9.136879 |
| KRT8 | 3856 | 10.267347 | 8.319682 |
| NRP1 | 8829 | 10.246916 | 9.627893 |
| DKK1 | 22943 | 10.211538 | 10.979951 |
| IRS1 | 3667 | 10.175792 | 10.3609915 |
| MMP2 | 4313 | 10.153262 | 9.412593 |
| IKBKG | 8517 | 10.132635 | 9.295626 |
| TIAM1 | 7074 | 10.117085 | 11.627998 |
| EGR1 | 1958 | 10.007974 | 8.180263 |
| MET | 4233 | 9.986441 | 12.74971 |
| BGLAP | 632 | 9.971276 | 9.414629 |
| VEGFC | 7424 | 9.923567 | 10.21814 |
| AHR | 196 | 9.886938 | 11.936481 |
| CACNA1G | 8913 | 9.812038 | 8.560494 |
| KRT15 | 3866 | 9.7214575 | 8.709181 |
| PPAP2B | 8613 | 9.718731 | 9.956581 |
| KRT86 | 3892 | 9.707824 | 9.012362 |
| KRT23 | 25984 | 9.573925 | 7.977122 |
| GBX2 | 2637 | 9.409858 | 9.626151 |
| KRT39 | 390792 | 9.284486 | 7.929165 |
| WNT3A | 89780 | 9.275467 | 8.68014 |
| PLAUR | 5329 | 9.265003 | 8.37788 |
| ID2 | 3398 | 9.226584 | 8.999163 |
| MAEA | 10296 | 9.087043 | 8.91366 |
| DAB2 | 1601 | 9.034534 | 10.517419 |
| ETS2 | 2114 | 8.999426 | 10.445461 |
| KRT31 | 3881 | 8.998071 | 7.96933 |
| TNFRSF11A | 8792 | 8.943393 | 9.029845 |
| RET | 5979 | 8.9224615 | 7.809108 |
| UBXN6 | 80700 | 8.850218 | 7.6966906 |
| STRA6 | 64220 | 8.746183 | 7.1663184 |
| KLF5 | 688 | 8.6543455 | 8.714795 |
| KRT4 | 3851 | 8.640165 | 7.6698284 |
| UBXN4 | 23190 | 8.607909 | 10.505396 |
| LEF1 | 51176 | 8.601926 | 9.380911 |
| KRT76 | 51350 | 8.571253 | 7.397269 |
| UBXN2B | 137886 | 8.2286415 | 9.982969 |
| UBXN11 | 91544 | 8.179481 | 7.272692 |
| LRP1 | 4035 | 8.175423 | 6.988433 |
| UBXN2A | 165324 | 8.133479 | 7.9562063 |
| KRT9 | 3857 | 8.110517 | 7.0731263 |
| EDA | 1896 | 8.09645 | 7.4072337 |
| KRT32 | 3882 | 8.087603 | 7.7537346 |
| FGF4 | 2249 | 7.9492774 | 6.5977035 |
| KRT3 | 3850 | 7.8908534 | 8.469248 |
| UBXN8 | 7993 | 7.86574 | 9.013798 |
| SIX1 | 6495 | 7.818405 | 7.9264607 |
| FOXN1 | 8456 | 7.7998743 | 6.8640747 |
| ETV6 | 2120 | 7.7085342 | 7.0067773 |
| KRT1 | 3848 | 7.5221066 | 6.7497764 |
| IL8 | 3576 | 7.501872 | 6.6113296 |
| NTRK2 | 4915 | 7.497469 | 7.1365094 |
| RUNX2 | 860 | 7.4688272 | 8.628798 |
| MMP11 | 4320 | 7.460847 | 7.2920337 |
| CDH1 | 999 | 7.3595057 | 7.319695 |
| TCF7L2 | 6934 | 7.3556123 | 8.6040535 |
| KRT78 | 196374 | 7.349466 | 6.8676143 |
| TCF7 | 6932 | 7.270456 | 7.664296 |
| SMO | 6608 | 7.222788 | 7.0400887 |
| EFNB2 | 1948 | 7.1960526 | 7.26771 |
| CLDN1 | 9076 | 7.1643777 | 8.943991 |
| KRT33A | 3883 | 7.121948 | 6.808277 |
| VCAN | 1462 | 7.045421 | 6.763195 |
| MMP9 | 4318 | 7.0101504 | 6.7540355 |
| DLL1 | 28514 | 6.969655 | 6.5782347 |
| KRT13 | 3860 | 6.949356 | 5.971072 |
| IGF2 | 3481 | 6.933426 | 6.170534 |
| KRT26 | 353288 | 6.869997 | 6.697632 |
| TNFRSF9 | 3604 | 6.862919 | 6.6031585 |
| KRT74 | 121391 | 6.778076 | 6.538765 |
| TWIST1 | 7291 | 6.765423 | 6.105777 |
| NRCAM | 4897 | 6.677019 | 6.7818675 |
| FGF9 | 2254 | 6.6647215 | 5.7855196 |
| TNFRSF11B | 4982 | 6.6092443 | 6.618697 |
| CHL1 | 10752 | 6.6082654 | 6.3569694 |
| KRT34 | 3885 | 6.601664 | 6.199431 |
| KRT6A | 3853 | 6.536037 | 5.9656916 |
| EDN1 | 1906 | 6.476451 | 6.7537594 |
| NOS2 | 4843 | 6.425461 | 6.333558 |
| GDF5 | 8200 | 6.3569694 | 6.3291264 |
| CCND2 | 894 | 6.3239446 | 5.996339 |
| DLK1 | 8788 | 6.2332454 | 6.884508 |
| KRT37 | 8688 | 5.971611 | 5.881136 |
| IL6 | 3569 | 5.7313643 | 5.9466343 |
| SOX2 | 6657 | 5.6166873 | 6.7975965 |
| TGFB3 | 7043 | 5.5891886 | 6.0552535 |
| KRT35 | 3886 | 5.5883365 | 6.3580856 |
| PTGS2 | 5743 | 5.5262737 | 7.601541 |
| BTRC | 8945 | 5.3152456 | 7.7473273 |
FH535 inhibited pancreatic cancer cell migration
In all, 20 μM FH535 inhibited pancreatic cancer cell migration in a time-dependent manner (Figure 2A). To investigate the mechanisms involved, we analyzed the microarray data to illustrate the expression of genes participating in focal adhesion (Figure 2B, Table 2),13,14 adhesion junctions (Figure 2C, Table 3),15–17 tight junctions (Figure 2D, Table 4),18–23 and cell motility (Figure 2E, Table 5).24–27
Figure 2.


FH535 inhibited pancreatic cancer cell migration.
Notes: (A) Time-dependent inhibition by FH535 of PANC-1 and BxPC-3 cell migration. **P<0.01, significant differences vs the respective control groups. Microarray analysis of (B) focal adhesion–related, (C) adhesion junction–related, (D) tight junction–related, and (E) cell motility–related gene expression regulation upon FH535 treatment. Up and down arrows indicate gene expression significantly upregulated or downregulated, respectively, by twofold. Asterisks indicate genes downstream of the Wnt/β-catenin pathway.
Abbreviation: h, hours.
Table 2.
Microarray analysis of focal adhesion–related gene expression regulation upon FH535 treatment
| Gene | ID | Normalized intensity
|
|
|---|---|---|---|
| Control | FH535 | ||
| RPSA | 3921 | 16.551584 | 16.069508 |
| RHOA | 387 | 15.761177 | 14.786651 |
| ACTN4 | 81 | 15.032014 | 14.01403 |
| CAPN2 | 824 | 14.947017 | 15.841314 |
| RAC1 | 5879 | 14.251518 | 15.113209 |
| FLNA | 2316 | 14.083586 | 13.488903 |
| FLNB | 2317 | 13.958575 | 13.296808 |
| ITGB5 | 3693 | 13.888797 | 13.484464 |
| DNM1 | 1759 | 13.640091 | 12.518821 |
| TMEM132A | 54972 | 13.622586 | 13.150153 |
| RAP1A | 5906 | 13.5597315 | 14.039375 |
| HGS | 9146 | 13.533683 | 13.846248 |
| VCL | 7414 | 13.376745 | 13.681126 |
| DIAPH1 | 1729 | 13.16062 | 13.659487 |
| GNG11 | 2791 | 13.022779 | 13.403848 |
| AKT1 | 207 | 12.957863 | 12.259176 |
| RAC2 | 5880 | 12.955015 | 11.604415 |
| ITGA3 | 3675 | 12.797894 | 12.391577 |
| ITGB1 | 3688 | 12.738785 | 13.636554 |
| CAV1 | 857 | 12.61244 | 13.617725 |
| ITGB2 | 3689 | 12.546266 | 11.473748 |
| ACTN1 | 87 | 12.409878 | 11.967234 |
| ITGAV | 3685 | 12.278682 | 14.3424 |
| ITGA6 | 3655 | 12.273888 | 14.392418 |
| ITGA5 | 3678 | 12.169847 | 10.866323 |
| ILK | 3611 | 12.11682 | 11.583433 |
| TLN1 | 7094 | 12.096641 | 10.645829 |
| SGCE | 8910 | 12.047686 | 12.282321 |
| ITGB4 | 3691 | 11.982763 | 11.56935 |
| PRKCA | 5578 | 11.918201 | 13.803304 |
| CTNNB1 | 1499 | 11.900537 | 11.841962 |
| FXYD5 | 53827 | 11.859393 | 10.980669 |
| AKT2 | 208 | 11.791592 | 10.995004 |
| CAV2 | 858 | 11.534644 | 11.731664 |
| VAV2 | 7410 | 11.322939 | 10.17948 |
| CDC42 | 998 | 11.250544 | 11.791042 |
| PARVB | 29780 | 11.224628 | 9.830263 |
| ZYX | 7791 | 10.997072 | 9.663998 |
| VASP | 7408 | 10.877319 | 10.418066 |
| RAF1 | 5894 | 10.594473 | 10.865986 |
| SHC1 | 6464 | 10.287678 | 8.595637 |
| DSP | 1832 | 10.226259 | 11.500326 |
| PARVA | 55742 | 10.0804615 | 10.301352 |
| ITGAM | 3684 | 10.003317 | 8.889115 |
| AKT3 | 10000 | 9.999831 | 12.071189 |
| HRAS | 3265 | 9.972342 | 9.272375 |
| PDPK1 | 5170 | 9.005413 | 9.698432 |
| HPSE | 10855 | 8.978405 | 8.067395 |
| PTK2 | 5747 | 8.939062 | 10.820772 |
| DNM2 | 1785 | 8.613899 | 7.43392 |
| SH3PXD2A | 9644 | 8.566784 | 9.949804 |
| BCAR1 | 9564 | 8.529809 | 7.7692404 |
| ACTN2 | 88 | 8.437073 | 7.474538 |
| PARD6B | 84612 | 8.172608 | 9.636746 |
| SOS1 | 6654 | 7.9648976 | 7.5355105 |
| DST | 667 | 7.7908773 | 11.245214 |
| ITGA11 | 22801 | 7.7725782 | 7.250522 |
| ITGA9 | 3680 | 7.725706 | 7.2797456 |
| PIK3CA | 5290 | 7.546133 | 9.475706 |
| CRK | 1398 | 7.5114365 | 8.404298 |
| ITGA2B | 3674 | 7.474538 | 6.8249826 |
| PXN | 5829 | 7.426979 | 6.493304 |
| SPTB | 6710 | 7.143782 | 6.598218 |
| PTEN | 5728 | 7.0376005 | 9.120998 |
| CASK | 8573 | 6.554297 | 9.147331 |
| ITGA2 | 3673 | 6.538141 | 10.171594 |
| SORBS1 | 10580 | 6.5160394 | 7.080136 |
| SELE | 6401 | 5.8820415 | 7.629673 |
| ARHGAP5 | 394 | 5.628543 | 7.9602804 |
| ITGA1 | 3672 | 5.3547735 | 7.6031985 |
| ZEB2 | 9839 | 5.2203803 | 6.942315 |
Table 3.
Microarray analysis of adhesion junction–related gene expression regulation upon FH535 treatment
| Gene | ID | Normalized intensity
|
|
|---|---|---|---|
| Control | FH535 | ||
| PFN1 | 5216 | 16.843973 | 16.144138 |
| RHOA | 387 | 15.761177 | 14.786651 |
| ACTN4 | 81 | 15.032014 | 14.01403 |
| CD44 | 960 | 15.006962 | 16.199093 |
| RAC1 | 5879 | 14.251518 | 15.113209 |
| CTNNA1 | 1495 | 14.209974 | 14.654735 |
| FLNA | 2316 | 14.083586 | 13.488903 |
| MAPRE1 | 22919 | 13.413141 | 13.8757925 |
| DIAPH1 | 1729 | 13.16062 | 13.659487 |
| RAC2 | 5880 | 12.955015 | 11.604415 |
| CD99 | 4267 | 12.8705635 | 12.11682 |
| JUP | 3728 | 12.776809 | 12.098349 |
| ACTN1 | 87 | 12.409878 | 11.967234 |
| CDH2 | 1000 | 12.27524 | 13.657263 |
| TLN1 | 7094 | 12.096641 | 10.645829 |
| IQGAP1 | 8826 | 11.903805 | 15.008826 |
| CTNNB1 | 1499 | 11.900537 | 11.841962 |
| PKP3 | 11187 | 11.572304 | 11.483009 |
| CAV2 | 858 | 11.534644 | 11.731664 |
| MGAT5 | 4249 | 11.399225 | 12.44798 |
| CSNK2A1 | 1457 | 11.389523 | 10.994029 |
| PLEK2 | 26499 | 11.380254 | 12.049034 |
| ANAPC1 | 64682 | 11.330902 | 11.025982 |
| NOTCH1 | 4851 | 11.311136 | 10.345143 |
| CDC42 | 998 | 11.250544 | 11.791042 |
| NOTCH2 | 4853 | 11.125797 | 10.202223 |
| WASL | 8976 | 10.930079 | 12.483249 |
| DLG5 | 9231 | 10.567565 | 11.019769 |
| SRC | 6714 | 10.48147 | 9.648777 |
| PAK4 | 10298 | 10.446864 | 8.676079 |
| VEGFA | 7422 | 10.250756 | 7.901348 |
| ZEB1 | 6935 | 10.177025 | 13.283847 |
| JAM3 | 83700 | 10.084784 | 9.556893 |
| PVRL2 | 5819 | 10.018614 | 8.147698 |
| MET | 4233 | 9.986441 | 12.74971 |
| CSNK2A2 | 1459 | 9.960693 | 9.169151 |
| PTPN1 | 5770 | 9.82763 | 9.271097 |
| PTK2B | 2185 | 9.636893 | 10.68203 |
| DOCK1 | 1793 | 9.48097 | 11.021774 |
| MAPK1 | 5594 | 9.240688 | 9.218932 |
| ARHGEF7 | 8874 | 9.037083 | 9.147919 |
| CBLL1 | 79872 | 9.0251875 | 9.311203 |
| PKP2 | 5318 | 9.022291 | 10.025781 |
| BAIAP2 | 10458 | 9.018734 | 8.004229 |
| JAM2 | 58494 | 8.789471 | 8.162707 |
| CAV3 | 859 | 8.535716 | 8.229119 |
| ACTN2 | 88 | 8.437073 | 7.474538 |
| PKP1 | 5317 | 8.423988 | 7.3570046 |
| CDH3 | 1001 | 8.389479 | 7.50349 |
| CSF1 | 1435 | 8.360545 | 7.4550886 |
| TJP3 | 27134 | 8.295799 | 7.207067 |
| WASF1 | 8936 | 8.178464 | 7.4462004 |
| PVRL1 | 5818 | 8.152037 | 7.283169 |
| ESR1 | 2099 | 8.048168 | 7.405365 |
| OCLN | 100506658 | 8.036663 | 9.494983 |
| PIP5K1C | 23396 | 7.9606485 | 7.254657 |
| CTNND1 | 1500 | 7.8659673 | 7.09317 |
| MAP1B | 4131 | 7.7052383 | 10.589897 |
| DSG2 | 1829 | 7.513804 | 8.2605915 |
| CDH1 | 999 | 7.3595057 | 7.319695 |
| ACTN3 | 89 | 7.355976 | 6.6988516 |
| VCAN | 1462 | 7.045421 | 6.763195 |
| DLL1 | 28514 | 6.969655 | 6.5782347 |
| VPS13A | 23230 | 6.859817 | 10.562696 |
| DSG4 | 147409 | 6.608555 | 6.1116643 |
| DSC2 | 1824 | 6.3962626 | 7.24841 |
| INADL | 10207 | 6.08029 | 8.808925 |
| PNN | 5411 | 5.9342465 | 7.5790677 |
| APC | 324 | 5.3153567 | 6.5241365 |
| ITGA2 | 3673 | 6.538141 | 10.171594 |
| SORBS1 | 10580 | 6.5160394 | 7.080136 |
| SELE | 6401 | 5.8820415 | 7.629673 |
| ARHGAP5 | 394 | 5.628543 | 7.9602804 |
| ITGA1 | 3672 | 5.3547735 | 7.6031985 |
| ZEB2 | 9839 | 5.2203803 | 6.942315 |
Table 4.
Microarray analysis of tight junction–related gene expression regulation upon FH535 treatment
| Gene | ID | Normalized intensity
|
|
|---|---|---|---|
| Control | FH535 | ||
| RHOA | 387 | 15.761177 | 14.786651 |
| CLDN4 | 1364 | 15.11957 | 14.539507 |
| ACTN4 | 81 | 15.032014 | 14.01403 |
| CD44 | 960 | 15.006962 | 16.199093 |
| CAPN2 | 824 | 14.947017 | 15.841314 |
| TIMP2 | 7077 | 14.796619 | 14.858342 |
| CFL1 | 1072 | 14.710272 | 13.114106 |
| CSNK2B | 1460 | 14.4039135 | 14.575101 |
| RAC1 | 5879 | 14.251518 | 15.113209 |
| CTNNA1 | 1495 | 14.209974 | 14.654735 |
| MAPRE1 | 22919 | 13.413141 | 13.8757925 |
| ARHGDIA | 396 | 13.207352 | 11.634186 |
| EZR | 7430 | 13.144885 | 12.566931 |
| JAG1 | 182 | 12.427784 | 12.687155 |
| ACTN1 | 87 | 12.409878 | 11.967234 |
| TSPAN13 | 27075 | 12.246902 | 11.379381 |
| ILK | 3611 | 12.11682 | 11.583433 |
| ICAM1 | 3383 | 12.0056095 | 11.118488 |
| CLDN7 | 1366 | 11.972866 | 11.032687 |
| MMP1 | 4312 | 11.905035 | 12.887484 |
| CTNNB1 | 1499 | 11.900537 | 11.841962 |
| COL16A1 | 1307 | 11.647751 | 10.777789 |
| CSNK2A1 | 1457 | 11.389523 | 10.994029 |
| ENAH | 55740 | 11.354481 | 13.398125 |
| MLLT4 | 4301 | 11.299263 | 13.275789 |
| CDC42 | 998 | 11.250544 | 11.791042 |
| IGF1R | 3480 | 11.2369585 | 12.140446 |
| CLDN19 | 149461 | 11.222952 | 10.278006 |
| CTGF | 1490 | 10.809845 | 11.98555 |
| FZD7 | 8324 | 10.711324 | 9.901575 |
| MAPRE2 | 10982 | 10.535324 | 11.375724 |
| SVIL | 6840 | 10.304885 | 11.463148 |
| CLDN2 | 9075 | 10.221999 | 7.959734 |
| THBS3 | 7059 | 10.1687765 | 9.736564 |
| LIMK1 | 3984 | 10.151468 | 9.52237 |
| MPP5 | 64398 | 10.149654 | 12.064446 |
| TIAM1 | 7074 | 10.117085 | 11.627998 |
| CGN | 57530 | 10.004088 | 9.987757 |
| CSNK2A2 | 1459 | 9.960693 | 9.169151 |
| PRKCI | 5584 | 9.934886 | 11.633633 |
| CRKL | 1399 | 9.737389 | 9.574368 |
| TJAP1 | 93643 | 9.66933 | 9.609078 |
| CLDN12 | 9069 | 9.506469 | 10.83943 |
| TJP1 | 7082 | 9.28694 | 12.134832 |
| PARD6A | 50855 | 9.12321 | 8.362814 |
| ARHGEF7 | 8874 | 9.037083 | 9.147919 |
| PDPK1 | 5170 | 9.005413 | 9.698432 |
| CDH5 | 1003 | 8.708324 | 7.5856657 |
| LMO7 | 4008 | 8.558113 | 9.277104 |
| SPTAN1 | 6709 | 8.494044 | 7.7864056 |
| ACTN2 | 88 | 8.437073 | 7.474538 |
| CLDN9 | 9080 | 8.4181795 | 7.5940213 |
| CSF1 | 1435 | 8.360545 | 7.4550886 |
| TJP2 | 9414 | 8.343918 | 7.3491254 |
| HAS1 | 3036 | 8.124433 | 7.6573296 |
| CLDN16 | 10686 | 7.9999046 | 7.022292 |
| AMOTL1 | 154810 | 7.8963585 | 7.8100796 |
| CRK | 1398 | 7.5114365 | 8.404298 |
| ACTN3 | 89 | 7.355976 | 6.6988516 |
| PRKCG | 5582 | 7.321149 | 6.9112835 |
| CLDN6 | 9074 | 7.220466 | 6.6578355 |
| CLDN1 | 9076 | 7.1643777 | 8.943991 |
| CLDN15 | 24146 | 7.0927997 | 6.5795236 |
| CLDN10 | 9071 | 7.0557775 | 6.613464 |
| PTEN | 5728 | 7.0376005 | 9.120998 |
| SMAD2 | 4087 | 6.9688606 | 9.496367 |
| PARD3 | 56288 | 6.94016 | 7.33421 |
| CLEC3B | 7123 | 6.6491346 | 6.5587797 |
| SPP1 | 6696 | 6.37645 | 6.842924 |
| MAGI1 | 9223 | 6.3656254 | 7.168139 |
| CTTN | 2017 | 6.2022476 | 6.6959023 |
| ERBB3 | 2065 | 6.178696 | 5.9926624 |
Table 5.
Microarray analysis of cell motility–related gene expression regulation upon FH535 treatment
| Gene | ID | Normalized intensity
|
|
|---|---|---|---|
| Control | FH535 | ||
| VIM | 7431 | 18.111416 | 18.417988 |
| PERP | 64065 | 17.034954 | 17.530819 |
| MYH9 | 4627 | 16.01196 | 15.906586 |
| RHOA | 387 | 15.761177 | 14.786651 |
| ACTN4 | 81 | 15.032014 | 14.01403 |
| TIMP2 | 7077 | 14.796619 | 14.858342 |
| MSN | 4478 | 14.751841 | 15.357616 |
| CFL1 | 1072 | 14.710272 | 13.114106 |
| RAC1 | 5879 | 14.251518 | 15.113209 |
| RAP1B | 5908 | 14.023661 | 15.037672 |
| TIMP1 | 7076 | 13.919523 | 13.2338505 |
| CDK4 | 1019 | 13.87332 | 13.635977 |
| RHOC | 389 | 13.521647 | 12.094296 |
| LAMC1 | 3915 | 13.492421 | 14.51922 |
| VCL | 7414 | 13.376745 | 13.681126 |
| ACTR3 | 10096 | 13.228158 | 14.45616 |
| DIAPH1 | 1729 | 13.16062 | 13.659487 |
| EZR | 7430 | 13.144885 | 12.566931 |
| VAPA | 9218 | 13.089962 | 13.857084 |
| AKT1 | 207 | 12.957863 | 12.259176 |
| RAC2 | 5880 | 12.955015 | 11.604415 |
| ACTR2 | 10097 | 12.94824 | 13.651513 |
| ITGB1 | 3688 | 12.738785 | 13.636554 |
| PRKCZ | 5590 | 12.597843 | 11.836956 |
| ITGB2 | 3689 | 12.546266 | 11.473748 |
| ACTN1 | 87 | 12.409878 | 11.967234 |
| ILK | 3611 | 12.11682 | 11.583433 |
| SGCE | 8910 | 12.047686 | 12.282321 |
| ICAM1 | 3383 | 12.0056095 | 11.118488 |
| PPL | 5493 | 11.998627 | 11.51075 |
| PRKCA | 5578 | 11.918201 | 13.803304 |
| PPPDE2 | 27351 | 11.624274 | 11.774211 |
| ENAH | 55740 | 11.354481 | 13.398125 |
| CDC42 | 998 | 11.250544 | 11.791042 |
| EGFR | 1956 | 11.122326 | 12.333595 |
| WASL | 8976 | 10.930079 | 12.483249 |
| CALD1 | 800 | 10.921519 | 12.294691 |
| STEAP1 | 26872 | 10.895491 | 11.820029 |
| TGFB1 | 7040 | 10.7152 | 9.03388 |
| CAMK2N1 | 55450 | 10.587699 | 10.065469 |
| RDX | 5962 | 10.522251 | 12.191257 |
| MCAM | 4162 | 10.452353 | 9.462444 |
| ARF6 | 382 | 10.415711 | 11.52632 |
| SVIL | 6840 | 10.304885 | 11.463148 |
| RGS2 | 5997 | 10.257294 | 9.80196 |
| VEGFA | 7422 | 10.250756 | 7.901348 |
| CAPN1 | 823 | 10.239203 | 8.216266 |
| F11R | 50848 | 10.234683 | 9.044022 |
| RND3 | 390 | 10.199277 | 12.088578 |
| MMP2 | 4313 | 10.153262 | 9.412593 |
| WASF2 | 10163 | 10.085579 | 8.826545 |
| FAT1 | 2195 | 9.970972 | 12.042841 |
| RHOB | 388 | 9.965946 | 8.545685 |
| RAPGEF1 | 2889 | 9.903289 | 8.354535 |
| RASA1 | 5921 | 9.702747 | 11.502001 |
| PTK2B | 2185 | 9.636893 | 10.68203 |
| ROCK1 | 6093 | 9.603488 | 11.484902 |
| MYH10 | 4628 | 9.5496025 | 11.096066 |
| MMP15 | 4324 | 9.533566 | 8.395943 |
| DOCK1 | 1793 | 9.48097 | 11.021774 |
| PAK2 | 5062 | 9.287464 | 10.61245 |
| PLAUR | 5329 | 9.265003 | 8.37788 |
| CDC27 | 996 | 9.129515 | 11.077047 |
| MST1R | 4486 | 9.085802 | 9.12538 |
| BAIAP2 | 10458 | 9.018734 | 8.004229 |
| PTK2 | 5747 | 8.939062 | 10.820772 |
| STAT3 | 6774 | 8.847785 | 7.9192953 |
| ARHGEF2 | 9181 | 8.798216 | 8.383045 |
| PKP4 | 8502 | 8.663319 | 9.734335 |
| MARK2 | 2011 | 8.612933 | 8.00314 |
| PVRL3 | 25945 | 8.582907 | 9.851074 |
| BCAR1 | 9564 | 8.529809 | 7.7692404 |
| ARVCF | 421 | 8.524339 | 8.364944 |
| SPTAN1 | 6709 | 8.494044 | 7.7864056 |
| TJP2 | 9414 | 8.343918 | 7.3491254 |
| HCLS1 | 3059 | 8.263556 | 7.7210197 |
| WASF1 | 8936 | 8.178464 | 7.4462004 |
| HAS1 | 3036 | 8.124433 | 7.6573296 |
| ADAMTS13 | 11093 | 8.074093 | 8.375932 |
| ESR1 | 2099 | 8.048168 | 7.405365 |
| OCLN | 100506658 | 8.036663 | 9.494983 |
| WAS | 7454 | 7.9598556 | 7.412658 |
| CTNND1 | 1500 | 7.8659673 | 7.09317 |
| DOCK4 | 9732 | 7.829811 | 10.702755 |
| CDSN | 1041 | 7.738298 | 7.3062844 |
| MAP1B | 4131 | 7.7052383 | 10.589897 |
| MMP11 | 4320 | 7.460847 | 7.2920337 |
| PXN | 5829 | 7.426979 | 6.493304 |
| ACTN3 | 89 | 7.355976 | 6.6988516 |
| MTSS1 | 9788 | 7.3144355 | 8.826939 |
| VCAN | 1462 | 7.045421 | 6.763195 |
| MMP9 | 4318 | 7.0101504 | 6.7540355 |
| VTN | 7448 | 6.8925853 | 6.3992944 |
| EXOC2 | 55770 | 6.8692775 | 8.335709 |
| ECM1 | 1893 | 6.8224096 | 7.0186477 |
| TWIST1 | 7291 | 6.765423 | 6.105777 |
| ADAMTS1 | 9510 | 6.670437 | 7.5566187 |
| CASK | 8573 | 6.554297 | 9.147331 |
| PLCG1 | 5335 | 6.326862 | 6.175169 |
| CTTN | 2017 | 6.2022476 | 6.6959023 |
| FARP2 | 9855 | 5.4352922 | 5.775334 |
| CTNND2 | 1501 | 5.4170265 | 5.9111185 |
FH535 inhibited pancreatic cancer cell invasion
The Matrigel invasion assay revealed that FH535-treated cells had significantly decreased invasive capacity as compared with the control cells (Figure 3A), supporting the premise that FH535 inhibits pancreatic cancer cell invasion. Moreover, FH535 inhibited the adhesion ability of pancreatic cancer cells dose-dependently (Figure 3C). We also analyzed the microarray data to explore the changes in the expression of genes involved in the in vitro invasion process, including extracellular matrix degradation (Figure 3B, Table 6), cell adhesion (Figure 3D, Table 7),28,29 and epithelial–mesenchymal transition (EMT) (Figure 3E, Table 8).30–33
Figure 3.


FH535 inhibited pancreatic cancer cell invasion.
Notes: (A) Dose-dependent inhibition by FH535 of PANC-1 and BxPC-3 cell invasion. (B) Microarray analysis of extracellular matrix degradation–related gene expression regulation upon FH535 treatment. (C) Dose-dependent inhibition by FH535 of PANC-1 and BxPC-3 cell adhesion. *P<0.05, **P<0.01, significant differences vs the respective control groups. (D) Microarray analysis of adhesion molecule–related gene expression regulation upon FH535 treatment. (E) Microarray analysis of EMT-related gene expression regulation upon FH535 treatment. Up and down arrows indicate gene expression significantly upregulated or downregulated, respectively, by twofold. Asterisks indicate genes downstream of the Wnt/β-catenin pathway.
Abbreviation: EMT, epithelial–mesenchymal transition.
Table 6.
Microarray analysis of extracellular matrix degradation–related gene expression regulation upon FH535 treatment
| Gene | ID | Normalized intensity
|
|
|---|---|---|---|
| Control | FH535 | ||
| TGFBI | 7045 | 16.09069 | 15.894443 |
| TIMP2 | 7077 | 14.796619 | 14.858342 |
| TIMP1 | 7076 | 13.919523 | 13.2338505 |
| LAMC1 | 3915 | 13.492421 | 14.51922 |
| MMP1 | 4312 | 11.905035 | 12.887484 |
| COL16A1 | 1307 | 11.647751 | 10.777789 |
| COL5A1 | 1289 | 11.607744 | 10.272581 |
| COL6A1 | 1291 | 11.396863 | 10.174638 |
| LAMB1 | 3912 | 10.813978 | 9.924841 |
| CTGF | 1490 | 10.809845 | 11.98555 |
| THBS3 | 7059 | 10.1687765 | 9.736564 |
| MMP2 | 4313 | 10.153262 | 9.412593 |
| COL4A2 | 1284 | 9.866227 | 8.850218 |
| THBS1 | 7057 | 9.663341 | 9.193558 |
| MMP15 | 4324 | 9.533566 | 8.395943 |
| SPARC | 6678 | 9.32407 | 8.289816 |
| COL7A1 | 1294 | 8.711706 | 7.6560946 |
| LAMB3 | 3914 | 8.550647 | 8.319239 |
| HAS1 | 3036 | 8.124433 | 7.6573296 |
| ADAMTS13 | 11093 | 8.074093 | 8.375932 |
| SPG7 | 6687 | 7.799603 | 7.3888316 |
| MMP11 | 4320 | 7.460847 | 7.2920337 |
| COL12A1 | 1303 | 7.404812 | 8.422412 |
| COL14A1 | 7373 | 7.3424816 | 6.805993 |
| TNC | 3371 | 7.329479 | 6.564947 |
| VCAN | 1462 | 7.045421 | 6.763195 |
| MMP9 | 4318 | 7.0101504 | 6.7540355 |
| VTN | 7448 | 6.8925853 | 6.3992944 |
| ECM1 | 1893 | 6.8224096 | 7.0186477 |
| ADAMTS1 | 9510 | 6.670437 | 7.5566187 |
| CLEC3B | 7123 | 6.6491346 | 6.5587797 |
| SPP1 | 6696 | 6.37645 | 6.842924 |
| LAMA3 | 3909 | 6.1783895 | 5.889333 |
Table 7.
Microarray analysis of adhesion molecule–related gene expression regulation upon FH535 treatment
| Gene | ID | Normalized intensity
|
|
|---|---|---|---|
| Control | FH535 | ||
| CD44 | 960 | 15.006962 | 16.199093 |
| ITGB5 | 3693 | 13.888797 | 13.484464 |
| LAMC1 | 3915 | 13.492421 | 14.51922 |
| LAMB1 | 3912 | 12.817556 | 13.73472 |
| ITGA3 | 3675 | 12.797894 | 12.391577 |
| ITGB1 | 3688 | 12.738785 | 13.636554 |
| ITGAV | 3685 | 12.278682 | 14.3424 |
| ITGA6 | 3655 | 12.273888 | 14.392418 |
| ITGA5 | 3678 | 12.169847 | 10.866323 |
| SGCE | 8910 | 12.047686 | 12.282321 |
| ICAM1 | 3383 | 12.0056095 | 11.118488 |
| ITGB4 | 3691 | 11.982763 | 11.56935 |
| CTNNB1 | 1499 | 11.900537 | 11.841962 |
| CTNNA1 | 1495 | 11.841962 | 11.517105 |
| COL16A1 | 1307 | 11.647751 | 10.777789 |
| COL5A1 | 1289 | 11.607744 | 10.272581 |
| COL6A1 | 1291 | 11.396863 | 10.174638 |
| CTGF | 1490 | 10.809845 | 11.98555 |
| CTNND1 | 1500 | 10.622252 | 11.350482 |
| THBS3 | 7059 | 10.1687765 | 9.736564 |
| ITGAM | 3684 | 10.003317 | 8.889115 |
| THBS1 | 7057 | 9.663341 | 9.193558 |
| ITGA7 | 3679 | 9.627002 | 8.878363 |
| MMP15 | 4324 | 9.533566 | 8.395943 |
| COL7A1 | 1294 | 8.711706 | 7.6560946 |
| LAMB3 | 3914 | 8.550647 | 8.319239 |
| HAS1 | 3036 | 8.124433 | 7.6573296 |
| ADAMTS13 | 11093 | 8.074093 | 8.375932 |
| SPG7 | 6687 | 7.990712 | 6.850328 |
| COL12A1 | 1303 | 7.404812 | 8.422412 |
| CDH1 | 999 | 7.3595057 | 7.319695 |
| COL14A1 | 7373 | 7.3424816 | 6.805993 |
| TNC | 3371 | 7.329479 | 6.564947 |
| VCAN | 1462 | 7.045421 | 6.763195 |
| VTN | 7448 | 6.8925853 | 6.3992944 |
| CLEC3B | 7123 | 6.6491346 | 6.5587797 |
| ITGB2 | 3689 | 6.6435785 | 7.713477 |
| ITGA2 | 3673 | 6.538141 | 10.171594 |
| SPP1 | 6696 | 6.37645 | 6.842924 |
| LAMA3 | 3909 | 6.1783895 | 5.889333 |
| SELE | 6401 | 5.8820415 | 7.629673 |
| CTNND2 | 1501 | 5.4170265 | 5.9111185 |
| ITGA1 | 3672 | 5.3547735 | 7.6031985 |
Table 8.
Microarray analysis of EMT-related gene expression regulation upon FH535 treatment
| Gene | ID | Normalized intensity
|
|
|---|---|---|---|
| Control | FH535 | ||
| VIM | 7431 | 18.111416 | 18.417988 |
| TGFBI | 7045 | 16.09069 | 15.894443 |
| NME1 | 4830 | 15.692858 | 15.573043 |
| IGFBP4 | 3487 | 14.852157 | 13.246835 |
| MSN | 4478 | 14.751841 | 15.357616 |
| RAC1 | 5879 | 14.251518 | 15.113209 |
| KRT7 | 3855 | 14.184294 | 13.285099 |
| TIMP1 | 7076 | 13.919523 | 13.2338505 |
| COL5A2 | 1290 | 13.175857 | 12.833253 |
| TCF3 | 6929 | 13.00084 | 12.29279 |
| AKT1 | 207 | 12.957863 | 12.259176 |
| ITGB1 | 3688 | 12.738785 | 13.636554 |
| CAV1 | 857 | 12.61244 | 13.617725 |
| SNAI1 | 6615 | 12.28132 | 10.385736 |
| ITGA5 | 3678 | 12.169847 | 10.866323 |
| TLN1 | 7094 | 12.096641 | 10.645829 |
| SYMPK | 8189 | 11.942529 | 12.312602 |
| CTNNB1 | 1499 | 11.900537 | 11.841962 |
| FXYD5 | 53827 | 11.859393 | 10.980669 |
| BMP7 | 655 | 11.688513 | 10.938241 |
| COL5A1 | 1289 | 11.607744 | 10.272581 |
| AHNAK | 79026 | 11.605762 | 10.785921 |
| CAV2 | 858 | 11.534644 | 11.731664 |
| NOTCH3 | 4854 | 11.523583 | 10.370972 |
| TLN2 | 83660 | 11.404076 | 10.886059 |
| COL6A1 | 1291 | 11.396863 | 10.174638 |
| KRT19 | 3880 | 11.289505 | 11.101922 |
| IGF1R | 3480 | 11.2369585 | 12.140446 |
| EGFR | 1956 | 11.122326 | 12.333595 |
| FYN | 2534 | 10.966112 | 11.325876 |
| WASL | 8976 | 10.930079 | 12.483249 |
| CALD1 | 800 | 10.921519 | 12.294691 |
| LAMB1 | 3912 | 10.813978 | 9.924841 |
| TGFB1 | 7040 | 10.7152 | 9.03388 |
| FZD7 | 8324 | 10.711324 | 9.901575 |
| SERPINE1 | 5054 | 10.639182 | 10.452353 |
| GRB2 | 2885 | 10.605613 | 9.416897 |
| RDX | 5962 | 10.522251 | 12.191257 |
| SVIL | 6840 | 10.304885 | 11.463148 |
| PLEC | 5339 | 10.301559 | 9.204668 |
| SHC1 | 6464 | 10.287678 | 8.595637 |
| RGS2 | 5997 | 10.257294 | 9.80196 |
| MMP2 | 4313 | 10.153262 | 9.412593 |
| SSX2IP | 117178 | 10.144432 | 11.167568 |
| COL4A2 | 1284 | 9.866227 | 8.850218 |
| PPAP2B | 8613 | 9.718731 | 9.956581 |
| THBS1 | 7057 | 9.663341 | 9.193558 |
| ESAM | 90952 | 9.472261 | 8.959825 |
| NOTCH4 | 4855 | 9.433491 | 9.707824 |
| SPARC | 6678 | 9.32407 | 8.289816 |
| VEZT | 55591 | 9.128493 | 11.195451 |
| MST1R | 4486 | 9.085802 | 9.12538 |
| STAT3 | 6774 | 8.847785 | 7.9192953 |
| ZAK | 51776 | 8.719432 | 11.337164 |
| COL7A1 | 1294 | 8.711706 | 7.6560946 |
| SMURF1 | 57154 | 8.629299 | 9.522539 |
| LAMB3 | 3914 | 8.550647 | 8.319239 |
| TNS1 | 7145 | 8.064375 | 7.5303655 |
| SPG7 | 6687 | 7.990712 | 6.850328 |
| SOS1 | 6654 | 7.9648976 | 7.5355105 |
| WIPF1 | 7456 | 7.8996034 | 7.0742846 |
| BMP1 | 649 | 7.73736 | 6.776738 |
| FOXC2 | 2303 | 7.5557323 | 6.690961 |
| COL12A1 | 1303 | 7.404812 | 8.422412 |
| CDH1 | 999 | 7.3595057 | 7.319695 |
| COL14A1 | 7373 | 7.3424816 | 6.805993 |
| TNC | 3371 | 7.329479 | 6.564947 |
| IL1RN | 3557 | 7.2758436 | 6.734858 |
| SOX10 | 6663 | 7.0939784 | 6.8492174 |
| VCAN | 1462 | 7.045421 | 6.763195 |
| PTEN | 5728 | 7.0376005 | 9.120998 |
| MMP9 | 4318 | 7.0101504 | 6.7540355 |
| MPP6 | 51678 | 6.9906545 | 8.912582 |
| SYK | 6850 | 6.4246235 | 6.223468 |
| SPP1 | 6696 | 6.37645 | 6.842924 |
| ERBB3 | 2065 | 6.178696 | 5.9926624 |
| LAMA3 | 3909 | 6.1783895 | 5.889333 |
| BMP2 | 650 | 6.0141077 | 7.1390386 |
| SOS2 | 6655 | 5.6132765 | 8.797646 |
| TGFB3 | 7043 | 5.5891886 | 6.0552535 |
Abbreviation: EMT, epithelial–mesenchymal transition.
FH535 inhibited pancreatic cancer cell growth
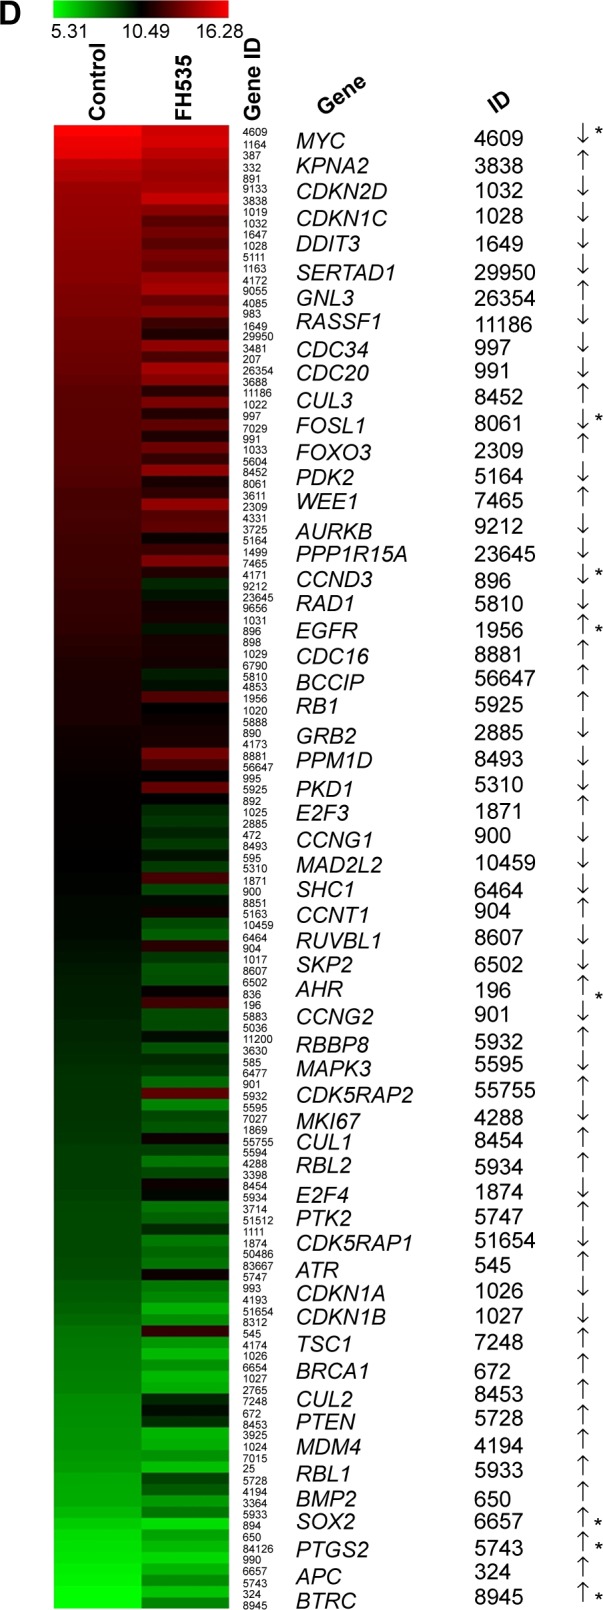
Using MTT assay, we evaluated the inhibitory effect of FH535 on pancreatic cancer cell line growth. The proliferation of PANC-1 and BxPC-3 cells cultured for up to 48 hours with FH535 was significantly inhibited time-dependently and dose-dependently as compared to the control cells (Figure 4A). The clone formation assays confirmed the dose-dependent inhibitory effect of FH535 on pancreatic cancer cell growth (Figure 4B). We performed cell cycle analysis to confirm the antimitogenic effect of FH535. FH535 induced G2/M accumulation and decreased the cell population in the G0/G1 and S phases dose-dependently (Figure 4C). The expression profile of the cell cycle–related genes obtained from microarray analyses was analyzed (Figure 4D, Table 9).34
Figure 4.

Inhibitory effect of FH535 on pancreatic cancer cell growth.
Notes: (A) Dose- and time-dependent inhibition by FH535 of PANC-1 and BxPC-3 cell growth. (B) Dose-dependent inhibition by FH535 of the clone formation ability of BxPC-3 cells. *P<0.05, **P<0.01, significant differences vs the respective control groups. (C) Significant dose-dependent G2/M arrest following FH535 treatment in BxPC-3 cells. (D) Microarray analysis of cell cycle–related gene expression regulation upon 20 μM FH535 treatment. Up and down arrows indicate gene expression significantly upregulated or downregulated, respectively, by twofold. Asterisks indicate genes downstream of the Wnt/β-catenin pathway.
Abbreviation: h, hours.
Table 9.
Microarray analysis of cell cycle–related gene expression regulation upon 20 μM FH535 treatment
| Gene | ID | Normalized intensity
|
|
|---|---|---|---|
| Control | FH535 | ||
| MYC | 4609 | 16.268158 | 15.204586 |
| CKS2 | 1164 | 15.878164 | 15.394571 |
| RHOA | 387 | 15.761177 | 14.786651 |
| BIRC5 | 332 | 14.757564 | 14.219355 |
| CCNB1 | 891 | 14.478785 | 14.022737 |
| CCNB2 | 9133 | 14.019871 | 14.271269 |
| KPNA2 | 3838 | 13.950185 | 14.971469 |
| CDK4 | 1019 | 13.87332 | 13.635977 |
| CDKN2D | 1032 | 13.839806 | 12.513427 |
| GADD45A | 1647 | 13.765451 | 13.130958 |
| CDKN1C | 1028 | 13.694702 | 12.537176 |
| PCNA | 5111 | 13.611973 | 13.2414665 |
| CKS1B | 1163 | 13.609195 | 12.845673 |
| MCM3 | 4172 | 13.580797 | 13.911951 |
| PRC1 | 9055 | 13.4114275 | 14.32471 |
| MAD2L1 | 4085 | 13.297964 | 12.867024 |
| CDK1 | 983 | 13.286596 | 13.600226 |
| DDIT3 | 1649 | 13.135856 | 11.871853 |
| SERTAD1 | 29950 | 13.060848 | 11.212 |
| IGF2 | 3481 | 13.0203 | 13.799717 |
| AKT1 | 207 | 12.957863 | 12.259176 |
| GNL3 | 26354 | 12.891848 | 14.223899 |
| ITGB1 | 3688 | 12.738785 | 13.636554 |
| RASSF1 | 11186 | 12.559567 | 11.458946 |
| CDK7 | 1022 | 12.553116 | 13.288865 |
| CDC34 | 997 | 12.53036 | 11.302476 |
| TFDP2 | 7029 | 12.527303 | 12.6644745 |
| CDC20 | 991 | 12.526335 | 11.232994 |
| CDKN3 | 1033 | 12.486179 | 12.966997 |
| MAP2K1 | 5604 | 12.483637 | 11.714967 |
| CUL3 | 8452 | 12.389215 | 13.715795 |
| FOSL1 | 8061 | 12.344017 | 11.102832 |
| ILK | 3611 | 12.11682 | 11.583433 |
| FOXO3 | 2309 | 12.095011 | 13.865094 |
| MNAT1 | 4331 | 12.074865 | 12.456777 |
| JUN | 3725 | 12.038464 | 12.673436 |
| PDK2 | 5164 | 11.944916 | 10.781894 |
| CTNNB1 | 1499 | 11.900537 | 11.841962 |
| WEE1 | 7465 | 11.894105 | 13.381722 |
| MCM2 | 4171 | 11.862871 | 11.269842 |
| AURKB | 9212 | 11.800928 | 9.697033 |
| PPP1R15A | 23645 | 11.676006 | 10.124018 |
| MDC1 | 9656 | 11.649198 | 10.940614 |
| CDKN2C | 1031 | 11.6150875 | 11.096327 |
| CCND3 | 896 | 11.576098 | 10.075832 |
| CCNE1 | 898 | 11.407219 | 11.045229 |
| CDKN2A | 1029 | 11.343829 | 11.097562 |
| AURKA | 6790 | 11.181647 | 10.961699 |
| RAD1 | 5810 | 11.162613 | 9.890079 |
| NOTCH2 | 4853 | 11.125797 | 10.202223 |
| EGFR | 1956 | 11.122326 | 12.333595 |
| CDK5 | 1020 | 11.117936 | 10.542482 |
| RAD51 | 5888 | 11.1082325 | 10.784544 |
| CCNA2 | 890 | 10.911861 | 10.9871645 |
| MCM4 | 4173 | 10.849212 | 11.05679 |
| CDC16 | 8881 | 10.808938 | 13.084003 |
| BCCIP | 56647 | 10.778181 | 12.021907 |
| CDC25C | 995 | 10.672214 | 10.564099 |
| RB1 | 5925 | 10.640414 | 12.741512 |
| CCNC | 892 | 10.610059 | 10.50804 |
| CDK9 | 1025 | 10.606858 | 9.6394415 |
| GRB2 | 2885 | 10.605613 | 9.416897 |
| ATM | 472 | 10.5960865 | 9.790577 |
| PPM1D | 8493 | 10.580978 | 9.338833 |
| CCND1 | 595 | 10.543621 | 10.14267 |
| PKD1 | 5310 | 10.471296 | 9.29677 |
| E2F3 | 1871 | 10.412796 | 12.061844 |
| CCNG1 | 900 | 10.409301 | 9.063653 |
| CDK5R1 | 8851 | 10.322197 | 10.292204 |
| PDK1 | 5163 | 10.321034 | 10.933424 |
| MAD2L2 | 10459 | 10.306548 | 9.040705 |
| SHC1 | 6464 | 10.287678 | 8.595637 |
| CCNT1 | 904 | 10.17827 | 11.456285 |
| CDK2 | 1017 | 10.10528 | 9.357359 |
| RUVBL1 | 8607 | 10.000026 | 8.814938 |
| SKP2 | 6502 | 9.937107 | 8.872935 |
| CASP3 | 836 | 9.893856 | 10.658698 |
| AHR | 196 | 9.886938 | 11.936481 |
| RAD9A | 5883 | 9.855825 | 8.961951 |
| PA2G4 | 5036 | 9.737894 | 8.966842 |
| CHEK2 | 11200 | 9.726725 | 10.255492 |
| INS | 3630 | 9.673779 | 8.813154 |
| BBS4 | 585 | 9.597437 | 9.65494 |
| SIAH1 | 6477 | 9.530121 | 9.295226 |
| CCNG2 | 901 | 9.4692955 | 8.337656 |
| RBBP8 | 5932 | 9.454372 | 12.631638 |
| MAPK3 | 5595 | 9.447224 | 7.818405 |
| TFDP1 | 7027 | 9.4434185 | 9.030092 |
| E2F1 | 1869 | 9.397123 | 8.754342 |
| CDK5RAP2 | 55755 | 9.390803 | 10.79269 |
| MAPK1 | 5594 | 9.240688 | 9.218932 |
| MKI67 | 4288 | 9.233824 | 8.092867 |
| ID2 | 3398 | 9.226584 | 8.999163 |
| CUL1 | 8454 | 9.221058 | 10.794849 |
| RBL2 | 5934 | 9.160267 | 10.348637 |
| JAG2 | 3714 | 9.075178 | 8.140677 |
| GTSE1 | 51512 | 9.04477 | 8.488665 |
| CHEK1 | 1111 | 9.04231 | 9.651725 |
| E2F4 | 1874 | 9.035055 | 8.016477 |
| G0S2 | 50486 | 9.032754 | 8.410861 |
| SESN2 | 83667 | 8.951754 | 8.138044 |
| PTK2 | 5747 | 8.939062 | 10.820772 |
| CDC25A | 993 | 8.677163 | 8.042739 |
| MDM2 | 4193 | 8.622698 | 7.73673 |
| CDK5RAP1 | 51654 | 8.508385 | 6.9220624 |
| AXIN1 | 8312 | 8.351635 | 7.6164603 |
| ATR | 545 | 8.152882 | 11.634625 |
| MCM5 | 4174 | 8.055058 | 7.4200873 |
| CDKN1A | 1026 | 8.007444 | 6.7135 |
| SOS1 | 6654 | 7.9648976 | 7.5355105 |
| CDKN1B | 1027 | 7.8906517 | 6.7354736 |
| GML | 2765 | 7.8596773 | 6.9595275 |
| TSC1 | 7248 | 7.6562896 | 9.700143 |
| BRCA1 | 672 | 7.620017 | 10.24544 |
| CUL2 | 8453 | 7.566332 | 9.5496025 |
| STMN1 | 3925 | 7.5155845 | 6.8102884 |
| CDK8 | 1024 | 7.5133963 | 6.9160185 |
| TERT | 7015 | 7.4070444 | 7.4882307 |
| ABL1 | 25 | 7.3099413 | 6.6226487 |
| PTEN | 5728 | 7.0376005 | 9.120998 |
| MDM4 | 4194 | 6.996299 | 8.63818 |
| HUS1 | 3364 | 6.976554 | 7.3689637 |
| RBL1 | 5933 | 6.7265186 | 8.035306 |
| CCND2 | 894 | 6.3239446 | 5.996339 |
| BMP2 | 650 | 6.0141077 | 7.1390386 |
| ATRIP | 84126 | 5.912352 | 6.682503 |
| CDC6 | 990 | 5.8019896 | 6.064807 |
| SOX2 | 6657 | 5.6166873 | 6.7975965 |
| PTGS2 | 5743 | 5.5262737 | 7.601541 |
| APC | 324 | 5.3153567 | 6.5241365 |
| BTRC | 8945 | 5.3152456 | 7.7473273 |
Discussion
It is widely acknowledged that the prognosis of pancreatic cancer is very poor. The canonical Wnt/β-catenin signaling pathway plays a key role in tumor development and dissemination. Classical Wnt signaling pathway causes accumulation of β-catenin in cytoplasm in complex with the transcription factor TCF/LEF that regulates target gene expression.9,35 Dysregulation of Wnt/β-catenin signaling and altered transcription of β-catenin/TCF-regulated genes are found in many cancers,36 including pancreatic cancer.37 In this regard, we focused on characterizing the mechanisms of the anti-tumor effect of FH535 on pancreatic cancer cells.
Western blotting revealed that FH535 did not affect β-catenin expression in BxPC-3 cells. Interestingly, FH535 downregulated the protein level of total β-catenin in the PANC-1 cells, which differed from the results of most previous studies.10 This cell type–dependent downregulation of β-catenin could have been due to the stabilization of axin, which suppresses β-catenin.11 Axin is characterized as a tumor-suppressor gene, and it plays a key role in inhibiting the canonical Wnt pathway by forming molecular complexes with other proteins such as GSK-3β and adenomatous polyposis coli (APC).38 Whether or not β-catenin expression was inhibited, the luciferase reporter assay proved that transcriptional activity of β-catenin pathway was decreased, which was consistent with previous study findings.10
Metastasis, the leading cause of cancer-related death, is a complex process comprising several steps, all of which we found were affected by FH535. First, FH535 inhibited pancreatic cancer cell migration. Microarray analyses revealed that FH535 altered the expression of several migration-related genes, which participate in focal adhesion, adhesion junctions, tight junctions, and/or motility regulation. Among these genes, the focal adhesion–related gene PTEN, considered “the most highly mutated tumor-suppressor gene in the post-p53 era”,39 plays a role in controlling cell migration.40 The loss of PTEN protein expression or function has been reported in many human cancers, including ovarian, endometrial, and prostate carcinoma; breast cancer; and primary gastrointestinal stromal tumor.41,42 We also found that FH535 downregulated the adhesion junction–related gene TLN1, which encodes a cytoskeletal protein that is concentrated in areas of cell–substratum and cell–cell contact. The encoded protein plays a significant role in actin filament assembly and in the spread and migration of various cell types.43,44 TLN1 is codistributed with integrins in the cell surface membrane, aiding the attachment of adherent cells to extracellular matrices and lymphocytes to other cells. In our study, tight junction protein 1 (TJP1), which plays a critical role in cell–cell interaction, proliferation, and differentiation, was upregulated. TJP1 is an important marker of tight junction integrity, which is disrupted in many highly invasive cancers; upregulated TJP1 correlates with favorable survival in breast cancer and gastrointestinal stromal tumor.45,46 The motility-related gene VEGFA significantly increases the motility of pancreatic cancer cells. The vascular endothelial growth factor/vascular endothelial growth factor receptor (VEGF/VEGFR) inhibitors bevacizumab and sunitinib significantly decrease pancreatic cancer cell motility.47 In our study, FH535 not only suppressed VEGFA expression but also inhibited cell motility, suggesting the involvement of a similar mechanism.
To establish metastasis, tumor cells must traverse the basement membrane to reach the connective tissues. Accordingly, we investigated the anti-invasive effect of FH535. The Transwell assay proved that FH535 inhibited invasion. In vitro invasion can be divided into several steps, including matrix adhesion, matrix degradation, and EMT. We analyzed the expression of the genes involved in these steps using microarray and found that FH535 significantly downregulated the cell adhesion molecule ITGA5; ITGA5 knockdown results in decreased adhesion in pancreatic cancer cells.48 The ability of matrix metalloproteinases (MMPs) to degrade extracellular matrix proteins has been well characterized; therefore, they have been studied extensively to elucidate their involvement in both tumor development and progression. Different MMPs play different roles in tumorigenesis. MMP15 appears to be upregulated during colorectal tumorigenesis, and past research has shown stromal localization of MMP15 in the early phases of neoplastic transformation in colorectal cancer.49 In our study, FH535 downregulated MMP15. Epithelial cells are characterized by well-developed junctions and apical–basolateral polarization; on the contrary, mesenchymal cells lack polarization due to the loss of an organized junctional layer. Cell metastasis is correlated with EMT. In the present study, FH535 downregulated Snail, which is upregulated during EMT.50 In human colorectal cancer cells, overexpression of Snail induces not only EMT but also a cancer stem cell–like phenotype, which enhances cell migration and invasion in vitro and increases metastasis formation in vivo.51 Snail also plays an essential role in human pancreatic cancer progression and metastasis.52,53 In the clinical setting, overexpression of Snail was previously associated with poorer prognosis and a more invasive phenotype in many malignancies.54–56 We also detected the downregulation of TGFB1, a classic EMT stimulator.57 TGFB1 overexpression is associated with early recurrence following resection and decreased survival;58 consistent with our study, the suppression of TGFB1 activity in immune-deficient orthotopic mouse models of pancreatic cancer attenuated tumor growth and metastasis.59,60
Besides metastasis, FH535 also induced G2/M arrest and inhibited pancreatic cancer cell proliferation. FH535 significantly upregulated the G2/M regulator gene BCCIP while downregulating the cell cycle regulatory genes CCNG1 and SERTAD1. Human BCCIP, a protein that interacts with BRCA2 and CDKN1A (Cip1, p21), has been implicated in many cellular processes, including cell cycle regulation, DNA recombination and damage repair, telomere maintenance, embryonic development, and genomic stability.61–63 BCCIP knockdown and concomitant p53 deletion causes rapid development of medulloblastomas, which have a wide spectrum of alterations involving the Sonic hedgehog pathway, consistent with the caretaker responsibility of BCCIP in genomic integrity.64 BCCIP expression is downregulated in human ovarian cancer, renal cell carcinoma, and colorectal cancer tissues, suggesting that the gene plays a role in the pathogenesis of these cancers.63 The positive expression rate and intensity of CCNG1 in gastric carcinoma is significantly correlated with tumor differentiation. Elevated amounts of CCNG1 are frequently detected in malignant tissue tumors, including astrocytoma; melanoma; carcinoma of the esophagus, lung, and breast; and cancer of the cervix, uterus, and ovary.65 It plays a pivotal role in hepatocellular carcinoma metastasis and may be a novel prognostic biomarker and therapeutic target.66 SERTAD1 is involved in positive regulation of the cell cycle and proliferation;67,68 accordingly, its expression is upregulated in several tumor types.69,70 Studies indicate that SERTAD1 promotes proliferation by binding to the transcription factor E2F1 and by enhancing its transcriptional activity.71 Experimental overexpression of SERTAD1 provoked hyperproliferation,72 genomic instability,68 and inhibition of apoptosis.73
We demonstrated that FH535 significantly inhibits pancreatic cancer cell metastasis by suppressing migration, invasion, and adhesion and induces the accumulation of cells in the G2/M phase to suppress proliferation. These results suggest that FH535 is a potential candidate for pancreatic cancer treatment. Some of the identified genes that responded to FH535 are well-established direct targets of the Wnt/β-catenin pathway. However, it has not been proven that the other identified genes are located downstream of the pathway. FH535 might affect the expression of these genes through the Wnt/β-catenin pathway indirectly or in a β-catenin independent manner. In fact, FH535 not only antagonizes β-catenin/TCF-mediated transcription but also inhibits recruitment of the coactivators glucocorticoid receptor-interacting protein 1 (GRIP1) and β-catenin to peroxisome proliferator-activated receptor (PPAR)δ and PPARγ,10 suggesting that these mechanisms could also be involved in the anti-cancer effect of FH535.
Acknowledgments
This study was supported by the National Natural Science Foundation of China (grant nos 81472296, 81101867, 81272542, 81200369, and 81372443), the CSPAC-Celgene Foundation, the China International Medical Foundation (grant no CIMF-F-H001-057), the Special Foundation of Clinical Medicine of Jiangsu Provincial Bureau of Science and Technology (grant no BL2014039), the Scientific Research Project of Jiangsu Provincial Bureau of Traditional Chinese Medicine (grant no L213236), the Medical Scientific Research Project of Jiangsu Provincial Bureau of Health (grant no Z201206), the Special Foundation of Wu Jieping Medical Foundation for Clinical Scientific Research (grant nos 320.6753.1225 and 320.6750.12242), the Science and Education for Health Foundation of Suzhou for Youth (grant nos SWKQ1003 and SWKQ1011), the Science and Technology Project Foundation of Suzhou (grant nos SYS201112, SYSD2012137, and SYS201335), the Science and Technology Foundation of Suzhou Xiangcheng (grant nos SZXC2012-70 and XJ201451), and a project founded by the priority academic program development of Jiangsu higher education institutions.
Footnotes
Disclosure
The authors report no conflicts of interest in this work.
References
- 1.Jemal A, Siegel R, Ward E, et al. Cancer statistics, 2006. CA Cancer J Clin. 2006;56(2):106–130. doi: 10.3322/canjclin.56.2.106. [DOI] [PubMed] [Google Scholar]
- 2.Li D, Xie K, Wolff R, Abbruzzese JL. Pancreatic cancer. Lancet. 2004;363(9414):1049–1057. doi: 10.1016/S0140-6736(04)15841-8. [DOI] [PubMed] [Google Scholar]
- 3.Bosetti C, Bertuccio P, Malvezzi M, et al. Cancer mortality in Europe, 2005–2009, and an overview of trends since 1980. Ann Oncol. 2013;24(10):2657–2671. doi: 10.1093/annonc/mdt301. [DOI] [PubMed] [Google Scholar]
- 4.Cai HH, Sun YM, Miao Y, et al. Aberrant methylation frequency of TNFRSF10C promoter in pancreatic cancer cell lines. Hepatobiliary Pancreat Dis Int. 2011;10(1):95–100. doi: 10.1016/s1499-3872(11)60014-3. [DOI] [PubMed] [Google Scholar]
- 5.Iida J, Wilhelmson KL, Price MA, et al. Membrane type-1 matrix metalloproteinase promotes human melanoma invasion and growth. J Invest Dermatol. 2004;122(1):167–176. doi: 10.1046/j.0022-202X.2003.22114.x. [DOI] [PubMed] [Google Scholar]
- 6.Eisenmann KM, McCarthy JB, Simpson MA, et al. Melanoma chondroitin sulphate proteoglycan regulates cell spreading through Cdc42, Ack-1 and p130cas. Nat Cell Biol. 1999;1(8):507–513. doi: 10.1038/70302. [DOI] [PubMed] [Google Scholar]
- 7.Vaid M, Prasad R, Sun Q, Katiyar SK. Silymarin targets beta-catenin signaling in blocking migration/invasion of human melanoma cells. PLoS One. 2011;6(7):e23000. doi: 10.1371/journal.pone.0023000. [DOI] [PMC free article] [PubMed] [Google Scholar] [Retracted]
- 8.Iida J, Pei D, Kang T, et al. Melanoma chondroitin sulfate proteoglycan regulates matrix metalloproteinase-dependent human melanoma invasion into type I collagen. J Biol Chem. 2001;276(22):18786–18794. doi: 10.1074/jbc.M010053200. [DOI] [PubMed] [Google Scholar]
- 9.Clevers H. Wnt/beta-catenin signaling in development and disease. Cell. 2006;127(3):469–480. doi: 10.1016/j.cell.2006.10.018. [DOI] [PubMed] [Google Scholar]
- 10.Handeli S, Simon JA. A small-molecule inhibitor of Tcf/beta-catenin signaling down-regulates PPARgamma and PPARdelta activities. Mol Cancer Ther. 2008;7(3):521–529. doi: 10.1158/1535-7163.MCT-07-2063. [DOI] [PubMed] [Google Scholar]
- 11.Iida J, Dorchak J, Lehman JR, et al. FH535 inhibited migration and growth of breast cancer cells. PLoS One. 2012;7(9):e44418. doi: 10.1371/journal.pone.0044418. [DOI] [PMC free article] [PubMed] [Google Scholar]
- 12.Ren J, Wang R, Song H, Huang G, Chen L. Secreted frizzled related protein 1 modulates taxane resistance of human lung adenocarcinoma. Mol Med. 2014;20:164–178. doi: 10.2119/molmed.2013.00149. [DOI] [PMC free article] [PubMed] [Google Scholar]
- 13.Hannigan G, Troussard AA, Dedhar S. Integrin-linked kinase: a cancer therapeutic target unique among its ILK. Nat Rev Cancer. 2005;5(1):51–63. doi: 10.1038/nrc1524. [DOI] [PubMed] [Google Scholar]
- 14.Legate KR, Montanez E, Kudlacek O, Fassler R. ILK, PINCH and parvin: the tIPP of integrin signalling. Nat Rev Mol Cell Biol. 2006;7(1):20–31. doi: 10.1038/nrm1789. [DOI] [PubMed] [Google Scholar]
- 15.Palacios F, Price L, Schweitzer J, Collard JG, D’Souza-Schorey C. An essential role for ARF6-regulated membrane traffic in adherens junction turnover and epithelial cell migration. EMBO J. 2001;20(17):4973–4986. doi: 10.1093/emboj/20.17.4973. [DOI] [PMC free article] [PubMed] [Google Scholar]
- 16.Pece S, Gutkind JS. E-cadherin and Hakai: signalling, remodeling or destruction? Nat Cell Biol. 2002;4(4):E72–E74. doi: 10.1038/ncb0402-e72. [DOI] [PubMed] [Google Scholar]
- 17.D’Souza-Schorey C. Disassembling adherens junctions: breaking up is hard to do. Trends Cell Biol. 2005;15(1):19–26. doi: 10.1016/j.tcb.2004.11.002. [DOI] [PubMed] [Google Scholar]
- 18.Tsukita S, Furuse M, Itoh M. Multifunctional strands in tight junctions. Nat Rev Mol Cell Biol. 2001;2(4):285–293. doi: 10.1038/35067088. [DOI] [PubMed] [Google Scholar]
- 19.Cheng CY, Mruk DD. Cell junction dynamics in the testis: sertoli-germ cell interactions and male contraceptive development. Physiol Rev. 2002;82(4):825–874. doi: 10.1152/physrev.00009.2002. [DOI] [PubMed] [Google Scholar]
- 20.Matter K, Balda MS. Signalling to and from tight junctions. Nat Rev Mol Cell Biol. 2003;4(3):225–236. doi: 10.1038/nrm1055. [DOI] [PubMed] [Google Scholar]
- 21.Balda MS, Matter K. Epithelial cell adhesion and the regulation of gene expression. Trends Cell Biol. 2003;13(6):310–318. doi: 10.1016/s0962-8924(03)00105-3. [DOI] [PubMed] [Google Scholar]
- 22.Bazzoni G, Dejana E. Endothelial cell-to-cell junctions: molecular organization and role in vascular homeostasis. Physiol Rev. 2004;84(3):869–901. doi: 10.1152/physrev.00035.2003. [DOI] [PubMed] [Google Scholar]
- 23.Furuse M, Tsukita S. Claudins in occluding junctions of humans and flies. Trends Cell Biol. 2006;16(4):181–188. doi: 10.1016/j.tcb.2006.02.006. [DOI] [PubMed] [Google Scholar]
- 24.Linder S. The matrix corroded: podosomes and invadopodia in extracellular matrix degradation. Trends Cell Biol. 2007;17(3):107–117. doi: 10.1016/j.tcb.2007.01.002. [DOI] [PubMed] [Google Scholar]
- 25.Chhabra ES, Higgs HN. The many faces of actin: matching assembly factors with cellular structures. Nat Cell Biol. 2007;9(10):1110–1121. doi: 10.1038/ncb1007-1110. [DOI] [PubMed] [Google Scholar]
- 26.McEver RP, Zhu C. Rolling cell adhesion. Annu Rev Cell Dev Biol. 2010;26:363–396. doi: 10.1146/annurev.cellbio.042308.113238. [DOI] [PMC free article] [PubMed] [Google Scholar]
- 27.Parsons JT, Horwitz AR, Schwartz MA. Cell adhesion: integrating cytoskeletal dynamics and cellular tension. Nat Rev Mol Cell Biol. 2010;11(9):633–643. doi: 10.1038/nrm2957. [DOI] [PMC free article] [PubMed] [Google Scholar]
- 28.Mullins RF, Skeie JM, Folk JC, et al. Evaluation of variants in the selectin genes in age-related macular degeneration. BMC Med Genet. 2011;12:58. doi: 10.1186/1471-2350-12-58. [DOI] [PMC free article] [PubMed] [Google Scholar]
- 29.Ciriza J, Garcia-Ojeda ME. Expression of migration-related genes is progressively upregulated in murine lineage-Sca-1+c-Kit+ population from the fetal to adult stages of development. Stem Cell Res Ther. 2010;1(2):14. doi: 10.1186/scrt14. [DOI] [PMC free article] [PubMed] [Google Scholar]
- 30.Kaartinen V, Voncken JW, Shuler C, et al. Abnormal lung development and cleft palate in mice lacking TGF-beta 3 indicates defects of epithelial-mesenchymal interaction. Nat Genet. 1995;11(4):415–421. doi: 10.1038/ng1295-415. [DOI] [PubMed] [Google Scholar]
- 31.Timmerman LA, Grego-Bessa J, Raya A, et al. Notch promotes epithelial-mesenchymal transition during cardiac development and oncogenic transformation. Genes Dev. 2004;18(1):99–115. doi: 10.1101/gad.276304. [DOI] [PMC free article] [PubMed] [Google Scholar]
- 32.Moreno-Bueno G, Cubillo E, Sarrió D, et al. Genetic profiling of epithelial cells expressing E-cadherin repressors reveals a distinct role for snail, slug, and E47 factors in epithelial-mesenchymal transition. Cancer Res. 2006;66(19):9543–9556. doi: 10.1158/0008-5472.CAN-06-0479. [DOI] [PubMed] [Google Scholar]
- 33.Yang J, Weinberg RA. Epithelial-mesenchymal transition: at the crossroads of development and tumor metastasis. Dev Cell. 2008;14(6):818–829. doi: 10.1016/j.devcel.2008.05.009. [DOI] [PubMed] [Google Scholar]
- 34.Hoffman AE, Zheng T, Ba Y, et al. Phenotypic effects of the circadian gene cryptochrome 2 on cancer-related pathways. BMC Cancer. 2010;10:110. doi: 10.1186/1471-2407-10-110. [DOI] [PMC free article] [PubMed] [Google Scholar]
- 35.Tetsu O, McCormick F. Beta-catenin regulates expression of cyclin D1 in colon carcinoma cells. Nature. 1999;398(6726):422–426. doi: 10.1038/18884. [DOI] [PubMed] [Google Scholar]
- 36.Fearon ER. PARsing the phrase “all in for axin” – Wnt pathway targets in cancer. Cancer Cell. 2009;16(5):366–368. doi: 10.1016/j.ccr.2009.10.007. [DOI] [PubMed] [Google Scholar]
- 37.White BD, Chien AJ, Dawson DW. Dysregulation of Wnt/beta-catenin signaling in gastrointestinal cancers. Gastroenterology. 2012;142(2):219–232. doi: 10.1053/j.gastro.2011.12.001. [DOI] [PMC free article] [PubMed] [Google Scholar]
- 38.MacDonald BT, Tamai K, He X. Wnt/beta-catenin signaling: components, mechanisms, and diseases. Dev Cell. 2009;17(1):9–26. doi: 10.1016/j.devcel.2009.06.016. [DOI] [PMC free article] [PubMed] [Google Scholar]
- 39.Di Cristofano A, Pandolfi PP. The multiple roles of PTEN in tumor suppression. Cell. 2000;100(4):387–390. doi: 10.1016/s0092-8674(00)80674-1. [DOI] [PubMed] [Google Scholar]
- 40.Waite KA, Eng C. Protean PTEN: form and function. Am J Hum Genet. 2002;70(4):829–844. doi: 10.1086/340026. [DOI] [PMC free article] [PubMed] [Google Scholar]
- 41.Chalhoub N, Baker SJ. PTEN and the PI3-kinase pathway in cancer. Annu Rev Pathol. 2009;4:127–150. doi: 10.1146/annurev.pathol.4.110807.092311. [DOI] [PMC free article] [PubMed] [Google Scholar]
- 42.Wang H, Chen P, Liu XX, et al. Prognostic impact of gastrointestinal bleeding and expression of PTEN and Ki-67 on primary gastrointestinal stromal tumors. World J Surg Oncol. 2014;12:89. doi: 10.1186/1477-7819-12-89. [DOI] [PMC free article] [PubMed] [Google Scholar]
- 43.Tang H, Yao L, Tao X, et al. miR-9 functions as a tumor suppressor in ovarian serous carcinoma by targeting TLN1. Int J Mol Med. 2013;32(2):381–388. doi: 10.3892/ijmm.2013.1400. [DOI] [PubMed] [Google Scholar]
- 44.Sakamoto S, McCann RO, Dhir R, Kyprianou N. Talin1 promotes tumor invasion and metastasis via focal adhesion signaling and anoikis resistance. Cancer Res. 2010;70(5):1885–1895. doi: 10.1158/0008-5472.CAN-09-2833. [DOI] [PMC free article] [PubMed] [Google Scholar]
- 45.Sommers CL, Byers SW, Thompson EW, Torri JA, Gelmann EP. Differentiation state and invasiveness of human breast cancer cell lines. Breast Cancer Res Treat. 1994;31(2–3):325–335. doi: 10.1007/BF00666165. [DOI] [PubMed] [Google Scholar]
- 46.Zhu H, Lu J, Wang X, et al. Upregulated ZO-1 correlates with favorable survival of gastrointestinal stromal tumor. Med Oncol. 2013;30(3):631. doi: 10.1007/s12032-013-0631-7. [DOI] [PubMed] [Google Scholar]
- 47.Doi Y, Yashiro M, Yamada N, Amano R, Noda S, Hirakawa K. VEGF-A/VEGFR-2 signaling plays an important role for the motility of pancreas cancer cells. Ann Surg Oncol. 2012;19(8):2733–2743. doi: 10.1245/s10434-011-2181-6. [DOI] [PubMed] [Google Scholar]
- 48.Walsh N, Clynes M, Crown J, O’Donovan N. Alterations in integrin expression modulates invasion of pancreatic cancer cells. J Exp Clin Cancer Res. 2009;28:140. doi: 10.1186/1756-9966-28-140. [DOI] [PMC free article] [PubMed] [Google Scholar]
- 49.Sena P, Mariani F, Marzona L, et al. Matrix metalloproteinases 15 and 19 are stromal regulators of colorectal cancer development from the early stages. Int J Oncol. 2012;41(1):260–266. doi: 10.3892/ijo.2012.1441. [DOI] [PubMed] [Google Scholar]
- 50.Wu Y, Zhou BP. Snail: more than EMT. Cell Adh Migr. 2010;4(2):199–203. doi: 10.4161/cam.4.2.10943. [DOI] [PMC free article] [PubMed] [Google Scholar]
- 51.Fan F, Samuel S, Evans KW, et al. Overexpression of snail induces epithelial-mesenchymal transition and a cancer stem cell-like phenotype in human colorectal cancer cells. Cancer Med. 2012;1(1):5–16. doi: 10.1002/cam4.4. [DOI] [PMC free article] [PubMed] [Google Scholar]
- 52.Hotz B, Arndt M, Dullat S, Bhargava S, Buhr HJ, Hotz HG. Epithelial to mesenchymal transition: expression of the regulators snail, slug, and twist in pancreatic cancer. Clin Cancer Res. 2007;13(16):4769–4776. doi: 10.1158/1078-0432.CCR-06-2926. [DOI] [PubMed] [Google Scholar]
- 53.von Burstin J, Eser S, Paul MC, et al. E-cadherin regulates metastasis of pancreatic cancer in vivo and is suppressed by a SNAIL/HDAC1/HDAC2 repressor complex. Gastroenterology. 2009;137(1):e361–e365. doi: 10.1053/j.gastro.2009.04.004. [DOI] [PubMed] [Google Scholar]
- 54.Shin NR, Jeong EH, Choi CI, et al. Overexpression of snail is associated with lymph node metastasis and poor prognosis in patients with gastric cancer. BMC Cancer. 2012;12:521. doi: 10.1186/1471-2407-12-521. [DOI] [PMC free article] [PubMed] [Google Scholar]
- 55.Kuo KT, Chou TY, Hsu HS, Chen WL, Wang LS. Prognostic significance of NBS1 and snail expression in esophageal squamous cell carcinoma. Ann Surg Oncol. 2012;19(suppl 3):S549–S557. doi: 10.1245/s10434-011-2043-2. [DOI] [PubMed] [Google Scholar]
- 56.van Nes JG, de Kruijf EM, Putter H, et al. Co-expression of SNAIL and TWIST determines prognosis in estrogen receptor-positive early breast cancer patients. Breast Cancer Res Treat. 2012;133(1):49–59. doi: 10.1007/s10549-011-1684-y. [DOI] [PubMed] [Google Scholar]
- 57.Wu Y, Zhou BP. New insights of epithelial-mesenchymal transition in cancer metastasis. Chin J Biochem Biophys. 2008;40(7):643–650. doi: 10.1111/j.1745-7270.2008.00443.x. [DOI] [PMC free article] [PubMed] [Google Scholar]
- 58.Friess H, Yamanaka Y, Büchler M, et al. Enhanced expression of transforming growth factor beta isoforms in pancreatic cancer correlates with decreased survival. Gastroenterology. 1993;105(6):1846–1856. doi: 10.1016/0016-5085(93)91084-u. [DOI] [PubMed] [Google Scholar]
- 59.Rowland-Goldsmith MA, Maruyama H, Kusama T, Ralli S, Korc M. Soluble type II transforming growth factor-beta (TGF-beta) receptor inhibits TGF-beta signaling in COLO-357 pancreatic cancer cells in vitro and attenuates tumor formation. Clin Cancer Res. 2001;7(9):2931–2940. [PubMed] [Google Scholar]
- 60.Melisi D, Ishiyama S, Sclabas GM, et al. LY2109761, a novel transforming growth factor beta receptor type I and type II dual inhibitor, as a therapeutic approach to suppressing pancreatic cancer metastasis. Mol Cancer Ther. 2008;7(4):829–840. doi: 10.1158/1535-7163.MCT-07-0337. [DOI] [PMC free article] [PubMed] [Google Scholar]
- 61.Misra S, Sharma S, Agarwal A, et al. Cell cycle-dependent regulation of the bi-directional overlapping promoter of human BRCA2/ZAR2 genes in breast cancer cells. Mol Cancer. 2010;9:50. doi: 10.1186/1476-4598-9-50. [DOI] [PMC free article] [PubMed] [Google Scholar]
- 62.Lu H, Yue J, Meng X, Nickoloff JA, Shen Z. BCCIP regulates homologous recombination by distinct domains and suppresses spontaneous DNA damage. Nucleic Acids Res. 2007;35(21):7160–7170. doi: 10.1093/nar/gkm732. [DOI] [PMC free article] [PubMed] [Google Scholar]
- 63.Liu X, Cao L, Ni J, et al. Differential BCCIP gene expression in primary human ovarian cancer, renal cell carcinoma and colorectal cancer tissues. Int J Oncol. 2013;43(6):1925–1934. doi: 10.3892/ijo.2013.2124. [DOI] [PubMed] [Google Scholar]
- 64.Huang YY, Dai L, Gaines D, et al. BCCIP suppresses tumor initiation but is required for tumor progression. Cancer Res. 2013;73(23):7122–7133. doi: 10.1158/0008-5472.CAN-13-1766. [DOI] [PMC free article] [PubMed] [Google Scholar]
- 65.Cui X, Yu L, Wang Y, et al. The relationship between cyclin G1 and survival in patients treated surgically for HCC. Hepatogastroenterology. 2013;60(121):153–159. doi: 10.5754/hge12549. [DOI] [PubMed] [Google Scholar]
- 66.Wen W, Ding J, Sun W, et al. Cyclin G1-mediated epithelial-mesenchymal transition via phosphoinositide 3-kinase/Akt signaling facilitates liver cancer progression. Hepatology. 2012;55(6):1787–1798. doi: 10.1002/hep.25596. [DOI] [PubMed] [Google Scholar]
- 67.Li J, Muscarella P, Joo SH, et al. Dissection of CDK4-binding and transactivation activities of p34(SEI-1) and comparison between functions of p34(SEI-1) and p16(INK4A) Biochemistry. 2005;44(40):13246–13256. doi: 10.1021/bi0504658. [DOI] [PubMed] [Google Scholar]
- 68.Tang DJ, Hu L, Xie D, et al. Oncogenic transformation by SEI-1 is associated with chromosomal instability. Cancer Res. 2005;65(15):6504–6508. doi: 10.1158/0008-5472.CAN-05-0351. [DOI] [PubMed] [Google Scholar]
- 69.van Dekken H, Alers JC, Riegman PH, Rosenberg C, Tilanus HW, Vissers K. Molecular cytogenetic evaluation of gastric cardia adenocarcinoma and precursor lesions. Am J Pathol. 2001;158(6):1961–1967. doi: 10.1016/S0002-9440(10)64666-4. [DOI] [PMC free article] [PubMed] [Google Scholar]
- 70.Tang TC, Sham JS, Xie D, et al. Identification of a candidate oncogene SEI-1 within a minimal amplified region at 19q13.1 in ovarian cancer cell lines. Cancer Res. 2002;62(24):7157–7161. [PubMed] [Google Scholar]
- 71.Hsu SI, Yang CM, Sim KG, Hentschel DM, O’Leary E, Bonventre JV. TRIP-Br: a novel family of PHD zinc finger- and bromodomain-interacting proteins that regulate the transcriptional activity of E2F-1/DP-1. EMBO J. 2001;20(9):2273–2285. doi: 10.1093/emboj/20.9.2273. [DOI] [PMC free article] [PubMed] [Google Scholar]
- 72.Sugimoto M, Nakamura T, Ohtani N, et al. Regulation of CDK4 activity by a novel CDK4-binding protein, p34(SEI-1) Genes Dev. 1999;13(22):3027–3033. doi: 10.1101/gad.13.22.3027. [DOI] [PMC free article] [PubMed] [Google Scholar]
- 73.Hong SW, Kim CJ, Park WS, et al. p34SEI-1 inhibits apoptosis through the stabilization of the X-linked inhibitor of apoptosis protein: p34SEI-1 as a novel target for anti-breast cancer strategies. Cancer Res. 2009;69(3):741–746. doi: 10.1158/0008-5472.CAN-08-1189. [DOI] [PubMed] [Google Scholar]