Abstract
The recent dramatic rise in U.S. income inequality has prompted a great deal of research on trends in overall family income and changes in sources of family income, especially among the highest income earners. However, less is known about changes in sources of income among the bottom 99% or about racial/ethnic differences in those trends. The present research contributes to the literatures on income trends and racial economic inequality by using family-level data from the 1988–2009 Current Population Survey to examine changes in overall family income and the proportion of income coming from employment, property/assets, and transfers across five different levels of family income for white-, black, and Hispanic-headed families. We find that at all income levels above the 25th percentile, employment income is by far the largest contributor to family income for all racial/ethnic groups. Employment income trended upward over the period in both real dollars and as a percentage of total family income. In this respect, white, black and Hispanic families are remarkably similar. The racial gap in total family income has remained fairly stable over the period, but this trend conceals a narrowing of racial differences in property income, mostly as a function of the decline in property income among whites, a widening of racial differences in transfer income among the bottom 25%, and a widening of racial differences in employment income, particularly at the top of the family income distribution. Income accrued from wealth is a very small component of overall family income for all three racial groups, even for the highest-income families (top 1%).
Keywords: Inequality, income, family income, income quartiles, race/ethnicity, income distribution, property income
Introduction
Stratification and inequality scholars have long studied the economic disadvantages faced by racial and ethnic minorities, with considerable attention paid to explanations for labor market earnings disparities between whites and other racial groups (Card and Kruger 1992; Farkas et al. 1997; Farkas and Vicknair 1996; Kaufman 1983; Maxwell 1994; Neal and Johnson 1996; O’Neill 1990; Taeuber et al. 1966; Tomaskovic-Devey 1993). Throughout the late 1990s, there was a shift in the sociological literature toward examining wealth as a measure of long-term economic security and on the racial wealth gap as a fundamental cause of racial inequality (Keister 2000; Oliver and Shapiro 1995; Shapiro 2004; Wolff 2001, 2002). Indeed, recent reports by the Pew Research Center (Taylor et al. 2011) and the Institute on Assets and Social Policy (Shapiro et al. 2010) highlight the widening racial wealth gap in the U.S. Since the start of the global economic recession, however, stratification scholars and members of the media have refocused their attention on income inequality as a problem that has major implications for long-term social, material, and physical well-being and U.S. sustainability (Andrews, Jencks, and Leigh 2011; Kondo et al. 2009; McCall and Percheski 2010;). Indeed, the Occupy Wall Street “We are the 99%” Movement highlights the growing interest and attention paid to issues related to income inequality in the United States.
Although previous studies have focused on changes in overall family income over the past three decades (Gottschalk and Danziger 2005; Shaw and Stone 2010), changes in the distribution of various sources of family income, particularly over the past 10 years (Leigh 2009; Picketty and Saez 2006; Raffalovich, Monnat, and Tsao 2009), and changes in income among CEOs and other top earners (Atkinson and Picketty 2007; Burkhauser et al. 2009; DiPrete, Eirich, and Pittinsky 2010; Jensen et al. 2004; Kaplan and Rauh 2010), this study is the first to provide a descriptive analysis of trends in family income and sources of that income by race/ethnicity across families at multiple levels of income.
It is clear from previous research that blacks and Hispanics earn lower incomes and possess substantially less income-producing wealth than whites (Blau and Graham 1990; Conley 1999; DeNavas-Walt et al. 2011; Gittleman and Wolff 2004; Oliver and Shapiro 1995; Shapiro 2011; Taylor et al. 2011; Wolff 2010). Despite the plethora of research on the racial wealth gap, however, we know little about how the income distribution for different racial/ethnic groups, and particularly how the distribution of sources of family income across those groups, has changed over the past two decades. Accordingly, in this paper, we investigate racial differences in the distribution and sources of family income for non-Hispanic white-, non-Hispanic black-, and Hispanic-headed families from 1988 to 2009. We are specifically interested in the extent to which racial gaps in employment, property, and transfer income have changed over time and how these racial differences vary across different levels of family income. We also present the demographic and labor market characteristics of families across four income quartiles and the top 1% to determine whether these characteristics vary by race/ethnicity across the income groups. By so doing, we intend to contribute to the literature on racial economic inequality in general and to enhance our understanding of trends in racial inequality across a range of income groups and across three different sources of income in particular.
Trends in Family Income and Income Sources
The early 1970s marked the beginning of a rise in inequality in the distribution of family income in the U.S., representing a reversal of a long period of declining inequality during the first part of the 20th century (Lindert 2000; Morris and Western 1999). U.S. income inequality is currently at an all-time high (Saez 2010). As shown in Table 1, in 2006, the top 1% of households received 21.3% of all income, while the bottom 80% received 38.6% of all income. Saez (2010) indicates that a substantial proportion of the increase in top incomes over the last 30 years has been an explosion in top wages and salaries. His research suggests that most top income earners do not derive their incomes from past wealth but are currently “working rich” – highly paid employees or new business owners who have not yet accumulated vast financial wealth. Distinguishing between wealth and income is important because wealth is composed of assets that can be converted into cash and can be used as a safety net during times of economic need. Income, on the other hand, represents a short-term capacity to acquire goods and services (Shapiro 2004). Wealth and income are jointly determined and very strongly associated because income that is saved and/or invested can become a source of wealth, and wealth can become a source of income over and above a wage and salary job. Families with greater income have the potential to amass more wealth, and families with more assets have the potential to earn more income from those assets (Wolff 2002; Keister 2000).
Table 1.
Distribution of Income in the United States, 1988–2006
| Top 1% | Top 20% | Bottom 80% | |
|---|---|---|---|
| 1988 | 16.6 | 55.6 | 44.5 |
| 1991 | 15.7 | 56.4 | 43.7 |
| 1994 | 14.4 | 55.1 | 44.9 |
| 1997 | 16.6 | 56.2 | 43.8 |
| 2000 | 20.0 | 58.6 | 41.4 |
| 2003 | 17.0 | 57.9 | 42.2 |
| 2006 | 21.3 | 61.4 | 38.5 |
Data are from Wolff (2010)
In addition to more general research on trends in the family income distribution, a number of researchers have examined the racial earnings gaps, particularly between blacks and whites, with divergent findings about whether the gap has increased (Cancio et al. 1996; Grodsky and Pager 2001) or decreased (Morgan and McKerrow 2004; Semyonov and Lewin-Epstein 2009) over time. Explanations for the racial earnings gap have typically gone in three broad directions. The first approach emphasizes the importance of human capital attributes, such as education, in determining earnings (Farkas et al. 1997; Farkas and Vicknair 1996; Fossett 1984; Neal and Johnson 1996; Semyonov et al. 2000). From this perspective, the racial employment earnings gap is a function of differences in human capital attributes or in the ability to transfer those attributes into economic outcomes. The second approach to explaining the racial earnings gap focuses on occupational segregation, suggesting that blacks and Hispanics are disproportionately clustered in low status, low skill, and low paying occupations and that the entrance of large numbers of blacks and Hispanics into these occupations tends to drive down wages of all workers in such occupations (Huffman 2004; Huffman and Cohen 2004; Kaufman 1983, 2002; Tomaskovic-Devey 1993). The third approach considers the possibility that racial earnings disparities increase with the status or level of occupational labor markets and the social class hierarchy. That research finds that the racial wage gap is greater in the private sector vs. public sector (Semyoniv and Lewin-Epstein 2009), is the highest among those with the highest levels of education (Tomaskovic-Devey et al. 2005), and increases as workers move up the earnings hierarchy (Grodky and Pager 2001; Huffman 2004; Morgan and McKerrow 2004; Pais 2011). Those occupations at the top of the income ladder tend to be client-based, such as management, finance, lawyers, and physicians. These occupations depend more strongly on social networks for success rather than the production of labor required by many lower status occupations (Grodsky and Pager 2001).
Although the purpose of the present research was not to test the ability of these theories to explain trends in racial differences in the family income distribution and sources of income, we do borrow from the third approach in structuring our analysis. That is, because wage growth has occurred most dramatically in private sector and high-paying occupations such as management and finance, and because the racial earnings gap has been found to be the highest in these occupations, we expect the racial employment income gap to increase with rising levels of the income distribution. We also anticipate that the racial gap in income from employment among the top earners has increased over time, largely as a function of more rapidly rising employment income among the highest earning whites, rather than a reduction in incomes among the highest earning blacks and Hispanics.
However, rather than focusing explicitly on income from labor market earnings, Spilerman (2000) suggests that we should focus on consumption potential – the ability of families to attain a certain standard of living, economic security, and protection from poverty through total family economic resources and not just wage and salary income. In addition to earnings from employment, consumption potential is affected by income from property and other assets, as well as from transfer income. In terms of property, a great deal of research on racial wealth inequality has focused on disparities in homeownership (Bocian et al. 2010; Bricker et al. 2011; Oliver and Shapiro 1995; Taylor et al. 2011; Wolff 2010). U.S. homeownership rates are the highest for whites (74%) and lowest for Hispanics (47%) and blacks (46%) (Bricker et al. 2011). Homeownership provides many advantages, including acting as a source of consumption in the form of home equity that can be turned into cash to invest in other assets, provide for children’s higher education, and provide protection against periods of unemployment, sickness, or family break-up (Wolff 2010). In contrast to income earning assets, however, home ownership does not provide a flow of additional income. Indeed, it is financial wealth – income producing assets (stocks, bonds, businesses, and commercial real estate) that create economic independence from the labor market, autonomy, and power. Financial wealth allows more liquidity than homeownership since it can be converted to cash in the short term and be used for consumption or investment.
There is tremendous racial inequality in opportunities for the acquisition of income producing assets in the U.S. (Kennickell 2003). For example, while more than 80% of whites own interest-earning assets at financial institutions, only 60% of black and Hispanic families own these financial assets (Taylor et al. 2011). Blacks’ history of slavery, discrimination in employment, extremely high levels of residential segregation, and high-cost home mortgages have all served to create and maintain inequality in the distribution of home ownership and the ownership of other assets (Shapiro 2004; Shapiro et al. 2010). Further, the bursting of the housing market bubble and ensuing economic recession hit Hispanics especially hard since they were more likely to live in southwestern states that took the brunt of the housing crisis (Bocian et al. 2010). Indeed, between 2005 and 2009, median wealth of black and Hispanic families fell by 53% and 66% respectively, while median wealth among white families fell by only 16% (Taylor et al. 2011). Disparities in financial wealth are heavily determined by the performance of the U.S. stock market. The stock market experienced tremendous fluctuations over the past two decades. U.S. stock prices rose steadily from 1990 to 2000. However, the market experienced two episodes of loss over the past decade. The first lasted from 2000 to 2002, when the S&P 500 index dropped 46% over the two year period. The second coincided with the subprime lending crisis and housing downturn. From October 2007 to February 2009, the S&P 500 index lost 53% of its value (Taylor et al. 2011). Accordingly, we should expect to see a smaller proportion of family income coming from property (income earning assets) over these time periods. Given the well-documented history of racial disparities in wealth, we should expect to see whites maintain a consistent advantage over blacks and Hispanics in property income across all income levels, but given that whites are more likely to possess income earning assets than blacks and Hispanics, we should also see the racial gaps in property income decline since 2007 as a result of reductions in property income among whites.
Finally, the role of transfer income (social security, retirement, public assistance, etc.) on the family income distribution has not been well studied, except in the context of poverty. For example, research on the transition from Aid to Families with Dependent Children (AFDC) to Temporary Assistance for Needy Families (TANF), the largest public cash assistance program for low-income families with children in the U.S., suggests that caseloads have declined since TANF’s inception, TANF benefits have not kept pace with inflation, are not enough to meet low-income families’ basic needs, and have not been effective in moving families out of poverty (Schott and Finch 2010; Zedlewski and Golden 2010). Accordingly, TANF now represents a much smaller proportion of total transfer income than in the past, even among the lowest income families. Previous research indicates that black and Hispanic families have been disproportionately disadvantaged by the transition from AFDC to TANF, especially during the recent economic recession when many states cut TANF benefits despite high unemployment and unprecedented need (Schott and Pavetti 2011). Low income women of color are often considered to be the most difficult to employ due to low educational levels, limited work experience, lack of transportation, childcare difficulties, and unstable housing (Loprest et al. 2007; Zedlewski, Holcomb, and Loprest 2007). Single mothers are disproportionately represented on the TANF roles. Considering that approximately one-half of all black households and the majority of the bottom 75% of black families are headed by women (McLanahan and Percheski 2008), the disadvantaged status of black women in the U.S. labor market is an important predictor of and major force behind trends in transfer income over the past two decades.
Stricter regulations that came along with the Welfare Reform Act of 1996, including time limits, work requirements, family caps, and sanctions means that more families are timing-out of benefits and often lose their benefits due to violations of work and other behavioral requirements (Chang et al. 2011; Keiser et al. 2004; Monnat 2010). Although public assistance was once an important source of income for the lowest income families, a larger proportion of income among the lowest income families now comes from social security, retirement, and unemployment compensation. The aging baby-boomer population means that more workers are relying on retirement and social security income. Regardless of whether racial disparities in the labor market are a function of human capital, occupational segregation, or a labor market hierarchy, the disadvantaged position of blacks and Hispanics in the labor market functions as a sort of cumulative disadvantage over time, as not only are their current wages impacted by racial inequality in the labor market, but the amount of social security and retirement income they earn in their post-employment years is also affected. Because whites are more likely to secure employment with retirement benefits and have more stable and long-term employment histories (Hendley and Bilimoria 1999), it is likely that the racial gap in transfer income has increased over time among the lowest income families.
In what follows, we investigate the distribution of family income by income source and the demographic characteristics of families within the four income quartiles and the top 1% of family income in the U.S. separately by race/ethnicity for the period 1988–2009. We pay particular attention to the roles of employment income, income producing assets, and income transfers on these trends. Based on the literature cited above, we anticipate that the percentage of families earning most or all of their income from employment, rather than from property, has increased over time and that the racial gap in employment income is greatest at the highest income levels. We also expect that among the top income families, the racial gap in property income has decreased, largely as a function of decreases in the income-producing assets of whites rather than an increase in the assets held by black and Hispanic families. Finally, we anticipate that at the bottom of the income hierarchy, where families are most likely to rely on income transfers to make ends meet, we will see a widening of the racial income gap, particularly since the late 1990s when Welfare Reform went into effect.
Data and Methods
The data for this study come from the 1988–2009 Current Population Survey (CPS) Annual Demographic Files. The CPS is a monthly household survey conducted by the Census Bureau and Bureau of Labor Statistics to collect information on economic, social and demographic characteristics of individuals, families and households in the U.S. All heads of household are asked to report their total family income and sources of income from the prior year. Thus, the actual reported values represent incomes from 1987 to 2008. We extracted family-level income data for non-Hispanic white, non-Hispanic black, and Hispanic headed families who reported positive family income for each of the 22 years – the only years for which detailed sources of family income were available. We kept all families where the head of household was aged 18 or older. Unlike in a previous study that examined family income inequality using CPS data (Gottschalk and Danzinger 2005), we did not exclude families where the household head was over the age of 62 because we were explicitly interested in examining trends in the sources of family income. Property income and transfer income continue to accrue even after attachments to the labor force have ended. It was important that we include those families that may be relying on income from one of these sources. Excluding these families would especially skew the earnings description and characteristics of the bottom quartile (bottom 25%), who rely on a substantial proportion of their incomes from retirement and social security.
For each year, separately by race, we aggregated families into five family income quartiles: family income below the 25th percentile, between the 25th and 50th percentiles, between the 50th and 75th percentiles, between the 75th and 99th percentiles, and at or above the 99th percentile. For each group, we calculated the median income from each income source. Detailed income sources were aggregated into five broad categories: Employment (wages and salaries), Self-employment (income from self-employment and farming), Property (dividends, interest and rents), Transfer (social security, unemployment compensation, retirement, public assistance and welfare, financial assistance from friends or relatives, alimony, child-support, disability, workers’ compensation, educational assistance, supplemental security, and survivor benefits), and Other (specific source not identified). Median family income for the self-employment and “other” categories was $0 for all groups across all years in the study period, so we do not provide graphics or a discussion about those income sources in this paper. We did not include the Earned Income Tax Credit (EITC) in any of the sources of income because the documentation indicates that the value is only an estimate of what the family would be eligible to receive, not a value of actual receipt. The EITC is available to low-to-middle income employed parents who have at least one qualifying child and who file a joint or “head of household” return. As noted by Scholz (1993), it is difficult to accurately determine tax-filing status using family-based data like the CPS. In addition, it is impossible to know from these data which respondents were eligible nonparticipants or ineligible participants in the program. The implications of excluding the EITC from our analysis are described toward the end of the paper. In addition, transfer income does not account for non-cash transfers, such as the Supplemental Nutrition Assistance Program (SNAP), public housing or rent subsidies, subsidies for child care, or other non-cash benefits. Income is expressed in constant 2009 dollars, and all analyses are weighted using the CPS family weight. The total sample size is 1,367,984 families; 78.4% of families are headed by non-Hispanic whites, 12.3% are headed by non-Hispanic blacks, and the remaining 9.3% are headed by Hispanics.
Results
Overall median family income has trended upward since 1988, dipping to a low of $42,383 in 1994 and peaking at a high of $49,406 in 2001, as shown in Figure 1. However, this overall median masks substantial and consistent racial disparities in the family income distribution, as demonstrated in Figure 2. While the median for white families has hovered right around $50,000, the range for black families has been between about $26,000 and $32,000. The median income for Hispanic families has ranged between about $30,000 and $35,000. The trends for white, black and Hispanic families have been very similar over the 22 year period, consistently rising from 1996 to 2002, dropping in 2003 and then fluctuating with slight increases and decreases through 2009.
Figure 1.
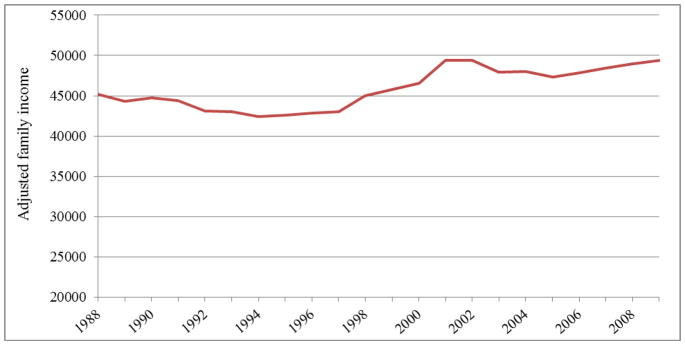
Median Family Income, 1988–2009
Figure 2.
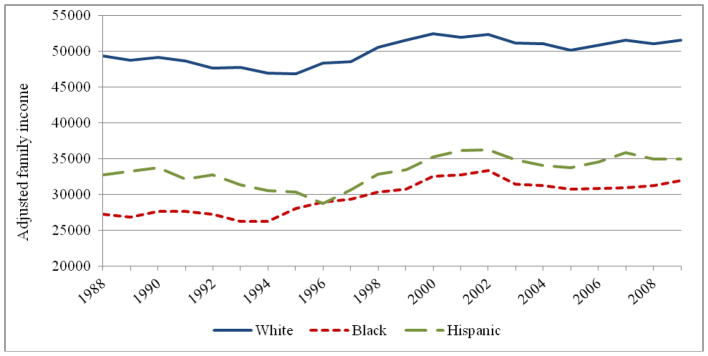
Median Family Income by Race/Ethnicity, 1988–2009
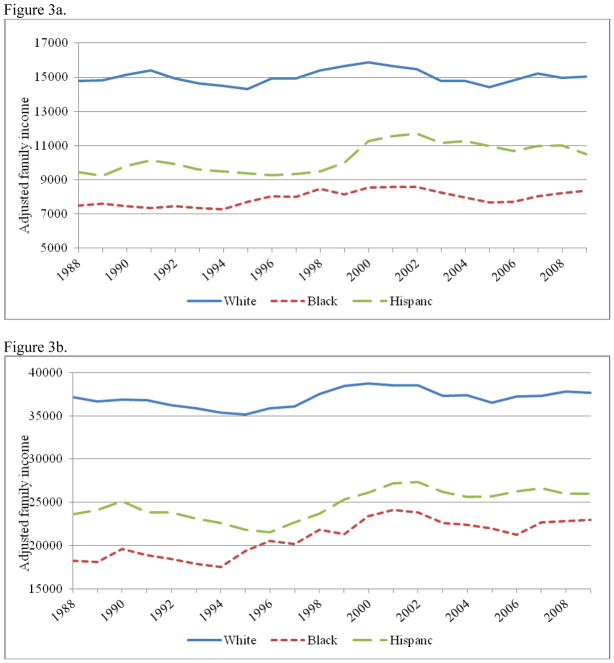
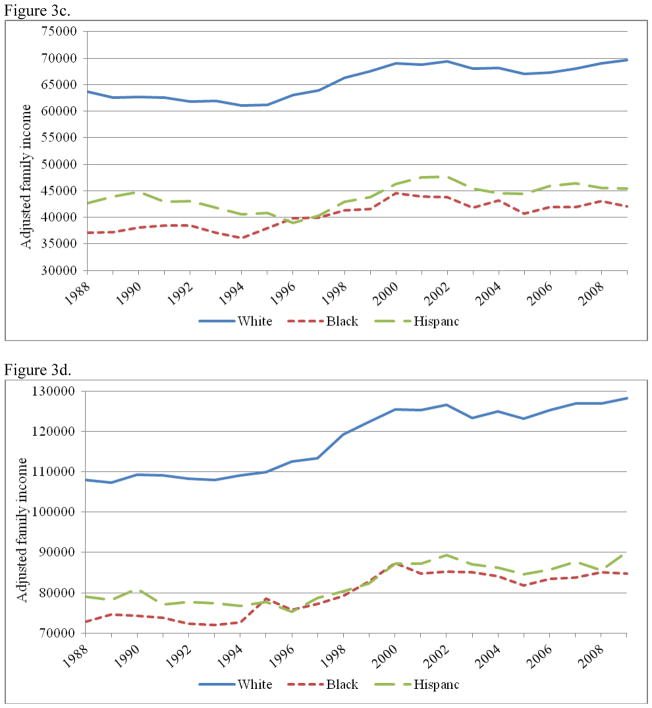
Figures 3a–3e display trends in median family income by race for each of the five quartile groups. Among families below the 25th percentile of family income in their racial group, white-headed families have seen almost no change in median income from 1988 to 2009, while the median incomes of the 0–25th percentiles of black- and Hispanic-headed families have increased slightly over this period. This has resulted in a very slight narrowing of the white-black and white-Hispanic gap in median family income among families at the bottom of the income hierarchy.
Figure 3.
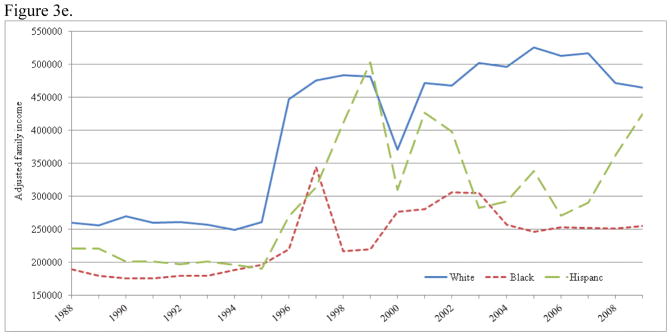
Figure 3a. Median Family Income by Race/Ethnicity for Q1
Figure 3b. Median Family Income by Race/Ethnicity for Q2
Figure 3c. Median Family Income by Race/Ethnicity for Q3
Figure 3d. Median Family Income by Race/Ethnicity for Q4
Figure 3e. Median Family Income by Race/Ethnicity for Top 1%1
1In 1996, the CPS changes some aspects of its sampling procedures, but this discontinuity in family income from 1995 to 1996 remains after adjustment for sampling proportions using the family weight included with the data. The fluctuations from the mid-1990s thru 2000s are consistent with findings from Saez (2010).
The story is very similar for families between the 25th and 50th percentiles of family income (Figure 3b). While families in the 25th–50th percentile of white family income now earn almost exactly what they earned in 1988, the incomes of black and Hispanic families in their respective quartiles have trended upward, from about $18,000–23,000 for black families and from about $24,000–26,000 for Hispanic families. This has helped to slightly narrow the racial gap between white-headed families and families headed by blacks and Hispanics. However, at $14,680 (white-black gap) and $11,680 (white-Hispanic gap) the racial disparities in income among families who fall into the second quartile of family income in their respective racial groups remain quite large.
Among families in the third quartile of family income (Figure 3c), the racial gaps have fluctuated over time. For example, in 1988, the white-black gap was $26,543 but had decreased to an all-time low of 23,250 by 1999. The white-Hispanic gap began at $20,907 in 1988 and decreased to an all-time low of $17,898. However, median incomes for all groups, but especially for white- and black-headed families, have increased within the 3rd quartile. Families falling within the third quartile of white family income recorded their highest median earnings in 2009. As a result, both the white-black and white-Hispanic family income gaps were at their highest in 2009 at $27,508 and $24,206, respectively.
Unlike with the lower income quartiles, families in the 75th–99th percentile of family income in each of the three racial groups experienced pronounced increases in median family income over the study period, although the increases for black and Hispanic families were much lower than that for white families, as demonstrated in Figure 3d. The median income of white-headed families increased just over $20,000 since 1988, while the medians for black and Hispanic families increased by about $12,000 and $11,000 respectively. These differences in the amount of increase have resulted in a widening of the racial income gaps – about a 23% increase in the white-black gap and a 32% increase in the white-Hispanic gap from 1988 to 2009.
As shown in Figure 3e, median family incomes for the top 1% of white families skyrocketed over the study period, and by 2009, the median of the top earning white families was nearly 3 times that of white families in the 75th–99th percentile group. While the median for the top 1% of black families has also increased over the period, these increases have been less pronounced. The top 1% of black-headed families now earn about twice as much as those in the quartile directly below. The gap in median family income between the top 1% of white- and black-headed families was over $200,000 by 2009 – an increase of $130,000 since 1988. Income for top 1% of Hispanic-headed families has also increased since 1988, but due to the small Hispanic sample size (just over 100 Hispanics in the top 1% of their racial group in 2009), the erratic increases and decreases should be interpreted with caution.
Variation in Income Sources
Employment Income
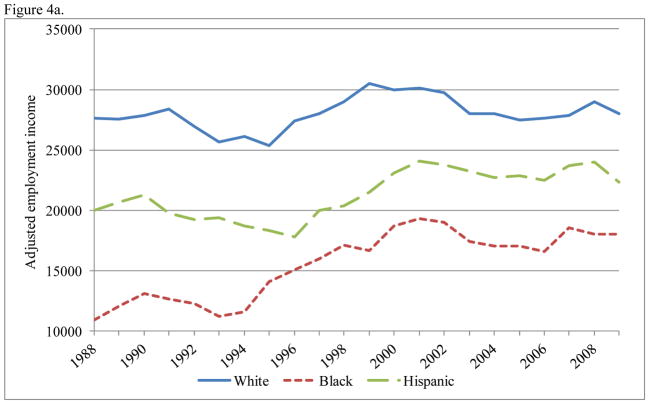
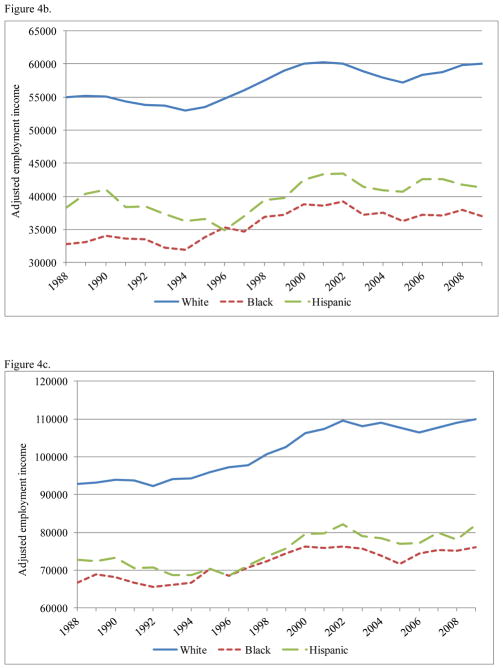
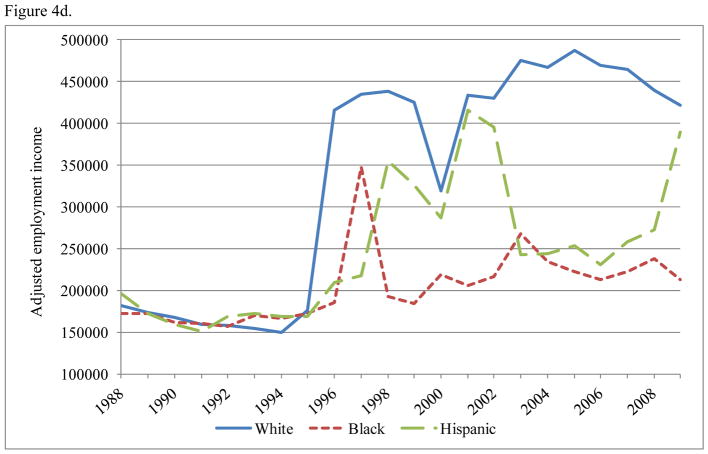
The trends in median income coming from employment (wage and salary income) are nearly identical to the overall family income trends (See Figures 4a–4d). With the exception of families below the 25th percentile of family income (who had median employment incomes of $0 across the study period)1 and white families in the second quartile (whose median employment earnings in 2009 were the same as those for 1988), the median employment income for all racial groups in all quartiles increased between 1988 and 2009. White families consistently had higher median employment income than black and Hispanic families across all income quartiles, and Hispanic families out-earned black families in nearly all years within each of the income groups. While the racial gaps in employment income narrowed over time among families in the second quartile, racial gaps in employment income increased among families within the third and fourth quartiles. Employment income for the top 1% has surged since the mid-1990s, with the widest racial gaps occurring throughout the mid-to-late 2000s.
Figure 4.
Figure 4a. Median Employment Income by Race/Ethnicity for Q2
Figure 4b. Median Employment Income by Race/Ethnicity for Q3
Figure 4c. Median Employment Income by Race/Ethnicity for Q4
Figure 4d. Median Employment Income by Race/Ethnicity for Top 1%
Transfer Income
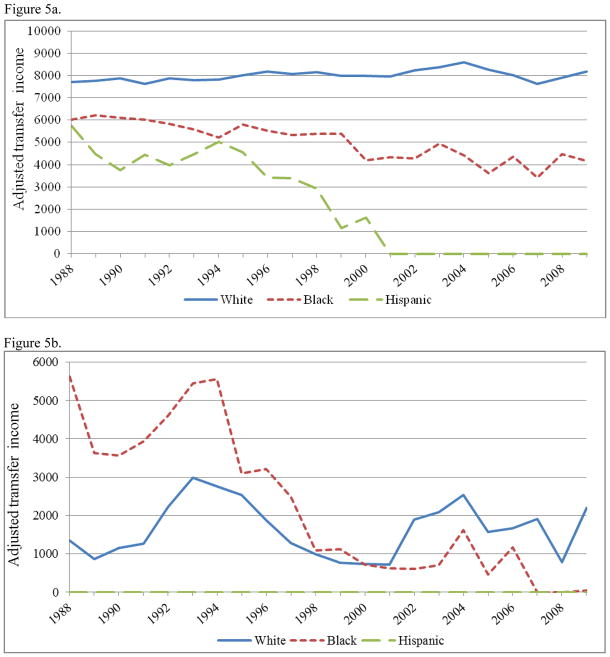
Only families within the bottom two quartiles of family income had non-zero median income from transfers over the student period. Figures 5a and 5b show that median income from transfers for white families below the 25th percentile of family income remained consistent at around $8,000 between 1988 and 20092. However, median transfer income for the first quartile of black and Hispanic families and the second quartile of black families declined over the study period. Median transfer income within the first quartile of Hispanic families was highest at the start of the study period (1988) and fell to $0 by 2001. The median of the second quartile of Hispanic families was also $0 for the entire period. While median transfer income for the second quartile of black families declined from a high of close to $6,000 in 1988 to $0 over the last three years, median transfer income for the second quartile of white families increased from 1988 to 1993, declined from 1993 to 2001, increased again until 2004 and now hovers around $2,000. It is important to note that transfer income excludes non-cash transfer programs, such as the Supplemental Nutrition Assistance Program (SNAP), which often provides food assistance to poor families and low-income families who do not meet the participation criteria for cash welfare benefit programs like Temporary Assistance for Needy Families (TANF).
Figure 5.
Figure 5a. Median Transfer Income by Race/Ethnicity for Q1
Figure 5b. Median Transfer Income by Race/Ethnicity for Q2
Supplemental analysis (not shown, but available upon request) revealed that the majority of transfer income for these two bottom quartile groups comes from social security income (60% within Q1 and 46% in Q2 in 2009). It is also noteworthy that the percentage of transfer income coming from public assistance and welfare declined over the study period from 11.3% in 1988, to 9.3% in 1996 (prior to the enactment of Welfare Reform) to 3.7% in 2009 within the lowest income quartile (Q1). Conversely, the percentage of total transfer income coming from supplemental security income (SSI) within Q1 increased over the study period, from 5.6% in 1988 to 6.7% in 1996 to 9.8% in 2009. Similar trends were found for families in the second quartile, but both public assistance and SSI represented much smaller percentages of total transfer income for those families, while retirement income was a more prominent component in Q2 (around 15% for the entire period).
Property Income
As demonstrated in Figures 6a and 6b, only those families in the top 25% of the family income distribution of their racial group had any measurable income from property (stock dividends, investment interests and rents)3. While median property income for the 75th–99th percentiles of black and Hispanic families hovered near $0 over the 22 year period, the median property income for the 75th–99th percentile of white families peaked at $2,500 in 2000 and was at an all-time low of $670 by 2009.4 The racial gaps in property income declined dramatically from 2000 to 2002 (the period marking a major S&P 500 decline) and again from 2008 to 2009 (the period marking the stock market decline coinciding with the Great Recession).
Figure 6.
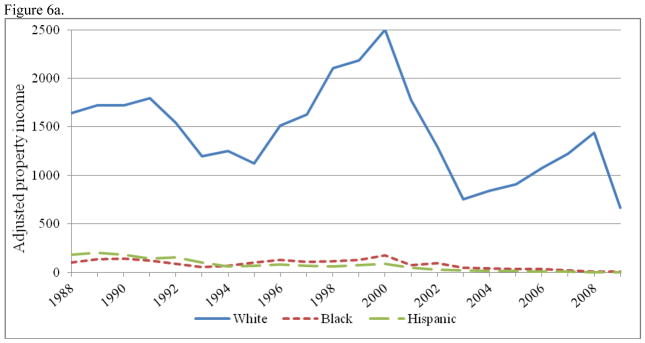
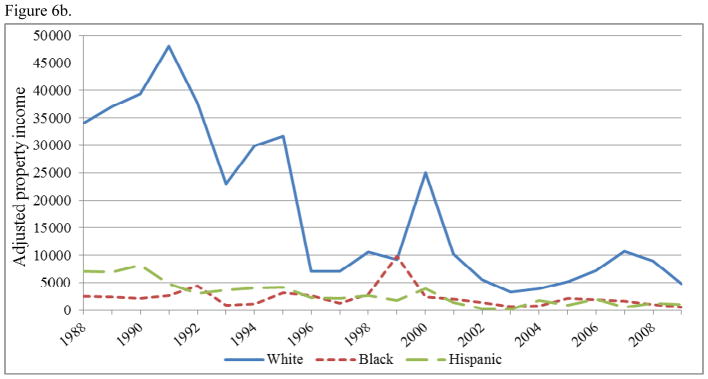
Figure 6a. Median Property Income by Race/Ethnicity for Q4
Figure 6b. Median Property Income by Race/Ethnicity for Top 1%
The median property income for the top 1% of black families remained under $5,000 until 1999 when it peaked at $9,800. Since that time though, median property incomes for the top1% of black and Hispanic families (who experienced their peak at $8,200 in 1990) have precipitously declined to under $1,000. The top 1% of white families, who once earned a substantial proportion of their overall family income from property, have experienced massive declines in property income since 1991. The median property income for the top 1% of white families in 1991 was $48,000. With the exception of brief surges from 1993 to 1995 and from 1999 to 2000, median property income for the richest whites has fallen since 1991 and now hovers below $5,000. To be sure, there is still a racial gap in median property income (about $4,200 between the richest white and black families and $3,800 between the richest white and Hispanic families in 2009), but the current gaps are nowhere near as pronounced as the property income gaps from 1988–1995 and 2000. Additional analyses (not shown but available upon request) demonstrated that the decline in property income among white families in Q4 was almost entirely a function of declines in interest income (savings, money market accounts, bonds, treasury notes, IRAs, and certificates of deposit). The decline in property income among the top 1% of whites was a result of declines in both interest income and dividends over the study period.
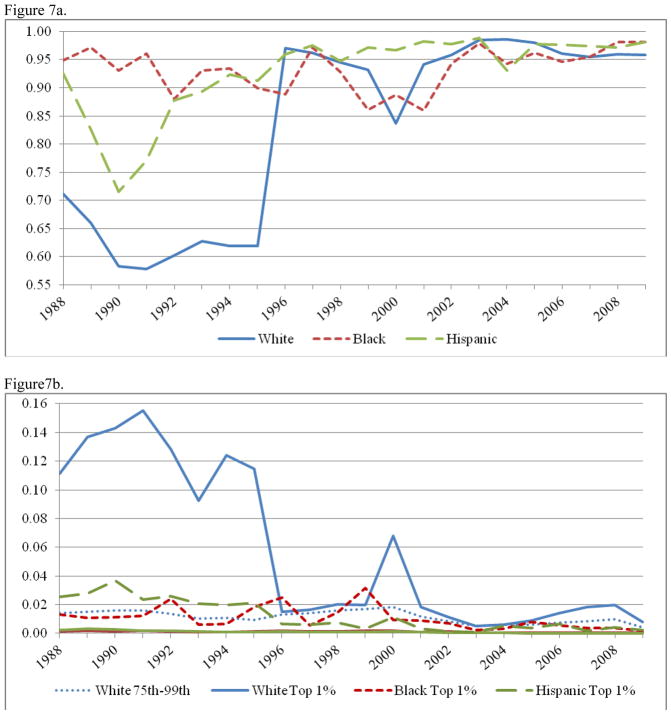
The importance of employment income vis a vis property income for the top 1% of families is demonstrated even further by Figures 7a and 7b. These figures show that from 1996 to 1998 and since 2001, the top 1% of white families earned nearly all of their income (over 95%) from employment. While just over half of family income among the richest white families was coming from employment throughout the early 1990s (with 11%-16% coming from property), those trends have not been seen since 2001. Since 2001, less than 2% of white family income among the richest 1% came from property earnings. Figure 7b also includes the 4th quartile of white families, whose proportion of family income coming from property has been less than 2% since 1988 and is now close to 0%. These graphics suggests that, at least since 2002, the top income earning white families have been remarkably similar to the top income earning black and Hispanic families in terms of income sources.
Figure 7.
Figure 7a. Proportion of Total Family Income from Employment, by Race/Ethnicity for Top 1%
Figure 7b. Proportion of Total Family Income from Property, by Race/Ethnicity for Top 1%
Characteristics of Families by Income Quartile and Race/Ethnicity
Table 3 (see Annex) displays the characteristics of families in each income quartile and the top 1% by race/ethnicity. Within each racial group, heads of household are oldest within the bottom quartile (Q1). The youngest heads of household fall within the 2nd and 3rd quartiles. The percentage of college graduates increases within each quartile for all three racial/ethnic groups. Within each quartile, white heads of household are the most likely to have a college degree, followed by blacks. Hispanic household heads have the lowest college graduation rates across all family income groups. The percentage of households headed by men increases with each increasing quartile. Across all quartiles and the top 1%, Hispanics have the lowest percentage of households headed by men, and whites have the highest. Household heads in the lower quartiles are also less likely to be married compared with those in higher family income groups. The highest percentage of married families is within the top 1% for all three racial/ethnic groups; over 80% of household heads are married within all three groups. Blacks and Hispanics are more likely to have children living in the household across all income quartiles and the top 1%, and the presence of children is greater among the higher income groups.
Table 3.
| Characteristics of Families in Q1, Q2, and Q3
| |||||||||
|---|---|---|---|---|---|---|---|---|---|
| Q1 (Bottom 25%) N=330,609a | Q2 (25th–50th%) N=338,331 | Q3 (50th–75th%) N=350,062 | |||||||
|
| |||||||||
| White (N=253,235) | Black (40,692) | Hispanic (N=36,682) | White (261,349) | Black (39,631) | Hispanic (37,351) | White (N=273,195) | Black (39,002) | Hispanic (N=37,865) | |
|
| |||||||||
| Age (Md) | 60 | 46 | 40 | 48 | 43 | 37 | 45 | 42 | 39 |
|
| |||||||||
| Educational Attainment | |||||||||
| High school graduate (%) | 59.9 | 51.6 | 35.2 | 65.5 | 63.6 | 43.9 | 62.3 | 66.0 | 51.5 |
| College graduate (%) | 11.0 | 4.1 | 3.9 | 20.1 | 7.6 | 6.0 | 30.1 | 17.2 | 10.9 |
|
| |||||||||
| Sex (% Male) | 40.9 | 26.4 | 41.3 | 58.9 | 36.8 | 57.7 | 67.5 | 46.7 | 62.3 |
|
| |||||||||
| Marital status (% married) | 28.1 | 20.4 | 42.7 | 51.2 | 32.5 | 61.0 | 71.7 | 45.2 | 68.8 |
|
| |||||||||
| Children in household | |||||||||
| At least one child < 6 (%) | 8.5 | 19.8 | 26.0 | 11.5 | 15.7 | 29.7 | 16.3 | 14.9 | 26.6 |
| At least one child < 18 (%) | 16.7 | 35.0 | 44.0 | 24.8 | 35.8 | 52.1 | 37.2 | 36.9 | 53.0 |
|
| |||||||||
| Employment | |||||||||
| Employed (%) | 33.9 | 27.1 | 42.9 | 61.6 | 60.3 | 68.9 | 76.9 | 75.4 | 78.3 |
| Unemp. (%) | 2.2 | 2.4 | 2.9 | 2.6 | 2.8 | 3.2 | 2.6 | 3.0 | 3.2 |
| Retired (%) | 39.0 | 21.8 | 16.7 | 25.5 | 16.6 | 9.2 | 13.3 | 10.6 | 6.4 |
| Unable/dis (%) | 9.5 | 20.2 | 11.7 | 3.1 | 7.8 | 4.2 | 1.6 | 3.9 | 2.5 |
| Other (%) | 15.5 | 28.5 | 25.9 | 7.2 | 12.5 | 14.5 | 5.6 | 7.1 | 9.5 |
|
| |||||||||
| Modal occupationsb | Personal care/service | Personal care/service | Personal care/service | Personal care/service | Personal care/service | Personal care/service | Personal care/service | Personal care/service | Health care |
| Education, training | Education, training | Education, training | Health care | Education, training | Education, training | Health care | Life, physical, social science | Personal care/service | |
| Life, physical, social science | Architecture, engineering | Health care | Life, physical, social science | Life, physical, social science | Health care | Management | Education, training | Education, training | |
|
| |||||||||
| Modal industry | Wholesale & retail trade | Wholesale & retail trade | Wholesale & retail trade | Wholesale & retail trade | Health care | Wholesale & retail trade | Manufacturing | Manufacturing | Manufacturing |
| Hospitality services | Hospitality services | Hospitality services | Manufacturing | Wholesale & retail trade | Manufacturing | Wholesale & retail trade | Health care | Wholesale & retail trade | |
| Manufacturing | Healthcare | Manufacturing | Construction | Manufacturing | Construction | Construction | Educ & Social Service | Construction | |
| Characteristics of Families in Q4 and Top 1%
| ||||||
|---|---|---|---|---|---|---|
| Q4 (75th–99th%) N=334,826a | Top 1% N=13,856 | |||||
|
| ||||||
| White (260,672) | Black (N=37,326) | Hispanic (36,828) | White (10,709) | Black (1,615) | Hispanic (1,532) | |
|
| ||||||
| Age (Md) | 47 | 44 | 41 | 49 | 47 | 45 |
|
| ||||||
| Educational Attainment | ||||||
| High school grad (%) | 45.6 | 59.3 | 55.1 | 23.8 | 35.7 | 32.6 |
| College graduate (%) | 51.2 | 31.2 | 23.1 | 74.6 | 59.7 | 55.2 |
|
| ||||||
| Sex (% Male) | 72.8 | 59.1 | 69.2 | 72.9 | 65.7 | 70.8 |
|
| ||||||
| Marital status (% married) | 86.7 | 69.9 | 80.7 | 89.7 | 80.5 | 86.1 |
|
| ||||||
| Children in household | ||||||
| At least one child < 6 (%) | 15.8 | 16.1 | 23.1 | 15.2 | 17.1 | 20.7 |
| At least one child < 18 (%) | 41.9 | 43.3 | 53.0 | 41.2 | 44.0 | 49.1 |
|
| ||||||
| Employment | ||||||
| Employed (%) | 83.6 | 83.4 | 84.3 | 83.4 | 86.0 | 85.4 |
| Unemployed (%) | 2.6 | 2.9 | 3.2 | 3.0 | 2.4 | 2.2 |
| Retired (%) | 8.1 | 7.3 | 4.6 | 5.5 | 6.0 | 2.7 |
| Unable/disabled (%) | 0.7 | 1.9 | 1.5 | 0.4 | 1.7 | 0.7 |
| Other (%) | 5.0 | 4.4 | 6.5 | 7.7 | 3.9 | 9.0 |
|
| ||||||
| Modal occupationsb | Management | Business & finance | Health care | Management | Management | Management |
| Business & finance | Management | Management | Business & finance | Business & finance | Business & finance | |
| Architecture & engineering | Life, physical, social sciences | Business & finance | Architecture & engineering | Architecture & engineering | Architecture & engineering | |
|
| ||||||
| Modal industry | Manufacturing | Manufacturing | Manufacturing | Prof, technical, management services | Health care | Prof, technical, management services |
| Wholesale & retail trade | Education & Social Services | Wholesale & retail trade | Finance, ins., real estate | Prof, technical, management services | Health care | |
| Prof, technical, management services | Public admin | Construction | Healthcare | Education & Social Services | Wholesale & retail trade/finance, ins, real estate | |
Unweighted Ns; values for all characteristics are weighted
Modal occupations are for years 2003–2009 only. The CPS changed occupation coding in 2003. The 2003–2009 codes vary too drastically from prior years’ codes to include all years in the modal occupations calculation.
In terms of labor market characteristics, the percentage employed increases with each quartile, with the highest employment rates within Q4 and the top 1%. Within all four quartiles and the top 1%, Hispanics are more likely than whites to be employed, while whites are more likely to be retired. Black heads of household are the most likely to be disabled or unable to work across all income groups, but the percentage of disabled household heads is lower within the higher income quartiles. Among those who are employed, the modal occupations are remarkably consistent across the bottom 75% of families in each racial/ethnic group. Household heads in the bottom 75% of each racial/ethnic tend to be clustered in the wholesale and retail trades, hospitality services, manufacturing, health care, and construction industries, engaging in occupations related to personal care services, education and training, life, physical and social sciences, architecture and engineering, and health care services. The 75th–99th percentile of white-headed families tend to be in the manufacturing, wholesale and retail trade, and professional, technical and management services industries where they work as managers, finance professionals, and architects or engineers. In addition to business, finance and management, the 75th–99th percentile of black family heads work in the life, physical, and social science professions and are more represented in the public administration industry. The 75th-99th percentile of Hispanic family heads are more similar to white families in terms of occupation and industry, but they are also likely to work in health care and construction.
Finally, the families who have received the most attention over the past several months – the top 1% - work in management, business and finance, and architecture and engineering occupations. There is no racial variation in modal occupation within the top 1% of families. In terms of modal industry, professional, technical and management services industries and health care are represented heavily in the top 1% among each racial/ethnic group. However, the top 1% of white family heads has a greater presence in finance, insurance, and real estate, while the richest black families are more heavily represented in education and social services.
Discussion
Since the start of the global economic recession, there has been a renewed focus in the sociological and economic literatures on U.S. income inequality, with particular attention paid to changes in overall family income over time, changes in the distribution of income sources, and surges in salaries among top income earners (Andrews et al. 2011; Blank 2011; Bryan and Martinez 2008; DiPrete et al. 2010; Kaplan and Rauh 2010; Kondo et al. 2009; Leigh 2009; McCall and Percheski 2010; Saez 2010; Shaw and Stone 2010; Smeeding and Thompson 2011; Western et al. 2008). The present research contributes to these existing literatures on overall income trends and racial economic inequality by using family-level data from the 1988–2009 Current Population Survey to examine changes in overall family income, sources of income, and the characteristics of white-, black-, and Hispanic-headed families, with a particular focus on the extent to which racial differences in employment, property, and transfer income have changed over time and how these racial differences vary across five different levels of family income. The results indicate interesting trends in family income over the past 20 years and lend important insight into the debate about racial disparities in overall family income as well as the distribution of different sources of income in the United States.
First, consistent with previous studies of trends in racial differences in overall family income (Campano 1991; Isaacs 2007) we found that white-headed families have maintained a remarkably stable income advantage over black- and Hispanic-headed families over the past two decades. Income trends across the bottom 99% of each racial/ethnic group are very similar. With the exception of a slight narrowing of the racial income gap in the bottom half of families, the white-black and white-Hispanic income gaps have either remained very similar (Q3) or increased over time (Q4). Among the top 1% of income earners in their respective racial/ethnic groups, the white-black total family income gap was narrowest in the early 1990s but has widened substantially throughout the past decade. Erratic patterns in median income among the top 1% of Hispanic families could be the result of instability with the data or may indicate emerging trends in income volatility among the most affluent Hispanics. Future research should explore this issue.
In addition to racial differences in overall family income trends, we decomposed family income into three categories: income from employment, property/assets, and transfers. Based on the labor market hierarchy approach to explaining the racial wage gap (Grodsky and Pager 2001; Huffman 2004; Semyoniv and Lewin-Epstein 2009), we anticipated that the white-black and white-Hispanic gaps in employment income would be the greatest at the highest levels of the income hierarchy. Our results confirmed this expectation. While there has been a slight narrowing of the racial gaps in employment income among families in Q2 (25th–50th percentile), and consistent gaps among families in Q3 (50th–75th percentile), the racial gaps in employment income among the top 25% of families has increased over time. This increase has been a function of more rapidly rising wages among whites rather than declining wages among blacks and Hispanics. Further, the racial gaps are the greatest among these highest income earning families. Our analysis of the labor market characteristics of families in the top 25% of the family income distribution confirm that the top income earners tend to be employed in the management, business, and finance industries, where wages have accelerated the most and where the racial earnings gap is the greatest (Morgan and McKerrow 2004). In addition, the decline in the racial earnings gap within the second quartile of family income (25th–50th percentile) is a function of increased employment earnings among blacks and Hispanics alongside stagnant earnings growth among whites. This is consistent with Morgan and McKerrow’s (2004) finding that in the growing context of overall wage inequality in general, whites in lower status and lower earning occupations have been unable to maintain wage advantages over their black counterparts like whites at the top of the income distribution have done.
Third, consistent with previous studies on changes in sources of family income over time (Leigh 2009; Picketty and Saez 2006; Raffalovich et al. 2009), we found that with the exception of the bottom 25% of white- and black-headed families, who earn a substantial proportion of their income from transfers, the majority of American families earn nearly all of their income from employment. Saez (2010) suggests that the massive increase in top family incomes over the past 30 years has been due to an explosion in wage and salary income among the highest income earners, rather than increases in property income. Our results support the view that, regardless of race/ethnicity, top income earners do not derive the majority, or even a substantive proportion, of their incomes from past or current wealth, but instead represent a “working rich” contingent of highly paid employees in management, finance, real estate, and health care. Despite the focus on wealth as a major source of racial economic disparity, we found that only the top 1% of families earned any significant income from property and that by the early 2000s, white families had experienced such tremendous declines in property income (largely as a result of declines in interest-earning assets) that the racial gap had narrowed to its lowest point in recent history. As expected, the racial gaps in property income were narrowest during the two major periods of U.S. stock market decline (2000–2002 and 2007–2009). While still existent, the gap is not nearly at the same level of disparity as it was throughout the late 1980s and early 1990s. To be clear, we are not arguing that the racial wealth gap itself has narrowed or that the racial wealth gap should not be the focus of considerable sociological attention. Indeed, recent research suggests that the white-black and white-Hispanic wealth gaps are now at their highest levels in history (Taylor et al. 2011; Shapiro et al. 2010). Large racial wealth gaps have implications for long-term financial security, children’s opportunities for educational attainment, generational transmission of well-being and homeownership (Shapiro et al. 2010; Domhoff 2002). Our results simply demonstrate that the amount of income from wealth (stocks, bonds, rents) and the proportion of total family income that comes from that wealth are very similar across racial groups at all levels of income, and have been so since the early 2000s.
However, the results for the top 1% of families should be interpreted with a degree of caution. Because the CPS top codes the income variables, these results may mask what is really occurring among the very richest Americans. In a recent article, Norris (2010) suggested that the very rich (those individuals or families making over $10 million annually) earned the majority of their income from property. Only 19% of the income of these top families came from wages and salary. In addition, while the CPS asks respondents to report income from dividends, rents, royalties, estates, trusts, bonds, and interest bearing savings account, it does not ask for income realized from capital gains. This is an important limitation considering that almost 75% of income for the top 400 families is estimated to come from capital gains and dividends and that there have been tremendous cuts to tax rates on capital gains since 2003 (Domhoff 2011). As indicated by McCall and Percheski (2010), none of the existing household surveys accurately reflect incomes for the very top of the income distribution. U.S. tax data and other administrative records are likely better equipped to explore trends in racial differences in income among the top 0.5–0.1% of families.
In terms of transfer income, as a result of changes in welfare laws and the increasing importance of social security and retirement income among the bottom income earners, we anticipated that there would be a widening of the racial gap in income from transfers. In supplemental analysis we found that the percentage of total transfer income coming from public assistance has dramatically declined since 1988 within the bottom income quartile. While white-headed families in the bottom quartile have maintained a fairly consistent median transfer income since 1988, median transfer income for the lowest income black and Hispanic families declined over the study period, possibly reflecting the stricter regulations that came with the Welfare Reform Act of 1996, including time limits, work requirements, family caps, and sanctions. A great deal of previous research indicates that black and Hispanic families were disproportionately disadvantaged with the transition from AFDC to TANF in 1996 and have been more likely than whites to time-out of benefits, be subjected to family caps, and lose their benefits due to violations of work and other behavioral requirements (Chang et al. 2001; Hasenfeld et al. 2004; Keiser et al. 2004; Monnat 2010; Schram et al. 2003). The high percentage of female-headed and unmarried households, especially among black families in the bottom two income quartiles, may partially explain the declines in median transfer income among blacks in the post-Welfare Reform era. In addition, given that the median age of the head of household of the bottom 25% of white families is 60 (much older than the median age of black and Hispanic heads of household), the higher median transfer income among whites in the lowest income quartiles may reflect the aging baby-boomer population who is now collecting social security and retirement benefits, both increasingly important components of transfer income, especially within the second quartile of families.
An important limitation to our analysis of transfer income is that we were unable to include the Earned Income Tax Credit (EITC) in our calculations of family income. CPS documentation indicates that the value reported is only an estimate of what the family is eligible to receive, not actual receipt. Accordingly, it is impossible to known which respondents were eligible nonparticipants or ineligible participants in the EITC program. While exclusion of the EITC may affect our results related to the second income quartile, it is unlikely to have any effect on the bottom income quartile since the median employment income among that group was $0. In order to be eligible for the earned income tax credit, the family has to have earned income from employment. In addition to excluding the EITC, the CPS transfer income variables do not include non-cash transfers, such as the Supplemental Nutrition Assistance Program (SNAP), housing subsidies, and other non-cash benefits. Although including these sources would not change the results regarding trends in family income, it is important to consider that these non-cash benefits are important components of a family’s overall consumption potential and have become increasingly important to low income families since the Welfare Reform Act of 1996 (Pavetti and Rosenbaum 2010).
In terms of predictions regarding future racial disparities in family income, although the housing market has remained in a slump since the recession officially ended in 2009, the stock market has largely recovered its losses. Previous research suggests that changes in the value of assets, rather than asset ownership or composition, explain the declines in wealth between 2007 and 2009 (Bricker at el. 2011). Because whites are more likely than blacks and Hispanics to own stocks, mutual funds, and individual retirement accounts, the stock market rebound since 2009 is likely to have a greater benefit to whites’ property income earning potential than to minority families. As shown earlier in Figure 6b, during previous periods of stock market prosperity (mid-1990s and 2000), the black-white and Hispanic-white gaps in income earned from property among the top 1% were quite large. If the stock market rebound since the official end of the recession in 2009 continues, we should expect to see a reemergence of the racial gap in property income, as the richest white families begin earning a larger proportion of their overall family income from property. This, combined with the rising salaries of the top 1% should result in the largest black-white gaps in family income among the richest Americans we have ever seen. Whether the gap between whites and Hispanics continues to decline is more difficult to determine. If the trends that began in the late 2000s continue, then the richest Hispanics should experience similar employment earnings as whites. However, the recession may have harmed the income earning potential of the highest earning Hispanic families (Taylor et al. 2010). If this is the case, the Hispanic-white income gap will widen once again.
Future research should employ more sophisticated inferential techniques to analyze these and other issues related to the distribution and sources of family income. Such research may consider the effect of geography, family structure and government economic policy on these trends. Future research should also examine differences in income and sources of income across different Hispanic ethnic groups. There are reasons to expect a great deal of variability in income trends between Mexicans, Puerto Ricans, Cubans and other Hispanic families. Overall, the trends discussed in this paper suggest that employment income will continue to increase in importance, and considering the significant and growing racial gap in employment income among the top 25% of families, we hold out little hope for equality in employment income anytime in the near future. It is also possible that we have yet to see the employment income effects of the recession on the racial income gap, especially since our data from 2009 measure income from 2008. Future research should examine the effects of the recent economic recession on the racial employment and transfer income gaps among the lowest quartiles of family income.
Acknowledgments
An earlier version of this paper was presented at the 2011 meeting of the Research Committee on Social Stratification and Mobility (RC28) of the International Sociological Association (ISA), August 9–12, 2011 in Iowa City, Iowa. We thank attendees of that session, David Bills, and an anonymous reviewer for their helpful comments and suggestions on this paper. The Center for Social and Demographic Analysis of the University at Albany provided technical and administrative support for this research through a grant from NICHD (R24 HD044943).
Footnotes
Because median employment income for all racial groups in Q1 was $0 for the entire study period, we do not present a graph.
Families above the 50th percentile of family income had median transfer incomes of $0 throughout the study period.
Median property income for families below the 75th percentile of family income was $0 in all years and for all racial groups.
Because the CPS asks about income for the prior year, the trends in the graphics are actually representing income for the year prior to what is shown.
References
- Andrews D, Jencks C, Andrew Leigh. Do Rising Top Incomes Lift all Boats? The BE Journal of Economic Analysis & Policy. 2011;11:1–43. [Google Scholar]
- Atkinson AB, Piketty Thomas, editors. Top Incomes over the Twentieth Century. Oxford: Oxford University Press; 2007. [Google Scholar]
- Blank Rebecca. Changing Inequality. Berkeley, CA: University of California Press; 2011. [Google Scholar]
- Blau FD, John W Graham. Black-White Differences in Wealth and Asset Composition. Quarterly Journal of Economics. 1990;105:321–339. [Google Scholar]
- Bocian DG, Li W, Ernst Keith S. Foreclosures by Race and Ethnicity: The Demographics of a Crisis. Center for Responsible Lending; Durham, NC: 2010. [accessed April 20, 2012]. http://www.responsiblelending.org/mortgage-lending/research-analysis/foreclosures-by-race-executive-summary.pdf. [Google Scholar]
- Bricker J, Bucks B, Kennickell A, Mach T, Moore Kevin. Finance and Economics Discussion Series Divisions of Research & Statistics and Monetary Affairs. Washington, DC: Federal Reserve Board; 2011. [accessed May 9, 2012]. Surveying the Aftermath of the Storm: Changes in Family Finances from 2007 to 2009. http://www.federalreserve.gov/pubs/feds/2011/201117/201117abs.html. [Google Scholar]
- Bryan KA, Leonardo Martinez. On the Evolution of Income Inequality in the United States. Economic Quarterly. 2008;94:97–120. [Google Scholar]
- Burkhauser RV, Feng S, Jenkins SP, Larrimore Jeff. NBER Working Paper 15320. National Bureau of Economic Research; Cambridge, MA: 2009. [accessed April 10, 2012]. Recent Trends in Top Income Shares in the USA: Reconciling Estimates from March CPS and IRS Tax Return Data. http://www.nber.org/papers/w15320. [Google Scholar]
- Campano Fred. Recent Trends in U.S. Family Income Distribution: A Comparison of All, White, and Black Families. Journal of Post Keynesian Economics. 1991;13:337–50. [Google Scholar]
- Cancio AS, Evans TD, David J Maume., Jr Reconsidering the Declining Significance of Race: Racial Differences in Early Career Wages. American Sociological Review. 1996;61:541–556. [Google Scholar]
- Card D, Alan B Krueger. School Quality and Black-White Relative Earnings: A Direct Assessment. Quarterly Journal of Economics. 1992;107:151–200. [Google Scholar]
- Chang Y, Beller A, Elizabeth Powers. Who Gets Sanctioned under Welfare Reform? Evidence from Child Support Enforcement in Illinois. Family Relations & Human Development/Family Economics & Resource Management Biennial. 2001;4:53–61. [Google Scholar]
- Conley Dalton. Being Black, Living in the Red: Race, Wealth and Social Policy in America. Berkeley: University of California Press; 1999. [Google Scholar]
- DeNavas-Walt C, Proctor BD, Smith Jessica C. Current Population Reports, P60-239. Washington, DC: United States Census Bureau; 2011. [accessed May 9, 2012]. Income, Poverty, and Health Insurance Coverage in the United States: 2010. http://www.census.gov/prod/2011pubs/p60-239.pdf. [Google Scholar]
- DiPrete TA, Eirich Gregory M. Compensation Benchmarking, Leapfrogs, and the Surge in Executive Pay. American Journal of Sociology. 2010;115:1671–1712. [Google Scholar]
- Domhoff G William. [accessed November 30, 2011];Who Rules America: Wealth, Income, and Power. 2011 http://www2.ucsc.edu/whorulesamerica/power/wealth.html.
- Farkas G, England P, Vicknair K, Barbara Stanek Kilbourne. Cognitive Skill, Skill Demands of Jobs, and Earnings among Young European American, African American, and Mexican American Workers. Social Forces. 1997;75:913–938. [Google Scholar]
- Farkas G, Kevin Vicknair. Appropriate Tests of Racial Wage Discrimination Requires Controls for Cognitive Skill: Comments on Cancio, Evans, and Maume. American Sociological Review. 1996;61:557–60. [Google Scholar]
- Fossett Mark A. City Differences in Racial Occupational Differentiation: A Note on the Use of Odds Ratios. Demography. 1984;21:655–66. [PubMed] [Google Scholar]
- Gittleman M, Edward W Wolff. Racial Differences in Patterns of Wealth Accumulation. Journal of Human Resources. 2004;39:193–227. [Google Scholar]
- Gottschalk P, Sheldon Danzinger. Inequality of Wage Rates, Earnings and Family Income in the United States, 1975–2002. Review of Income and Wealth. 2005;51:231–254. [Google Scholar]
- Grodsky E, Devah Pager. The Structure of Disadvantage: Individual and Occupational Determinants of the Black-White Wage Gap. American Sociological Review. 2001;66:542–67. [Google Scholar]
- Hasenfeld Y, Ghose T, Kandyce Larson. The Logic of Sanctioning Welfare Participants: An Empirical Assessment. Social Service Review. 2004;79:304–19. [Google Scholar]
- Hendley Alexa A, Natasha F Bilimoria. Minorities and Social Security: An Analysis of Racial and Ethnic Differences in the Current Program. Social Security Bulletin. 1999;62:59–64. [PubMed] [Google Scholar]
- Huffman Matt L. More Pay, More Inequality? The Influence of Average Wage Levels and the Racial Composition of Jobs on the Black-White Wage Gap. Social Science Research. 2004;33:498–520. [Google Scholar]
- Huffman Matt L, Philip N Cohen. Racial Wage Inequality: Job Segregation and Devaluation across U.S. Labor Markets. American Journal of Sociology. 2004;109:902–36. [Google Scholar]
- Isaacs Julia. Economic Mobility of Black and White Families. Pew Charitable Trusts and The Brookings Institution; Washington, DC: 2007. [accessed April 18, 2012]. http://www.brookings.edu/papers/2007/11_blackwhite_isaacs.aspx. [Google Scholar]
- Jensen MC, Murphy Kevin J. European Corporate Governance Institute Finance Working Paper Series. No 44/2004. ECGI; Brussels, Belgium: 2004. [accessed April 10, 2012]. Remuneration: Where We’ve Been, How we got Here, What are the Problems, and How to Fix Them. http://www.cgscenter.org/library/board/remuneration.pdf. [Google Scholar]
- Kaplan SN, Joshua Rauh. Wall Street and Main Street: What Contributes to the Rise in the Highest Incomes? The Review of Financial Studies. 2010;23:1004–50. [Google Scholar]
- Kaufman Robert L. A Structural Decomposition of Black-White Earnings Differentials. American Journal of Sociology. 1983;89:585–611. [Google Scholar]
- Kaufman Robert L. Assessing Alternative Perspectives on Race and Sex Employment Segregation. American Sociological Review. 2002;67:547–72. [Google Scholar]
- Keiser LR, Mueser PR, Seung-Whan Chai. Race, Bureaucratic Discretion, and the Implementation of Welfare Reform. American Journal of Political Science. 2004;48:314–27. [Google Scholar]
- Keister Lisa A. Wealth in America: Trends in Wealth Inequality. Cambridge, MA: Cambridge University Press; 2000. [Google Scholar]
- Kennickell Arthur B. Working Paper 393. Levy Economics Institute of Bard College; 2003. A Rolling Tide: Changes in the Distribution of Wealth in the U.S., 1989–2001. [Google Scholar]
- Kochhar Rakesh. The Wealth of Hispanic Households: 1996 to 2002. Washington, DC: Pew Hispanic Center; 2004. [accessed August 7, 2011]. http://pewhispanic.org/files/reports/34.pdf. [Google Scholar]
- Kondo Naoki, Sembajwe G, Kawachi I, van Dam RM, Subramanian SV, Yamagata Zentaro. Income Inequality, Mortality, and Self Rated Health: Meta-Analysis of Multilevel Studies. BMJ. 2009;339 doi: 10.1136/bmj.b4471. [DOI] [PMC free article] [PubMed] [Google Scholar]
- Leigh A. Top Incomes. In: Salverda W, Nolan B, Smeeding TM, editors. The Oxford Handbook of Economic Inequality. Oxford: Oxford University Press; 2009. pp. 150–74. [Google Scholar]
- Lindert PH. Three Centuries of Inequality in Britain and America. In: Atkinson AB, Bourguignon F, editors. Handbook of Income Distribution. Vol. 1. Amsterdam: Elsevier; 2000. pp. 167–216. [Google Scholar]
- Loprest P, Holcomb PA, Martinson K, Zedlewski Sheila R. The Urban Institute 07-03. Washington, DC: 2007. [accessed May 9, 2012]. TANF Policies for the Hard to Employ: Understanding State Approaches and Future Directions. http://www.urban.org/publications/411501.html. [Google Scholar]
- Maxwell Nan L. The Effect on Black-White Wage Differences of Differences in the Quantity and Quality of Education. Industrial and Labor Relations Review. 1994;47:249–264. [Google Scholar]
- McCall L, Christine Percheski. Income Inequality: New Trends and Research Directions. Annual Review of Sociology. 2010;36:329–47. [Google Scholar]
- McLanahan S, Christine Percheski. Family Structure and the Reproduction of Inequalities. Annual Review of Sociology. 2008;34:257–276. [Google Scholar]
- Monnat Shannon M. The Color of Welfare Sanctioning: Exploring the Individual and Contextual Roles of Race on TANF Case Closures and Benefit Reductions. The Sociological Quarterly. 2010;51:678–707. doi: 10.1111/j.1533-8525.2010.01188.x. [DOI] [PubMed] [Google Scholar]
- Morgan SL, Mark W McKerrow. Social Class, Rent Destruction, and the Earnings of Black and White Men, 1982–2000. Research in Social Stratification and Mobility. 2004;21:215–251. [Google Scholar]
- Morris M, Bruce Western. Inequality in Earnings at the Close of the 20th Century. Annual Review of Sociology. 1999;25:623–57. [Google Scholar]
- Neal DA, William R Johnson. The Role of Premarket Factors in Black-White Wage Differences. The Journal of Political Economy. 1996;104:869–895. [Google Scholar]
- Norris Floyd. New York Times. 2010. Jul 24, Off the Charts: In ‘08 Downturn, Some Managed to Eke Out Millions; p. B-3. [Google Scholar]
- Oliver ML, Shapiro Thomas M. Black Wealth/White Wealth. New York, NY: Routledge; 1995. [Google Scholar]
- O’Neill June O. The Role of Human Capital in Earnings Differences between Black and White Men. Journal of Economic Perspectives. 1990;4:25–45. [Google Scholar]
- Pais Jeremy. Socioecononomic Background and Racial Earnings Inequality: A Propensity Score Analysis. Social Science Research. 2011;40:37–49. [Google Scholar]
- Pavetti L, Rosenbaum Dorothy. Creating a Safety Net that Works When the Economy Doesn’t: The Role of Food Stamps and TANF Programs. Center on Budget and Policy Priorities; Washington, DC: 2010. [accessed April 20, 2012]. http://www.cbpp.org/files/2-25-10fa.pdf. [Google Scholar]
- Piketty T, Emmanuel Saez. The Evolution of Top Incomes: A Historical and International Perspective. American Economic Review. 2006;96:200–205. [Google Scholar]
- Raffalovich LE, Monnat SM, Hui-shien Tsao. Family Income at the Bottom and at the Top: Income Sources and Family Characteristics. Research in Social Stratification and Mobility. 2009;27:301–309. doi: 10.1016/j.rssm.2009.09.001. [DOI] [PMC free article] [PubMed] [Google Scholar]
- Saez Emmanuel. [accessed November 30, 2011];Striking it Rich: The Evolution of Top Incomes in the United States. 2010 http://elsa.berkeley.edu/~saez/saez-UStopincomes-2008.pdf.
- Scholz John K. The Earned Income Tax Credit: Participation, Compliance, and Antipoverty Effectiveness. [accessed March 27, 2012];Institute for Research on Poverty Discussion Paper no. 1020–93. 1993 http://www.irp.wisc.edu/publications/dps/pdfs/dp102093.pdf.
- Schott L, Finch Ife. TANF Benefits are Low and Have Not Kept Pace with Inflation: Benefits are not Enough to Meet Families’ Basic Needs. Center on Budget and Policy Priorities; Washington, DC: 2010. [accessed May 9, 2012]. http://www.cbpp.org/pdf/11-24-08tanf.pdf. [Google Scholar]
- Schott L, Pavetti LaDonna. Many States Cutting TANF Benefits Harshly Despite High Unemployment and Unprecedented Need. Center on Budget and Policy Priorities; Washington, DC: 2011. [accessed May 9, 2012]. http://www.cbpp.org/cms/?fa=view&id=3498. [Google Scholar]
- Schram SF, Soss J, Fording Richard C. Race and the Politics of Welfare Reform. Ann Arbor, MI: University of Michigan Press; 2003. [Google Scholar]
- Semyonov M, Noah Lewin-Epstein. The Declining Racial Earnings’ Gap in United States: Multi-level Analysis of Males’ Earnings, 1960–2000. Social Science Research. 2009;38:296–311. [Google Scholar]
- Semyonov M, Haberfeld Y, Cohen Y, Noah Lewin-Epstein. Racial Composition and Occupational Segregation and Inequality across American Cities. Social Science Research. 2000;29:175–87. [Google Scholar]
- Shapiro Thomas M. The Hidden Cost of Being African American: How Wealth Perpetuates Inequality. New York, NY: Oxford University Press; 2004. [Google Scholar]
- Shapiro TM, Meschede T, Sullivan Laura. Research and Policy Brief: Institute on Assets and Social Policy. Waltham, MA: The Heller School for Social Policy and Management, Brandeis University; 2010. [accessed July 10, 2010]. The Racial Wealth Gap Increases Fourfold. http://iasp.brandeis.edu/pdfs/Racial-Wealth-Gap-Brief.pdf. [Google Scholar]
- Shaw H, Stone Chad. Tax Data Show Richest 1 Percent Took a Hit in 2008, but Income Remained Highly Concentrated at the Top: Recent Gains of Bottom 90 Percent Wiped Out. Center of Budget and Policy Priorities; Washington, DC: 2010. [accessed April 12, 2012]. http://www.cbpp.org/cms/index.cfm?fa=view&id=3309. [Google Scholar]
- Smeeding TM, Jeffrey P Thompson. Recent Trends in Income Inequality. Research in Labor Economics. 2011;32:1–50. [Google Scholar]
- Spilerman Seymour. Wealth and Stratification Processes. Annual Review of Sociology. 2000;26:497–524. [Google Scholar]
- Taeuber AF, Taeuber KE, Glen G Cain. Occupational Assimilation and the Competitive Process: A Reanalysis. American Journal of Sociology. 1966;72:273–285. doi: 10.1086/224295. [DOI] [PubMed] [Google Scholar]
- Taylor P, Morin R, Kochhar R, Parker K, Cohn D, Lopez MH, Fry R, Wang W, Velasco G, Dockterman D, Hinze-Pifer R, Espinoza Soledad. A Balance Sheet at 30 Months: How the Great Recession Has Changed Life in America. Washington, DC: Pew Research Center; 2010. [accessed May 9, 2012]. http://pewsocialtrends.org/files/2010/11/759-recession.pdf. [Google Scholar]
- Taylor P, Kochhar R, Fry R, Velasco G, Motel Seth. Pew Research Center Social & Demographic Trends. Washington, DC: Pew Research Center; 2011. [accessed August 7, 2011]. Wealth Gap Rises to Record Highs between Whites, Blacks and Hispanics. http://pewsocialtrends.org/files/2011/07/SDT-Wealth-Report_7-26-11_FINAL.pdf. [Google Scholar]
- Tomaskovic-Devey Donald. Gender & Racial Inequality at Work: The Sources and Consequences of Job Segregation. IRL Press; Ithaca, NY: 1993. [Google Scholar]
- Tomaskovic-Devey D, Thomas M, Kecia Johnson. Race and the Accumulation of Human Capital across the Career: A Theoretical Model and Fixed-Effects Application. American Journal of Sociology. 2005;111:58–89. [Google Scholar]
- Western B, Bloome D, Christine Percheski. Inequality among American Families with Children, 1975–2005. American Sociological Review. 2008;73:903–20. [Google Scholar]
- Wolff EN. Recent Trends in Wealth Ownership, from 1983 to 1998. In: Shapiro TM, Wolff EN, editors. Assets for the Poor: The Benefits of Spreading Asset Ownership. New York: Russell Safe Press; 2001. pp. 34–73. [Google Scholar]
- Wolff EN. Top Heavy: The Increasing Inequality of Wealth in America and What can be Done About It. New York, NY: New Press; 2002. [Google Scholar]
- Wolff EN. Working Paper No. 589. Annandale-on-Hudson, NY: The Levy Economics Institute of Bard College; 2010. [accessed May 9, 2012]. Recent Trends in Household Wealth in the United States: Rising Debt and the Middle-Class Squeeze – an Update to 2007. http://www.levyinstitute.org/pubs/wp_589.pdf. [Google Scholar]
- Zedlewski S, Holcomb P, Loprest Pamela. Low-Income Working Families Paper 9. The Urban Institute; Washington, DC: 2007. [accessed May 9, 2012]. Hard-to-Employ Parents: A Review of their Characteristics and the Programs Designed to Serve their Needs. http://www.urban.org/url.cfm?renderforprint=1&ID=411504. [Google Scholar]
- Zedlewski S, Golden Olivia. Next Steps for Temporary Assistance for Needy Families. The Urban Institute, Brief 11. The Urban Institute; Washington, DC: 2010. [accessed May 9, 2012]. http://www.urban.org/uploadedpdf/412047_next_steps_brief11.pdf. [Google Scholar]


