

Abstract
Background/objectives
The short chain fatty acid acetate (AC), may play a role in increasing insulin sensitivity, thus lowering risk for obesity and type 2 diabetes mellitus. It is unclear if AC kinetics is similar in normal and hyperinsulinaemic participants. Therefore, we studied AC absorption from the distal colon in participants with normal (<40 pmol/L, NI) and high (≥40 pmol/L, HI) plasma-insulin. This work was part of a series of studies conceived to compute a kinetic model for acetate. Kinetic parameters such as estimates of rate of entry into peripheral blood, hepatic uptake and endogenous/exogenous production were compared in the groups.
Subjects/methods
Overnight fasted NI (n = 9) and HI (n = 8) participants were given rectal infusions containing sodium acetate (90 mmol/L). The solutions were retained for 40 min, then voided for AC measurement. Total amount of AC infused was 27 mmols.
Results
Acetate absorption from the distal colon (279±103 vs 322±91 μmol/min, P = 0.76) and hepatic uptake of AC (155±101 vs 146±85 μmol/min, P = 0.94) were similar in the groups. Endogenous and exogenous AC production was significantly higher in NI than HI participants. Plasma AC was inversely proportional to plasma insulin concentrations in the entire cohort (y=k/x, where k = 1813).
Conclusions
There was low power to detect differences in AC absorption rate and hepatic AC uptake in NI vs HI. The rate of entry of AC into peripheral blood was similar in NI and HI participants. However, hyperinsulinaemia may alter endogenous and exogenous AC metabolism.
Keywords: Humans, acetate kinetics, insulin resistance, obesity, colonic fermentation
Introduction
Epidemiologic studies have shown that higher intakes of whole grains and dietary fibre are associated with a reduced risk of type 2 diabetes mellitus (T2DM) and obesity.1–4 The protective mechanisms of whole grains are complex but colonic fermentation of dietary fibre may play an important role. Other factors independent of the rate of colonic fermentation may also be involved in reducing diabetes risk and improving whole-body insulin sensitivity after insoluble fibre intakes. 5–7 Studies in animals show that soluble fiber intakes with increased SCFA production significantly contribute to digested energy and may unfavorably affect energy homeostasis in the long term. 5
In humans, the major end products of colonic fermentation of dietary fibre are short chain fatty acids (SCFA), acetate (AC), propionate (PR) and butyrate (BU). Studies indicate that 80–90% of SCFA produced are rapidly absorbed from the colonic lumen,8–10 enter the portal vein, are transported to the liver and metabolised there.11 Butyrate the preferred energy source for colonocytes is largely metabolised by the gut wall. The liver metabolises any residual BU along with PR which is mainly a gluconeogenic substrate, but, small amounts of PR and BU can be measured in blood. Acetate is largely taken up by the liver but 30–50% of colonic AC does reach the peripheral circulation where it can be used as an energy source. Acetate may also play an indirect role in increasing insulin sensitivity by reducing plasma free fatty acids.12, 13
We have previously investigated AC kinetics in normal (NI) and hyperinsulinaemic (HI) participants13, 14 because it is not known if the rates of production and clearance of AC are similar in these groups. Lower fasting serum AC concentrations were observed in HI compared to NI participants suggesting that AC metabolism may be altered in this group.14 Serum SCFA responses after inulin ingestion14 and peripheral AC clearance13 were similar in the two groups. This suggests, perhaps, that reduced absorption of AC in HI participants may account for the lower AC concentrations in HI participants. In previous studies we have shown that the rate of absorption of SCFA from the distal colon varies markedly in different subjects.15 It is not known if AC absorption differs in NI compared to HI participants. Increased absorption of SCFA may enhance insulin sensitivity and reduce T2DM risk in hyperinsulinemia conversely a decreased absorption of SCFA or the inability of SCFA to regulate FFA may contribute to the development of obesity and insulin resistance. The aims of this study were to compare colonic AC absorption and AC kinetics in NI and HI participants.
Methods
Male or non-pregnant, non-lactating females aged 18–65 with BMI ≥ 20 and ≤ 35kg/m2 were recruited from a pool of participants previously involved in studies by our group. Participant exclusion and eligibility criteria have been previously described. 11 Eligible participants were divided prospectively to obtain a group (n = 9) with normal fasting insulin (FSI < 40 pmol/L) and a group (n = 8) with high fasting insulin (FSI ≥ 40pmol/L). Participants were selected based on FSI because of the positive association between FSI and insulin resistance (IR),16 and because 40 pmol/L represents approximately the 66%ile for healthy subjects in our clinical experience. Ethical approval was obtained from the Research Ethics Boards of St. Michael’s Hospital, Toronto and the University of Toronto. Participants gave written informed consent to participate in the study.
Tests were conducted at the Clinical Nutrition and Risk Factor Modification Centre (CNRFMC), St. Michael’s Hospital, Toronto, Ontario. Participants were asked to refrain from alcohol and strenuous exercise in the 24 h period prior to the test. Participants consumed a low fibre diet for the 24 h period prior to the test in order to minimise systemic AC originating from colonic fermentation. The following foods were provided: Eggs, yogurt, cheddar cheese, canned tuna, chicken, white bread, crackers and apple juice. Participants supplemented the diet provided with tea, coffee, juices, carbonated drinks, spreads, margarine and oils in cooking. Participants were instructed not to consume whole grain breads and cereals, vegetables and fruits.
Participants were studied in the morning after 10 – 14-h overnight fasts. On the test day, subjects collected fasting breath samples. Subjects then put ~5 cm of the end of a piece of Tygon flexible plastic tubing (Norton Performance Plastics, Akron, OH, USA; o.d., 5 mm) into their rectum, infused 500 mL of doubly distilled water, and emptied their colon and collected the voided solution/faecal material (baseline sample) in the collection bag provided to them. Subjects then waited 15 min to ensure that there was no further urge to void. During this time an indwelling IV catheter was inserted into a superficial forearm vein and kept patent with normal saline and fasting blood samples were collected. The tubing was then replaced into the rectum and 300 ml of the test solution containing 27 mmol of sodium acetate (Sigma Chemical, St. Louis, MO, USA), was infused over a 10 min period. The test solution was made up in doubly distilled water with 0.375 mmol/300 mL polyethylene glycol 4000 (PEG) (Mallinckrodt Canada, Pointe-Claire, Quebec, Canada) as an unabsorbable marker. Additional blood samples were collected at 10, 20, 30 and 40 min after the start of the infusion. The solution was held for 30 min, then voided into a collection bag (end point sample). The total time from the start of infusion to when the solution was voided was 40 minutes. The blood samples and baseline and endpoint samples collected were analyzed for SCFA.
Whole blood for SCFA measurements were collected in red top Vacutainer™ tubes containing no substrates (Becton Dickinson, Franklin Lakes, NJ, USA). Blood samples were allowed to clot at room temperature, centrifuged at 600×g for 15 min at 4 °C, the serum aliquoted and stored at −70 °C before analysis. SCFA were measured by gas chromatography after micro filtration and vacuum distillation as previously described.14
Short chain fatty acids in the voided solutions were also analysed by gas chromatography. Samples for SCFA analysis were centrifuged at 9000 × g for 10 min. The supernatant was stored at −20 °C before vacuum distillation.17
This study was part of a series of studies conducted in the same participants, 2 of which have been published. 13, 14 In the first study14 participants were studied on two occasions after an overnight fast. The participants consumed a test drink containing 75 g glucose (Grain Process Enterprises Ltd, Scarborough, ON, Canada) in 300 mL of water (OGTT) or 75 g glucose + 24 g Oliggo-Fiber® Instant Inulin (Cargill Inc, Wayzata, MN, USA) (OGTT + Inulin) in 300 mL of water within 5 min with serum AC concentration measured before and at 30, 60, 90, 120, 180, and 240 min following consumption of the test drink. In the second study 13 overnight-fasted participants were given an IV infusion of sodium acetate over a 90 min period at rates of 0.24 mmol/min for 30 min, followed by 0.49 mmol/min for 30 min and 0.99 mmol/min for 30min. Serum AC was measured fasting and at 20, 25, and 30 minutes after the start of each infusion rate.
Data from the present study along with AC response data from the previously published studies13, 14 were used for calculation of AC kinetics using the model shown in Figure 1.
Figure 1.
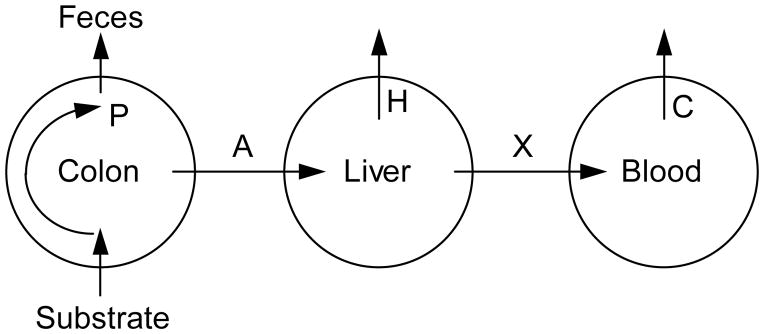
Kinetic model of acetate (AC) metabolism: P = rate of production of AC in colon; A = rate of absorption of AC from the colon; H = rate of hepatic uptake of AC; X = rate of entry of AC into peripheral blood; C = rate of whole body uptake of AC from peripheral blood.
The rate of absorption of AC from the distal colon (A mmol/min) was calculated as follows:
| [1] |
where ACbaseline is the amount of AC infused (i.e. 27 mmol) and ACend is the amount of AC remaining in the colon the end of the study and T is the time (i.e. 40min) calculated as follows:
| [2] |
where [ACend] and [PEGend] are the concentrations of AC and PEG in the fluid evacuated from the rectum at the end of the study, 1500 is the amount of PEG infused and V is the volume of fluid collected.15
In an earlier study NI and HI participants were given an intravenous (IV) infusion of 140 mmol/L sodium acetate13 and AC clearance was measured as follows. AC clearance, C, (ml/min) is the rate at which AC is leaving the blood (i.e. the rate of whole body AC uptake) divided by the concentration of AC in the blood. Since, during the IV AC infusion, when serum AC has reached a steady-state concentration, the rate of whole-body AC uptake, U, is equal to the rate of infusion, therefore:
| [3] |
where I is the AC infusion rate (mmol/min) and [ACss] is the steady-state serum AC concentration (μmol/L).13 As stated earlier, AC clearance C was measured from data obtained from previously published studies in NI and HI participants.13 Thus, if C is known, and the serum AC concentration [AC], is not changing with time, the rate of entry of AC into peripheral blood, X (mmol/min) can be estimated as follows:
| [4] |
Under steady state conditions the rate of appearance of AC would best be reflected over the 20 min period between 20–40 mins. Therefore, the mean rate of entry of AC into peripheral blood after the rectal infusion, X, from equation [4] is equal to:
| [5] |
where, during the rectal infusion, steady state AC concentration is the average of the AC concentrations at 20, 30 and 40 mins and baseline AC is the concentration at 0 min.
The rate of entry of AC in peripheral blood in the fasting state, Xf, is the sum of the rate of endogenous AC production from fat metabolism (Xend) and the rate of exogenous AC production from colonic fermentation (Xexog), thus:
| [6] |
Xend and Xexog were estimated in 2 different ways from fasting and postprandial serum AC concentrations using equation [4]. The first method was based on the assumption that Xexog is suppressed to zero by a low fibre diet. Since subjects consumed a low fibre diet the day before the rectal infusion, but a normal diet the evening before the OGTT; thus:
| [7] |
where [AC]FR is fasting [AC] on the rectal infusion day and [AC]FO is fasting [AC] on the OGTT test day. The second method was based on the assumption that Xexog is suppressed to zero after the consumption of glucose; thus:
| [8] |
where [AC]NO is the nadir of serum AC after 75g oral glucose. In equations [7] and [8], C, [AC]FO and [AC]NO were derived from data in previously published studies in the same NI and HI participants. 13, 14
In equations [7] and [8], [AC]FR and ([AC]FO − [AC]NO) were estimates of the amount of endogenous AC produced from fat metabolism (Pend) and ([AC]FO − [AC]FR) and [AC]NO were estimates of the amount of exogenous AC produced from colonic fermentation (Pexog).
The rate of hepatic uptake of colonic AC (H) was estimated based on our kinetic model as follows:
where A is the rate of AC uptake from the colon calculated from equations [1] and [2], X is the rate of entry of AC into peripheral blood calculated from equation [5] and Xend is the rate of endogenous AC production taken to be the average of values calculated from equations [7] and [8].
Statistical analysis was performed with IBM SPSS Statistics Version 20 using the General Linear Model (GLM) repeated-measures analysis of variance (ANOVA) examining for the main effects of group and time, and interactions between these two effects. The association between two variables was tested by linear regression using GraphPad Prism 5 for Windows, Version 5.02 (GraphPad Software Inc., La Jolla, CA). Statistical analysis of the independent variables was done using the Student t-test (two-tailed) for unpaired data using a computer spreadsheet (Microsoft® Excel 2003, Microsoft Corp, Seattle, WA). Differences with P-values ≤ 0.05 (2-tailed) were considered to be statistically significant. The results are expressed as means ± SEM.
Results
The participants in this study were 11 women and 6 men with a mean (± SEM) age of 36.7 ± 2.2 y and BMI 27.0 ± 0.9 kg/m2. Participants with HI had significantly higher waist circumference, systolic blood pressure, serum insulin, triglycerides and total cholesterol/HDL ratio and a significantly lower HDL concentration than NI participants (Table 1). Mean fasting breath hydrogen (5.9 ± 1.3 ppm) and methane (9.0 ± 2.1 ppm) concentrations in all participants indicate low levels of colonic fermentation. The recovery of PEG in this study was 78.3 ± 9.3%.
Table 1.
Characteristics of the normal (NI) and hyperinsulinaemic (HI) participants at the screening visit.
| NI | HI | P-value | |
|---|---|---|---|
| Age (y) | 35.9 ± 3.8 | 37.5 ± 2.2 | 0.72 |
| M:F | 4 : 5 | 2 : 6 | |
| BMI (kg/m2) | 25.4 ± 1.5 | 28.7 ± 0.7 | 0.07 |
| Waist Circumference (cm) | 87.7 ± 2.7 | 95.2 ± 1.5 | 0.03 |
| Systolic blood pressure (mm Hg) | 109 ± 3 | 119 ± 3 | 0.05 |
| Diastolic blood pressure (mm Hg) | 68 ± 3 | 78 ± 4 | 0.08 |
| Glucose (mmol/L) | 5.0 ± 0.1 | 5.1 ± 0.2 | 0.68 |
| Insulin (pmol/L) | 29.4 ± 2.0 | 75.4 ± 12.7 | 0.01 |
| HCT (L/L) | 0.39 ± 0.01 | 0.40 ± 0.01 | 0.85 |
| AST (U/L) | 18.9 ± 1.3 | 21.8 ± 1.7 | 0.22 |
| CRP (mg/L) | 2.5 ± 1.8 | 2.9 ± 0.7 | 0.81 |
| Cholesterol (mmol/L) | 4.7 ± 0.2 | 5.2 ± 0.5 | 0.34 |
| Triglycerides (mmol/L) | 0.91 ± 0.12 | 1.63 ± 0.3 | 0.05 |
| HDL (mmol/L) | 1.42 ± 0.06 | 1.08 ± 0.08 | 0.01 |
| TC/HDL | 3.33 ± 0.18 | 4.86 ± 0.32 | 0.00 |
| LDL (mmol/L) | 2.84 ± 0.21 | 3.38 ± 0.32 | 0.20 |
Data are presented as mean ± SEM. Abbreviations: HCT, hematocrit; AST, aspartate transaminase; CRP, C-reactive protein; TC, total cholesterol; HDL, high density lipoprotein; LDL, low density lipoprotein.
After rectal infusion of AC the rise in serum concentrations of AC was similar in NI and HI participants (Figure 2). The percent of PEG recovered in the voided solutions was 78.3 ± 9.3%. The percent of rectally infused AC that was absorbed was not significantly different between NI and HI participants (31 ± 11 % vs 35 ± 10 %; P = 0.77). The percent of rectally infused AC that reached the peripheral circulation also did not significantly differ between NI and HI participants (20 ± 4 % vs 22 ± 3 %; P = 0.77). The various estimated parameters of AC metabolism in the NI and HI participants are shown in Table 2. Rate of AC absorption from the distal colon (A), rate of entry of AC into peripheral blood (X), the rate of endogenous AC production (Xend) from fat metabolism, sum of the rate of endogenous and exogenous AC production at fasting (Xf) and the rate of hepatic uptake of AC (H) were not significantly different between the two groups (Table 2) but the rate of exogenous AC production (Xexog) from colonic fermentation significantly differed (P ≤ 0.05) (Table 2).
Figure 2.

Mean (± SEM) serum acetate (AC) concentrations after rectal AC infusion in NI and HI participants.
Table 2.
Measures of AC metabolism in normal (NI) and hyperinsulinaemic (HI) participants.
| NI | HI | P-value | |
|---|---|---|---|
| A (μmol/min) | 279 ± 103 | 322 ± 91 | 0.76 |
| C (ml/min) | 2.11 ± 0.22 | 2.14 ± 0.25 | 0.95 |
| X (μmol/min) | 205 ± 39 | 206 ± 28 | 0.98 |
| Xend (μmol/min) | 81 ± 24 | 35 ± 9 | 0.11 |
| Xexog (μmol/min) | 64 ± 17 | 24 ± 7 | 0.05 |
| Xf (μmol/min) | 145 ± 39 | 59 ± 14 | 0.06 |
| H (μmol/min) | 155 ± 101 | 146 ± 85 | 0.94 |
Data are presented as means ± SEM. Abbreviations: A, Rate of AC absorption from the distal colon; C, AC clearance; H, Rate of hepatic uptake of AC; X, Rate of entry of AC into peripheral blood; Xend, Rate of endogenous AC production from fat metabolism; Xexog, Rate of exogenous AC production from colonic fermentation; Xf, sum of the rate of endogenous and exogenous AC production at fasting (Xend + Xexog).
Estimates of the amount of endogenous AC produced from fat metabolism (Pend) was significantly higher in NI compared to HI participants (33.5 ± 6.5 vs 15.4 ± 2.5 μmol/L; P = 0.03). The amount of exogenous AC produced from colonic fermentation (Pexog) was also significantly higher in NI compared to HI participants (28.6 ± 6.5 vs 13.0 ± 2.7 μmol/L; P ≤ 0.05).
The hepatic uptake of AC was directly proportional to the rate of AC absorption in both groups of participants (NI, r2 = 0.959, P < 0.0001; HI, r2 = 0.973, P < 0.0001) (Figure 3).
Figure 3.

Linear regression analysis between rate of acetate (AC) absorption vs hepatic uptake of AC for NI (r2 = 0.918, P < 0.0001) and HI (r2 = 0.931, P < 0.0001) participants. The regression lines are depicted in the graph.
When participants were considered as a single cohort, fasting plasma AC was inversely proportional to fasting plasma insulin concentrations after the OGTT and OGTT+Inulin tests (Figure 4). The data fit a hyperbolic curve with an equation y=k/x, where k = 1813.
Figure 4.

Relationship between fasting plasma insulin and fasting plasma acetate (AC) concentrations after oral glucose tolerance test (OGTT) and OGTT + Inulin tests in the entire cohort. The line represents hyperbolic function y = k/x where k = 1813.
Discussion
This study was part of a series of studies13, 14 conducted to estimate AC kinetics in NI and HI participants as summarised in Figure 1. In the present study AC absorption from the distal colon was estimated and the results show that AC absorption from the distal colon is similar in NI and HI participants. Previously we have shown that AC clearance is similar in NI and HI participants.13 The data from previous studies13, 14 was used to estimate the rate of entry of AC into peripheral blood and hepatic AC uptake which were not significantly different in the NI and HI participants. But, differences were seen in endogenous and exogenous production of AC which was significantly increased in NI compared to HI participants.
An average intake of dietary fibre in western populations is 20 g/day this corresponds to a colonic SCFA production of ~300 mmol/24h of which ~60% (180mmol) is AC. The amount of AC infused rectally in this study, 27 mmol, is roughly 1/7 the amount of AC produced on a normal western diet and is approximately equal to the amount produced over 4 h. So the amount of AC rectally infused in this study is within physiological limits. The results showed that AC absorption from the distal colon is similar in NI and HI participants. The rate of entry of AC into peripheral blood and hepatic AC uptake was also similar in the two groups. Its unclear if the variability in the PEG recovery or small sample size studied may be the reason significant differences in acetate absorption between the groups was not observed. In earlier work we have studied AC absorption in human participants using the rectal infusion model. 12, 15, 18 We have shown that the rate of AC absorption from the distal colon varies markedly in different subjects.12 An earlier observation that AC metabolism may be altered in HI participants14 led to the study of AC absorption in NI and HI participants which to our knowledge has not been previously investigated. Studying the metabolism of the major SCFA, AC, in NI and HI participants is important in order to understand the role of SCFA in obesity and IR. Recent studies have suggested that the gut microbiota may be associated with obesity as the obesity-associated microbiome has an increased capacity to harvest energy from the diet.20 This would imply that the rates of production, absorption or metabolism of SCFA may vary in IR and obesity although its unclear if such differences contribute to the pathogenesis of obesity and IR.
A linear relationship was observed between rate of absorption and rate of hepatic uptake of AC calculated from rectal AC infusion and clearance data. This shows that hepatic AC uptake is linearly related to its rate of delivery (absorption) and that if absorption rate is low (<~150 μmol/min) then the liver releases AC which is consistent with previous animal and human studies. 19, 21–24 Acetate appearing in systemic blood has two origins: exogenous, from colonic bacterial fermentation21, 23 and endogenous, from amino acid, fatty acid, and glucose metabolism. In the fed state AC is likely to be derived solely from the colon, but during starvation the liver probably regulates production.21 Endogenous AC is derived primarily from tissue metabolism since, AC is used as a fuel by many tissues.19, 25 In this study, endogenous and exogenous production of AC was calculated in two different ways. From the fasting AC concentrations on OGTT and low fibre diet test days and from postprandial AC concentrations on OGTT test day. The morning after the low fibre day at fasting, circulating plasma AC was mainly endogenous (liver) in origin. In contrast, on the OGTT day (when subjects had been on their normal diets the day before) the source of plasma AC at fasting was both endogenous (liver and peripheral tissues) and exogenous (gut). The significantly higher amount of endogenous AC produced (Pend) in NI participants support our earlier findings.14 We also observed that fasting plasma AC was inversely proportional to fasting plasma insulin concentrations in the entire cohort. Previously a negative association between fasting insulin and AC concentrations has been observed.26 Together these results point to an altered endogenous AC metabolism with hyperinsulinaemia, possibly, due to the actions of insulin, as has been previously discussed.14, 27
The increased rate of exogenous AC production (Xexog) in NI as opposed to HI participants go against current hypotheses that seem to suggest that the obesity-associated microbiome has an increased capacity to harvest energy from the diet and produce SCFA.20 Nevertheless, the increased exogenous AC production in NI participants suggests gut microbiota differences exist in the two groups. Studies have also shown that T2DM is characterised by some degree of gut microbial dysbiosis.28–30 To date studies have not been able to pinpoint if there are specific microbiota associated with obesity and T2DM.31 It is also not known how the gut microbial dysbiosis in IR and T2DM affects SCFA production and metabolism and whether the dysbiosis is the cause or result of this condition. Based on animal studies, hypotheses have been proposed which suggest that intestinal microbiota may contribute to the development of inflammation and IR 32, 33 but studies in humans are lacking. Therefore SCFA metabolism and the gut microbiome in IR and T2DM need to be more extensively studied.
This preliminary study had some limitations in study design and methodologies which need to be addressed in future studies. There may be various reasons why differences in AC metabolism between groups were not seen. A couple of drawbacks of the rectal infusion model is the inability in some participants to collect an endpoint sample at the conclusion of the study period and not being able to recover 100% of the PEG infused rectally. The variability in PEG recovery also may have led to low power to detect differences in AC absorption rate and hepatic AC uptake in NI vs HI This may be solved in future studies by using the dialysis bag technique to study AC absorption. The 4 h study period after inulin ingestion may have been too short to observe AC production differences between the two groups and a 6–8 h study period would be better suited to observe production differences. Other limitations of this study include the small sample size and that dietary intakes and gut microbiota were not analysed which would have added useful information.
In summary the results show that rate of AC absorption from the distal colon and hepatic uptake does not significantly vary in NI and HI participants. Acetate clearance is similar in NI and HI participants.13 But, hyperinsulinaemia may alter endogenous and exogenous AC metabolism. The higher exogenous AC production in NI participants suggests that microbial profiles may differ in the two groups. Future studies must therefore compare the gut microbiome in normal and hyperinsulinaemic participants.
Supplementary Material
Acknowledgments
Supported by grant no. OOP-64648 from the Canadian Institutes for Health Research (CIHR), Institute of Nutrition, Metabolism and Diabetes.
Footnotes
Conflict of Interest
The authors declare no conflict of interest.
References
- 1.Sluijs I, van der Schouw YT, van der ADL, Spijkerman AM, Hu FB, Grobbee DE, et al. Carbohydrate quantity and quality and risk of type 2 diabetes in the European Prospective Investigation into Cancer and Nutrition-Netherlands (EPIC-NL) study. Am J Clin Nutr. 2010;92:905–911. doi: 10.3945/ajcn.2010.29620. [DOI] [PubMed] [Google Scholar]
- 2.Anderson JW, Baird P, Davis RH, Jr, Ferreri S, Knudtson M, Koraym A, et al. Health benefits of dietary fiber. Nutr Rev. 2009;67:88–205. doi: 10.1111/j.1753-4887.2009.00189.x. [DOI] [PubMed] [Google Scholar]
- 3.de Munter JSL, Hu FB, Spiegelman D, Franz M, van Dam RM. Whole Grain, Bran, and Germ Intake and Risk of Type 2 Diabetes: A Prospective Cohort Study and Systematic Review. PLoS Med. 2007;4:1385–1394. doi: 10.1371/journal.pmed.0040261. [DOI] [PMC free article] [PubMed] [Google Scholar]
- 4.Montonen J, Knekt P, Jarvinen R, Aromaa A, Reunanen A. Whole-grain and fiber intake and the incidence of type 2 diabetes. Am J Clin Nutr. 2003;77:622–629. doi: 10.1093/ajcn/77.3.622. [DOI] [PubMed] [Google Scholar]
- 5.Isken F, Klaus S, Osterhoff M, Pfeiffer AF, Weickert MO. Effects of long-term soluble vs. insoluble dietary fiber intake on high-fat diet-induced obesity in C57BL/6J mice. J Nutr Biochem. 2010;21 :278–84. doi: 10.1016/j.jnutbio.2008.12.012. [DOI] [PubMed] [Google Scholar]
- 6.Weickert MO, Mohlig M, Schofl C, Arafat AM, Otto B, Viehoff H, et al. Cereal fiber improves whole-body insulin sensitivity in overweight and obese women. Diabetes Care. 2006;29:775–80. doi: 10.2337/diacare.29.04.06.dc05-2374. [DOI] [PubMed] [Google Scholar]
- 7.Weickert MO, Mohlig M, Koebnick C, Holst JJ, Namsolleck P, Ristow M, et al. Impact of cereal fibre on glucose-regulating factors. Diabetologia 2005. 2005;48:2343–2353. doi: 10.1007/s00125-005-1941-x. [DOI] [PubMed] [Google Scholar]
- 8.Hoverstad T, Bohmer T, Fausa O. Absorption of short-chain fatty acids from the human colon measured by the “CO2 breath test. Scand J Gastroenterol. 1982;17:373–378. doi: 10.3109/00365528209182070. [DOI] [PubMed] [Google Scholar]
- 9.Ruppin H, Bar-Meir S, Soergel K, H’Wood CM, Schmitt MG. Absorption of short-chain fatty acids by the colon. Gastroenterology. 1980;78:1500–1507. [PubMed] [Google Scholar]
- 10.McNeil NI, Cummings JH, James WPT. Short-chain fatty acid absorption by the human large intestine. Gut. 1978;19:19–22. doi: 10.1136/gut.19.9.819. [DOI] [PMC free article] [PubMed] [Google Scholar]
- 11.Cummings JH, Branch WJ. Fermentation and the production of short-chain fatty acids in the human large intestine. In: Vahouny GV, Kritchevsky D, editors. Dietary fiber: basic and clinical aspects. Plenum Press; New York, USA: 1986. pp. 131–149. [Google Scholar]
- 12.Wolever TMS, Spadafora P, Eshuis H. Interaction between colonic acetate and propionate in humans. Am J Clin Nutr. 1991;53:681–687. doi: 10.1093/ajcn/53.3.681. [DOI] [PubMed] [Google Scholar]
- 13.Fernandes J, Vogt J, Wolever TMS. Intravenous acetate elicits a greater free fatty acid rebound in normal than hyperinsulinaemic humans. Eu J Clin Nutr. 2012;66:1029–1034. doi: 10.1038/ejcn.2012.98. [DOI] [PMC free article] [PubMed] [Google Scholar]
- 14.Fernandes J, Vogt J, Wolever TMS. Inulin increases short-term markers for colonic fermentation similarly in healthy and hyperinsulinaemic humans. Eu J Clin Nutr. 2011;65:1279–1286. doi: 10.1038/ejcn.2011.116. [DOI] [PMC free article] [PubMed] [Google Scholar]
- 15.Vogt JA, Wolever TMS. Fecal acetate is inversely related to acetate absorption from the human rectum and distal colon. J Nutr. 2003;133:3145–3148. doi: 10.1093/jn/133.10.3145. [DOI] [PubMed] [Google Scholar]
- 16.Yeni-Komshian H, Carantoni M, Abbasi F, Reaven GM. Relationship between several surrogate estimates of insulin resistance and quantification of insulin-mediated glucose disposal in 490 healthy nondiabetic volunteers. Diabetes Care. 2000;23:171–175. doi: 10.2337/diacare.23.2.171. [DOI] [PubMed] [Google Scholar]
- 17.Tollinger CD, Vreman HJ, Wiener MW. Measurement of acetate in human blood by gas chromatography: effects of sample preparation, feeding and various diseases. Clin Chem. 1991;53:681–687. [PubMed] [Google Scholar]
- 18.Wolever TMS, Brighenti F, Jenkins DJA. Serum short chain fatty acids after rectal infusion of acetate and propionate in man. J Clin Nutr Gastroenterol. 1988;3:42–46. [Google Scholar]
- 19.Skutches CL, Holroyde CP, Myers RN, Paul P, Reichard GA. Plasma acetate turnover and oxidation. J Clin Invest. 1979;64:708–713. doi: 10.1172/JCI109513. [DOI] [PMC free article] [PubMed] [Google Scholar]
- 20.Turnbaugh PJ, Ley RE, Mahowald MA, Magrini V, Mardis ER, Gordon JI. An obesity-associated gut microbiome with increased capacity for energy harvest. Nature. 2006;444:1027–1131. doi: 10.1038/nature05414. [DOI] [PubMed] [Google Scholar]
- 21.Sheppach W, Pomare EW, Elia M, Cummings JH. The contribution of the large intestine to blood acetate in man. Clin Sci. 1991;80:177–182. doi: 10.1042/cs0800177. [DOI] [PubMed] [Google Scholar]
- 22.Snoswell AM, Trimble RP, Fishlock RC, Storer GB, Topping DL. Metabolic effects of acetate in perfused rat liver: studies on ketogenesis, glucose output, lactate uptake and lipogenesis. Biochim Biophys Acta. 1982;716:290–297. doi: 10.1016/0304-4165(82)90019-8. [DOI] [PubMed] [Google Scholar]
- 23.Buckley BM, Williamson DH. Origin of blood acetate in the rat. Biochem J. 1977;166:539–545. doi: 10.1042/bj1660539. [DOI] [PMC free article] [PubMed] [Google Scholar]
- 24.Seufert CD, Graf M, Janson G, Kuhn A, Söling HD. Formation of free acetate by isolated perfused livers from normal, starved and diabetic rats. Biochem Biophys Res Commun. 1974;57:901–909. doi: 10.1016/0006-291x(74)90631-7. [DOI] [PubMed] [Google Scholar]
- 25.Lundquist F, Sestoft L, Damgaard SE, Clausen JP, Trap-Jensen J. Utilization of acetate in the human forearm during exercise after ethanol ingestion. J Clin Invest. 1973;52:3231–3235. doi: 10.1172/JCI107523. [DOI] [PMC free article] [PubMed] [Google Scholar]
- 26.Layden BT, Yalamanchi SK, Wolever TM, Dunaif A, Lowe WL., Jr Negative association of acetate with visceral adipose tissue and insulin levels. Diabetes Metab Syndr Obes. 2012;5:49–55. doi: 10.2147/DMSO.S29244. [DOI] [PMC free article] [PubMed] [Google Scholar]
- 27.Piloquet H, Ferchaud-Roucher V, Duengler F, Zair Y, Maugere P, Krempf M. Insulin effects on acetate metabolism. Am J Physiol Endocrinol Metab. 2003;285:E561–E565. doi: 10.1152/ajpendo.00042.2003. [DOI] [PubMed] [Google Scholar]
- 28.Quin J, Li Y, Cai Z, Li S, Zhu J, Zhang F, et al. A metagenome-wide association study of gut microbiota in type 2 diabetes. Nature. 2012;490:55–60. doi: 10.1038/nature11450. [DOI] [PubMed] [Google Scholar]
- 29.Larsen N, Vogensen FK, van den Berg FW, Nielsen DS, Andreasen AS, Pedersen BK, et al. Gut microbiota in human adults with type 2 diabetes differs from nondiabetic adults. PLoS One. 2010;5:e9085. doi: 10.1371/journal.pone.0009085. [DOI] [PMC free article] [PubMed] [Google Scholar]
- 30.Wu X, Ma C, Han L, Nawaz M, Gao F, Zhang X, et al. Molecular characterisation of the faecal microbiota in patients with type II diabetes. Curr Microbiol. 2010;61:69–78. doi: 10.1007/s00284-010-9582-9. [DOI] [PubMed] [Google Scholar]
- 31.Esteve E, Ricart W, Fernández-Real JM. Gut microbiota interactions with obesity, insulin resistance and type 2 diabetes: did gut microbiote co-evolve with insulin resistance? Curr Opin Clin Nutr Metab Care. 2011;14:483–490. doi: 10.1097/MCO.0b013e328348c06d. [DOI] [PubMed] [Google Scholar]
- 32.De Bandt JP, Waligora-Dupriet AJ, Butel MJ. Intestinal microbiota in inflammation and insulin resistance: relevance to humans. Curr Opin Clin Nutr Metab Care. 2011;14:334–340. doi: 10.1097/MCO.0b013e328347924a. [DOI] [PubMed] [Google Scholar]
- 33.Diamant M, Blaak EE, de Vos WM. Do nutrient-gut-microbiota interactions play a role in human obesity, insulin resistance and type 2 diabetes? Obes Rev. 2011;12:272–281. doi: 10.1111/j.1467-789X.2010.00797.x. [DOI] [PubMed] [Google Scholar]
Associated Data
This section collects any data citations, data availability statements, or supplementary materials included in this article.