Abstract
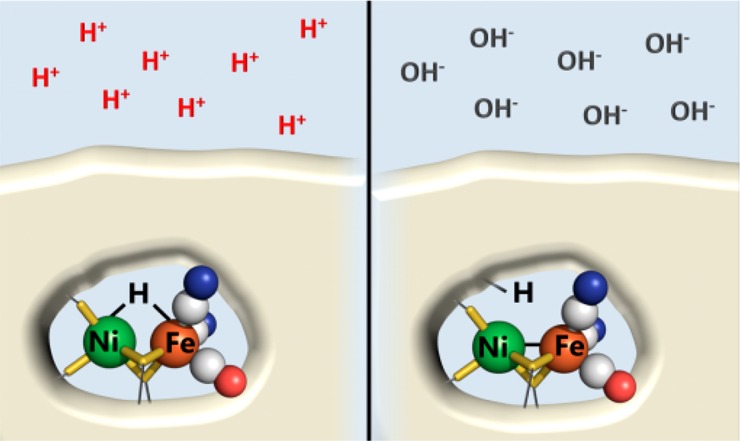
Despite extensive studies on [NiFe]-hydrogenases, the mechanism by which these enzymes produce and activate H2 so efficiently remains unclear. A well-known EPR-active state produced under H2 and known as Ni-C is assigned as a NiIII–FeII species with a hydrido ligand in the bridging position between the two metals. It has long been known that low-temperature photolysis of Ni-C yields distinctive EPR-active states, collectively termed Ni-L, that are attributed to migration of the bridging-H species as a proton; however, Ni-L has mainly been regarded as an artifact with no mechanistic relevance. It is now demonstrated, based on EPR and infrared spectroscopic studies, that the Ni-C to Ni-L interconversion in Hydrogenase-1 (Hyd-1) from Escherichia coli is a pH-dependent process that proceeds readily in the dark—proton migration from Ni-C being favored as the pH is increased. The persistence of Ni-L in Hyd-1 must relate to unassigned differences in proton affinities of metal and adjacent amino acid sites, although the unusually high reduction potentials of the adjacent Fe–S centers in this O2-tolerant hydrogenase might also be a contributory factor, impeding elementary electron transfer off the [NiFe] site after proton departure. The results provide compelling evidence that Ni-L is a true, albeit elusive, catalytic intermediate of [NiFe]-hydrogenases.
Introduction
Hydrogenases are Ni- and Fe-based enzymes that catalyze highly efficient and reversible H2 cycling.1,2 A major class known as [NiFe]-hydrogenases activate H2 at a buried binuclear site formulated as [(Cys-S)2-Ni-(μ2-Cys-S)2-Fe(CN)2CO] that is served by an electron relay system of Fe–S clusters. Although physical techniques such as EPR and IR spectroscopy have played important roles in the characterization of different states of the enzyme, no consensus exists regarding the detailed mechanism. However, there is general agreement that reaction with H2 leads to a sequence of the catalytic cycle (see Scheme 1 and legend) in which an H2-reduced state known as Ni-R which contains a bridging hydrido ligand3 is oxidized in two one-electron steps to a state known as Ni-SI (also known as Ni-S), Ni-R and Ni-SI states of the active site each being EPR-silent.1 The one-electron intermediate state known as Ni-C, which is EPR-active, retains the hydrido ligand in the bridging position between Ni and Fe.4−6 At cryogenic temperatures, exposure of Ni-C to visible light results in the formation of states collectively known as Ni-L;7−11 more than one Ni-L species is usually observed, and the spectroscopic signatures are often referred to as Ni-L1, Ni-L2, etc. Detailed EPR investigations have indicated that during photolysis, the bridging hydride assigned to Ni-C is released as a proton, which is assumed to migrate to one or more nearby amino acids, including coordinated cysteine, in the Ni-L states.12,13 Consequently, Ni-C and Ni-L species, although usually assigned as Ni(III) and Ni(I) states, respectively, can be regarded as tautomeric forms of the extended active site at a single oxidation level.12
Scheme 1. A Consensus Generic Catalytic Cycle for [NiFe]-Hydrogenases.
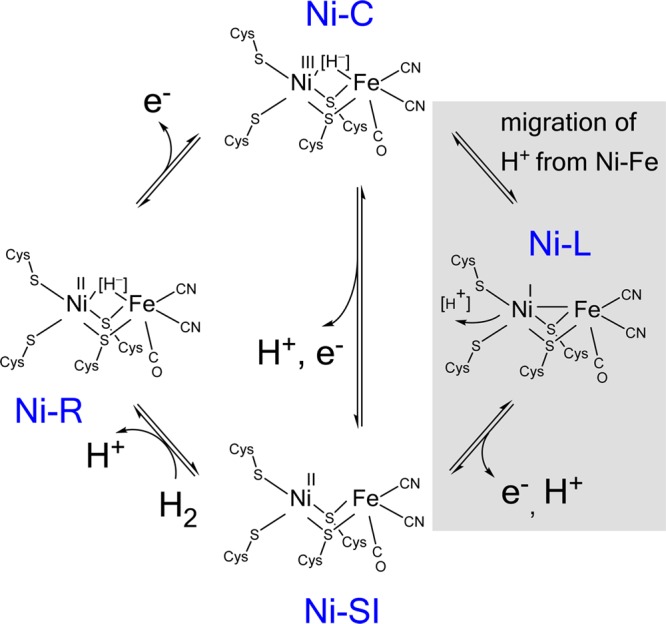
The shaded area shows a pathway that includes Ni-L as an intermediate, in which the proton has started its migration before electron transfer.
Scheme 1 includes the possibility (shown in gray) that conversion of Ni-C to Ni-SI during the catalytic cycle involves Ni-L as an intermediate. The fact that Ni-L has mainly been reported to appear only upon illumination and at cryogenic temperatures has resulted in it generally being considered only as an artifact: yet, despite this distraction, considerable interest in Ni-L has persisted, not least because its electronic structure and relationship with Ni-C provide important fundamental insight and predictions that can be tested using model complexes.14 Neese and co-workers have compared the spectroscopic properties and electronic structures of Ni-C and Ni-L and suggested that it is realistic to consider that Ni-L contains a metal–metal bond in the form of an electron pair donated from Ni(I) to Fe(II).12 Protonation of this dative metal–metal bond gives rise to Ni-C, the Ni becoming formally oxidized to Ni(III) as the proton takes on hydridic character.6 Inclusion of Ni-L, even transiently, avoids the restriction that interconversion between Ni-C and Ni-SI would require simultaneous elementary proton and electron transfers, allowing instead the bridging hydride to relocate (as a proton) before an electron is removed. Consequently, Ni-L should appear as a catalytic intermediate, detectable in at least one direction (in this case oxidation), if electron transfer is sufficiently slower than proton transfer.
There is indeed increasing evidence to suggest a direct role for Ni-L in the catalytic cycle. Earlier DFT studies of the catalytic cycle provided support for a process in which deprotonation of a Ni(III) state with bridging hydride occurs to give a Ni(I) state having a structure consistent with that suggested for Ni-L.15,16 Lindahl included Ni-L in the catalytic cycle as part of a 2012 paper dealing with metal–metal bonds in enzymes.17 Some recent experimental findings also shed doubt on whether Ni-L is merely an artifact. The observation most relevant to this paper is that EPR spectra of samples of Hydrogenase-1 (Hyd-1) from Escherichia coli prepared under H2 at pH 6 are dominated by signals attributable to Ni-L, as opposed to Ni-C, even when the samples have been exposed only to low ambient light.18 It may be significant, as discussed later, that Hyd-1 is an O2-tolerant [NiFe]-hydrogenase, a special class that can operate in the presence of O2 that differs from “standard” (O2-sensitive) [NiFe]-hydrogenases mainly in the composition and reduction potentials of Fe–S clusters in the electron relay.19−26 The O2-tolerant membrane-bound hydrogenase from Ralstonia eutropha also shows signals attributable to Ni-L without illumination.27 Notably, another O2-tolerant [NiFe]-hydrogenase (Hase I from Aquifex aeolicus) displays the characteristic EPR spectrum of Ni-C when reduced with H2, but the bridging hydrido ligand is weakly bound compared to standard [NiFe]-hydrogenases, and even EPR spectra measured without illumination indicate the presence of small amounts of Ni-L.28 In a study29 of the standard [NiFe]-hydrogenase from Desulfovibrio vulgaris Miyazaki F, it was found that low-temperature illumination of a sample of Ni-C to produce the Ni-L state resulted in significant formation of Ni-SI only when the enzyme was held under an atmosphere of N2 instead of H2. The effect of removing or adding H2 was attributed to differences in the redox state of the proximal Fe–S cluster, which was proposed to act as a “gate” for the transition from Ni-C to Ni-SI in the catalytic cycle. According to this hypothesis, if the proximal cluster is reduced (as favored under H2), the elementary one-electron transfer from Ni-L to yield Ni-SI is impeded. Most recently, a transient species termed “Ni-I” has been detected spectroscopically upon phototriggered chemical reduction of the Ni-SI state of a [NiFe]-hydrogenase from Pyrococcus furiosus, and suggested, tentatively, to be identical to one of the Ni-L species.30
Here, we present new results obtained in a study of Hyd-1 from E. coli. Following up on the original observations mentioned above,18 we have conducted potential-controlled experiments over a wide pH range, using both EPR and IR spectroscopy. Our investigations reveal, unambiguously, that a pH-dependent interconversion between Ni-L and Ni-C occurs freely, and in the dark, and Ni-L is favored under more basic conditions. The IR measurements show that interconversion is fully reversible even at room temperature, and pulse EPR studies show that low-temperature illumination of the Ni-C state that dominates at low pH yields a Ni-L state, as expected. As confirmed by EPR spectra at 10 K, both proximal and medial clusters are reduced at the potentials chosen for the measurements, offering one clue as to why the experiments with Hyd-1 readily reveal such an otherwise reactive state.
Methods
Hyd-1 was purified from E. coli cells as previously described and stored in liquid N2.23 All reagents used to prepare spectroscopic samples were of analytical grade and high-purity water (Milli-Q, Millipore 18 MΩ cm) was used throughout. All gases were supplied by BOC.
For continuous wave (CW) EPR spectroscopy, measurements were carried out using an X-band (9.1–9.9 GHz) EMX spectrometer (Bruker BioSpin) equipped with an X-band superhigh-sensitivity probehead (Bruker). Background spectra were recorded for the empty resonator and subtracted from all experimental scans and EPR simulations were performed in MATLAB, using the EasySpin toolbox.31 For X-band pulse EPR spectroscopy, a Bruker BioSpin EleXsys E680 was used with a MD5 resonator in an Oxford Instruments CF-935 cryostat. Samples were prepared by exchanging samples of Hyd-1 into buffer solutions containing 0.1 M sodium phosphate, 0.05 M sodium succinate, 0.05 M sodium chloride and 10% glycerol. The buffer salts were chosen to provide buffering capacity over a wide range of pH values (pKa values = 2.15, 7.20 for phosphate; 4.21, 5.64 for succinate) while minimizing the change in pH with temperature (d(pKa)/dT = 0.0044, −0.0028, −0.0018, 0.0, respectively).32,33 Samples were prepared in a water-jacketed glass cell containing a small stirrer bar, that included a micro-pH electrode (Orion 9110DJWP double-junction) to allow pH adjustment with small volumes of NaOH and HCl. The cell also contained a Ag/AgCl microelectrode (WPI, DRIREF-2), calibrated with quinhydrone at pH 4 and 7, as combined reference/counter electrode, and a platinum wire as working electrode. The potential was monitored using a PGSTAT128N potentiostat (Metrohm Autolab), and all values were converted to the Standard Hydrogen Electrode (SHE) scale using the correction ESHE = EAg/AgCl + 0.207 V at 20 °C. The enzyme solution in pH 6 buffer was first activated by reducing under a flow of H2 for between 30 and 40 h, which ensured that even recalcitrant states (including Ni-A and other “unready” states) were activated.34 The redox mediators benzyl viologen, methyl viologen and 2-hydroxy-1,4-naphthoquinone were added in approximate molar equivalence to the enzyme to ensure that equilibration times were minimized.35 The pH of the solution was then adjusted by addition of small volumes of NaOH or HCl, and a sample was taken at each pH in turn. The potential was adjusted, as needed, to more positive values by adding small volumes of a solution of K3[Fe(CN)6] (0.20 M) and to more negative values by including H2 (1–2%) to the continuous flow of Ar (50 sccm) that was maintained during the titration using a mass flow controller (Sierra Instruments). Once the desired electrochemical potential was reached and had stabilized, samples were transferred quickly to 3.8 mm standard quartz EPR tubes, using the gas flow pressure to force enzyme solution through a narrow stainless steel delivery tube. After each enzyme sample was transferred, the EPR tube was covered with an Al foil jacket to block all ambient light; then, after 1 min in the dark at room temperature, the sample was flash-frozen in liquid N2. All potentials are stated as the reading made at the time of transfer of enzyme to the tube, and errors are estimated to be at least ±5 mV. The entire sample-making process was carried out under N2 in a glovebox (<5 ppm of O2, Belle Technology). An infrared camera with low-power 940 nm LED illumination was used to guide removal of the foil cover and transfer of the sample into the EPR spectrometer. Photoconversion of the samples from Ni-C to Ni-L was achieved with either a low-intensity light source (Newport Oriel 300 W Xe arc lamp with a 10 cm water filter and liquid light guide) for the CW EPR experiments, or an Opotek, Inc. Opolette HE 355 laser tuned to 550 nm for the study made with X-band HYSCORE.
For attenuated total reflectance (ATR)-IR spectroelectrochemistry, sample preparation and measurements were carried out in a N2-filled glovebox (<1 ppm of O2, Glovebox Technology Ltd.). Spectra were recorded using a Varian 680-IR spectrometer equipped with a liquid N2-cooled mercury cadmium telluride detector and a custom-modified ATR accessory (GladiATR, PIKE Technologies) with a Si internal reflection element (IRE, Crystal Gmbh). Hyd-1 was adsorbed on carbon black particles (BP2000, Cabot Corporation) by mixing a sample (40 μL, 6.3 mg mL–1) with an aqueous dispersion of carbon black (5 μL, 20 mg mL–1) and incubating at 0 °C for 1.5 h before washing the particles to remove unadsorbed enzyme. Enzyme-modified particles (1 μL of the final dispersion) were then deposited onto the Si IRE. The working electrode comprised the layer of enzyme-modified carbon black particles covered with a piece of carbon paper (Toray) and a graphite rod connector. The ATR-IR spectroelectrochemical cell was also equipped with a saturated calomel reference electrode (SCE) and a platinum wire counter electrode. Potentials were converted to the SHE scale using ESHE = ESCE + 0.241 V at 20 °C. The cell design prevented exposure of the enzyme sample to UV–visible light during experiments. The adsorbed Hyd-1 was activated in pH 6 buffer, at a potential of −594 mV under 1 bar H2 for 1 h (see Supporting Information, Figure S1). For potential-controlled IR measurements at different pH values, the cell was filled with the solution buffered at the desired pH, then spectra were recorded (at 4 cm–1 resolution with an acquisition time of 345 s) at specific potentials under static solution conditions (allowing H2, an inhibitor, to accumulate and suppress turnover). The potential was controlled using an Autolab PGSTAT128N potentiostat (Metrohm Autolab). Baseline subtraction was carried out using Origin 9.1, and special care was taken to avoid distorting peak shapes through the choice of baseline anchors with reference to corresponding second derivative spectra.
Results
A set of EPR spectra measured at 60 K showing the interconversion between E. coli Hyd-1 Ni-L and Ni-C as a function of pH is shown in Figure 1. The potential was varied to compensate for the pH-potential dependence (vide infra) that affects the optimum signal intensity. At pH 8.0 and at a potential of −279 mV, the EPR spectrum, with gx = 2.33, gy = 2.14 and gz = 2.05, is similar to examples recorded previously for the dominant Ni-L state that is generated in various [NiFe]-hydrogenases by low-temperature illumination.11,27,36 At pH 3.0, −60 mV, the spectrum has converted to that of Ni-C, with gx = 2.21, gy = 2.14 and gz = 2.01. Viewed overall, Ni-L converts to Ni-C as the pH is decreased, although faint signals with g values similar to those reported for the Ni-L2 and Ni-L3 states of R. eutropha MBH (gxyz = 2.27, 2.11, 2.05 and gxyz = 2.24, 2.11, 2.05, respectively) persist even at pH 3.0.27,36 The three-line feature centered at g = 2.01 has been noted in other reports: it becomes most prominent at pH 3.0 and mostly likely stems from degraded enzyme.18,28,37
Figure 1.
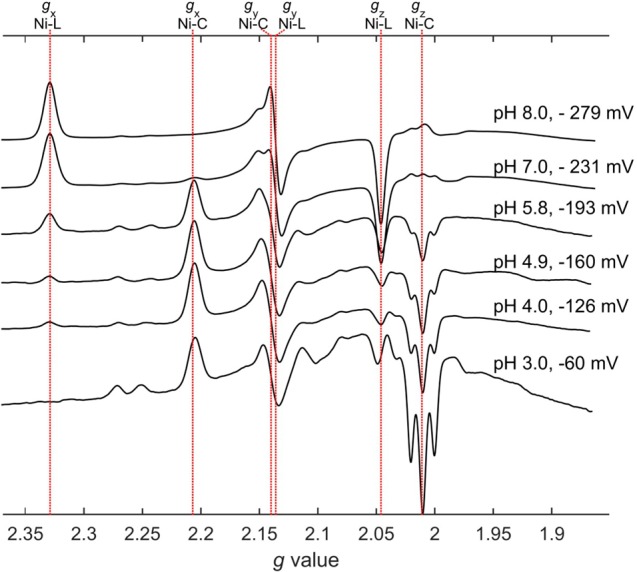
X-band CW spectra of Hyd-1 showing how the relative proportions of Ni-C and Ni-L states change as a function of pH. The potential has been varied in order to maintain a maximum level of the total signals due to Ni-L and Ni-C. Conditions for measuring spectra: T = 60 K, microwave power = 2.0 mW, modulation amplitude 5.0 G. Spectra have been scaled with respect to a constant amplitude, summed over Ni-L and Ni-C, of the gx component.
Figure 2 shows the νCO region of IR spectra recorded for Hyd-1 at pH 3 and pH 9, at potentials −54 and −334 mV, respectively. The assignment of peaks to specific active-site states is fully consistent with that reported for other hydrogenases.1 Specifically, the peaks at 1867 and 1877 cm–1 correlate closely with previously reported νCO bands for Ni-L states produced by low-temperature illumination of Ni-C in the enzyme (Hase I) from A. aeolicus.28 The spectrum recorded at pH 3 shows a high concentration of Ni-C (1952 cm–1) with small amounts of Ni-L together with some Ni-SI and Ni-R. The spectrum at pH 9.0 shows Ni-L and Ni-R states with no Ni-C.
Figure 2.
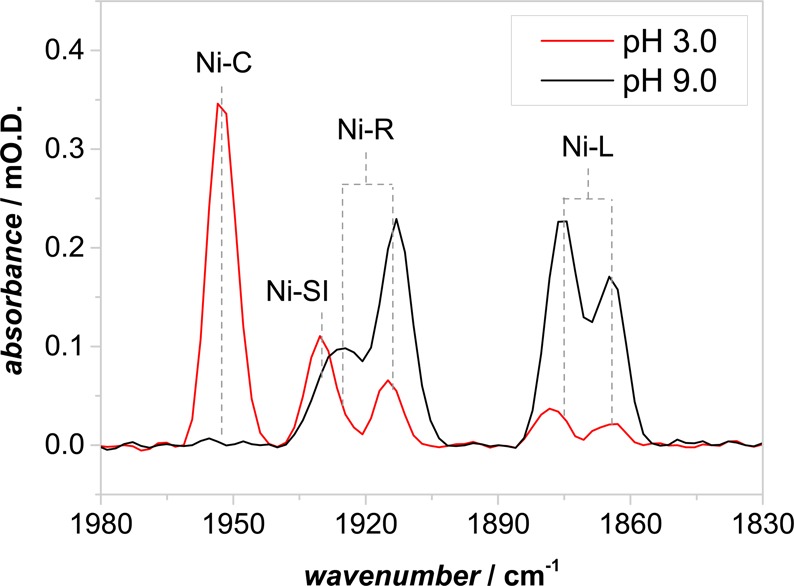
Infrared spectra showing the νCO region of Hyd-1, recorded at pH 9.0 (−334 mV) and pH 3.0 (−54 mV) in the dark at 20 °C.
Figure 3 shows how the concentrations of the Ni-C and Ni-L states, as measured by the IR intensity of the νCO bands, depend upon potential for three different pH values, pH 8, 6, and 4. Although the ratio between Ni-C and Ni-L depends on pH, the two species share the same potential dependence, which averages approximately −0.048 V/pH unit over the entire pH range (Supporting Information Figure S2). This slope signifies a one-electron transfer process coupled to one-proton transfers occurring at multiple sites having a spread of pK values. Although there was no merit in attempting to analyze the dependence further, the data were used to select potentials for the EPR and IR measurements shown in Figures 1 and 2 in order to optimize the signal strength from Ni-L and Ni-C species. The results shown in Figure 3 are also significant because they show that the effect of pH is to influence more where the proton resides within the enzyme (either on a metal or an amino acid) rather than simply control the overall acid–base equilibrium with solvent.
Figure 3.
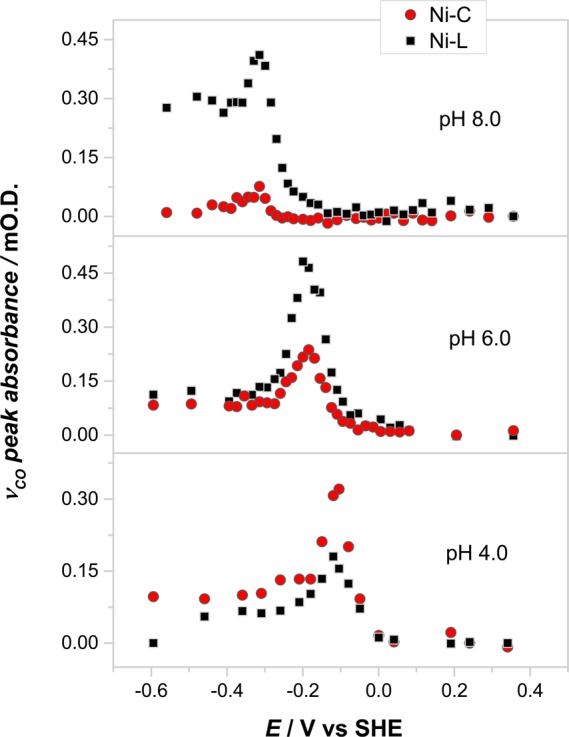
pH dependence of [Ni-C + Ni-L] speciation as a function of potential as measured by IR spectroscopy. The Ni-L quantities are summations for the different Ni-L signals observed.
Figure 4 summarizes the results of pH titrations, in which the proportions of Ni-C and Ni-L species, observed by both IR and EPR spectroscopies, are plotted together as a function of pH. The IR data were obtained at ambient temperature with direct electrochemical control and have not been normalized. Catalytic turnover (proton reduction) observed by protein film electrochemistry in Hyd-1 samples at low pH38 was suppressed by accumulation of H2 under the static conditions at the electrode surface. In contrast, the EPR data were obtained with frozen samples prepared under equilibrium conditions with trace H2 present to adjust the potential. Despite these very significant differences in sample preparation, which probably underlie the fact that the two experiments observe different distributions of Ni-L species, the data obtained by the two methods are in broad agreement and show that Ni-L and Ni-C interconvert simply by changing the pH. The differences in detail, i.e., the shifts in crossover point and the fact that the EPR data follow more closely a curve appropriate for a single protonation site whereas the IR data indicate more than one site, must be judged against the facts that the temperature at which the samples are measured differs by over 230 K and we are comparing fluid and frozen states.
Figure 4.
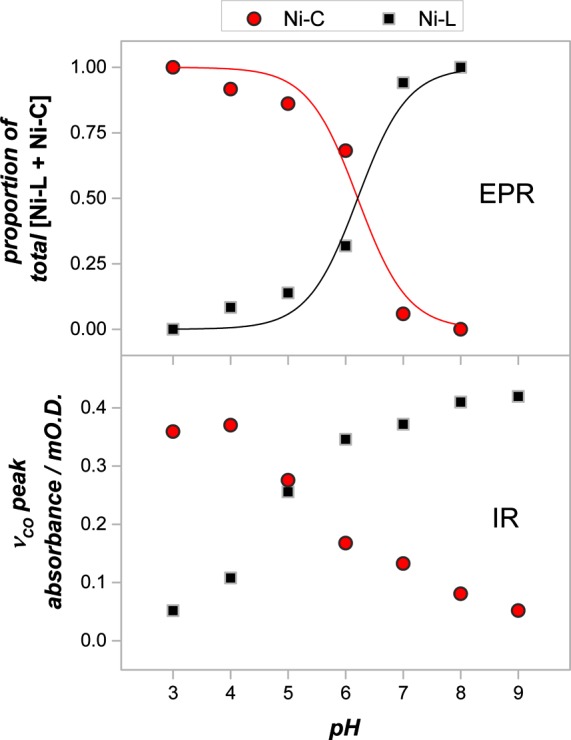
pH dependence of the amounts of Ni-C vs Ni-L as observed by EPR spectroscopy (upper panel) and IR spectroscopy (lower panel). All data were recorded at potentials optimizing the total [Ni-C + Ni-L] as indicated in Figure 3. The upper panel includes guide curves that indicate how well the EPR data conform to a single one-proton equilibrium; the lower panel shows amplitudes as obtained after baseline subtraction (see Methods) and are not normalized.
Earlier EPR-based redox titrations on Hyd-1 established the midpoint potential for the proximal [4Fe–3S]4+/3+ and medial [3Fe–4S]+/0 couples to be +30 and +190 mV, respectively, at pH 6.0.18 Accordingly, the presence of reduced proximal ([4Fe–3S]3+) and medial ([3Fe–4S]0) clusters in the samples prepared for Figure 1 was confirmed by the EPR spectra of those same samples measured at 10 K (Figure 5). The low-temperature spectra also reveal splitting of the Ni-C and Ni-L signals (easily observed in the gx component) due to spin coupling with the proximal [4Fe–3S]3+ cluster (S = 1/2).
Figure 5.
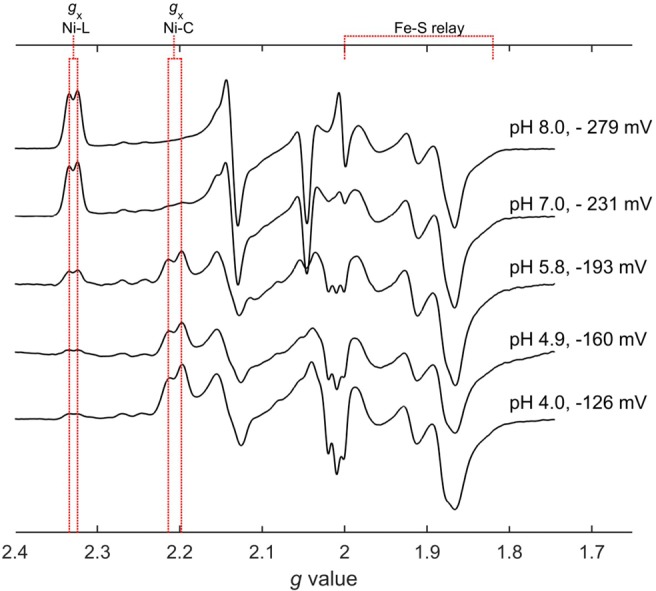
X-band CW spectra measured at 10 K showing that the proximal [4Fe–3S] cluster is in its most reduced (3+) state (S = 1/2, gav ∼ 1.85–2) under all conditions, for both Ni-L and Ni-C species. The Ni-C and Ni-L peaks are split due to spin-coupling between Ni and reduced proximal cluster. All stated potentials are relative to SHE. Conditions for measuring spectra: Microwave power = 7.7 μW, microwave frequency = 9.38 GHz, modulation amplitude = 5.0 G, receiver gain = 55 dB. Spectra have been scaled as for Figure 1.
To address whether the Ni-C species prepared at pH 4.0 is “normal”, i.e., it contains a strongly coupled proton (Ni-coordinated hydrido ligand) that can be photolyzed, we performed X-band HYSCORE before and after illumination. As seen in Supporting Information (Figure S3), the simulations of the HYSCORE spectra observed at g = 2.18 agree well with the hyperfine coupling values reported for the Ni-C species formed in the regulatory [NiFe]-hydrogenase from R. eutropha.4 The hydride signal photolyzes at low temperature and anneals at 200 K, as also observed previously.4 Continuous wave EPR spectra measured before and after illumination (Supporting Information Figure S4) reveal almost complete conversion of Ni-C to Ni-L (as observed at gz) but with more than one Ni-L species being formed, as evident from the two values for gx.
Discussion
Our results reveal that a reaction pathway from Ni-C to Ni-SI via a stable Ni-L state, in which H+ has started its migration from the Ni–Fe bond, is fully appropriate for Hyd-1. The EPR data at high pH show a single Ni-L state, whereas the IR data show two Ni-L states: that more than one Ni-L state exists, albeit depending on enzyme and conditions, is fully in accordance with the findings of others.7−11,27,36 It has long been tacitly assumed, on the basis that Ni-L is detected only under unusual conditions, that oxidation of Ni-C proceeds in a single proton-coupled electron-transfer (PCET) process. This scenario would either involve synchronous proton–electron transfer or at least require that proton transfer is rate-limiting for no intermediate to be detected. The discovery of a pH-dependent equilibrium between the Ni-C and Ni-L states of Hyd-1 now shows that the proton and electron transfer steps need not be coupled, and it is worth considering why this is so easily observed in Hyd-1.
The facts that both Ni-L and Ni-C species are isopotential over a wide pH range (Figure 3) while the reduction potential for the couple [Ni-C/Ni-L]-to-[Ni-SI] shows a −0.05 V/pH slope over the same range (one-electron transfer coupled to single proton transfer at more than one site) mean that both Ni-C and Ni-L bind a single H+ (albeit at different sites in the extended active-site region) that escapes to solvent only when oxidation to Ni-SI occurs. This result is fully consistent with the Ni-C to Ni-L conversion involving the proton migrating only a short internal distance, so it remains within the extended active site or its close surroundings. At the same time, the active site is able to “sense” the external pH, which favors Ni-L at high pH and Ni-C at low pH, in other words (and following the interpretation of Neese and co-workers12) the proton affinity of the acceptor site increases relative to that of the Ni–Fe bond as the pH increases. The immediate proton acceptor has been proposed to be one of the terminal thiolate ligands to Ni39 (which connects, via a conserved glutamate,40 to a proton-transfer pathway to bulk solvent), although this is not so far proven.
In terms of the identity and arrangement of atoms, the region around the active site of Hyd-1 is very similar to that of other [NiFe]-hydrogenases. Subtle structural features which may alter the difference in proton affinity between the Ni–Fe bond and neighboring acceptor sites and thus shift the tautomeric equilibrium, may be difficult to detect. In studies of the O2-tolerant Hase I from A. aeolicus, it was noted that the hydride ligand in the Ni-C state appeared less tightly bound than in O2-sensitive hydrogenases.28 Indeed, the EPR spectra of Hase I prepared at pH values above 6.4, under dark conditions, also showed trace amounts of Ni-L in addition to Ni-C.
It was shown by Lubitz and co-workers that photolysis of a deuteride between the Ni and Fe leads to a spectrum having only small 2H hyperfine couplings, consistent with weakly coupled, exchangeable deuteron locations.4 With the HYSCORE data acquired for Ni-C prepared at pH 4.0 (Supporting Information, Figure S3) the largely dipolar hyperfine coupling of the bridging hydride is replaced, upon photolysis, by signals that are characteristic of cysteine ligand β-protons with large isotropic components related to their beta dihedral angle.41 The heterogeneity of Ni-L species that appear under different conditions is probably a consequence of the Ni-L protonation sites varying in their proton affinities and in the distances over which the proton has to transfer.
Taking these facts together, the logical conclusion is that Ni-L is a true intermediate, in this case a state in which the proton has started its migration from the active site ahead of electron transfer. The results herein complement those described in the recent report by Tai et al.29 who proposed that the Ni-C to Ni-SI conversion is “gated” by the redox state of the proximal Fe–S cluster. It may be no coincidence that Hyd-1 and similar O2-tolerant [NiFe]-hydrogenases are characterized not only by the presence of the unusual [4Fe–3S]5+/4+/3+ cluster that can transfer an extra electron, but also by the fact that both proximal and medial clusters have unusually high reduction potentials,18,22 which are significantly more positive than the Ni-SI/Ni-L potential under any pH conditions (Figure 3). Consequently, a kinetic argument favoring the appearance of Ni-L is that at the potentials required to optimize both Ni-C and Ni-L in Hyd-1, the immediate electron acceptor sites are fully occupied (Figure 5), impeding the elementary electron transfer step that converts Ni-L to Ni-SI. Assuming the proton associated with Ni-L can escape easily to solvent, it follows that Ni-L rather than Ni-C should be the dominant catalytic intermediate at the one-electron stage, because the electron transfer that converts Ni-L to Ni-SI, which can react with H2 to restart the catalytic cycle, may become rate limiting.
The wide pH dependence of the Ni-C/Ni-L ratio shows that the shift in proton affinity from the Ni–Fe bond to an adjacent base located in the extended active site is controlled by a mechanism that allows the active site to sense and respond to the external pH. The transition (particularly as observed by IR at ambient temperature) does not follow any simple fit to a single proton equilibrium, and it is likely that the switch between Ni-C and Ni-L involves pH-sensitive changes in the alignment of the many proton-transferring groups that lead from the enzyme surface to the active site. Nor does the shift correspond to any change in absolute activity of the enzyme, although Hyd-1 becomes a proficient H2 producer at low pH,38 a property that is attributed to the improved matching in potentials between the Fe–S clusters (a model implicates the distal cluster) and the 2H+/H2 couple.42,43
It will now be important to examine whether Ni-L makes an appearance in other [NiFe]-hydrogenases, most obviously those that are O2-tolerant, when spectroscopic experiments are carried out over an extended high pH range. The fact that Ni-L is available as a normal state of Hyd-1 may now be of great value in further mechanistic studies.
Acknowledgments
The research was supported by the UK BBSRC (BB/I022309/1 and BB/L009722/1). F.A.A. is a Royal Society-Wolfson Research Merit Award holder. W.K.M. is supported by the UK EPSRC (EP/L011972/1, grant to CAESR, the Centre for Advanced Spin Resonance). K.A.V. and P.A.A. are supported by the European Research Council (EnergyBioCatalysis-ERC-2010-StG-258600). R.H. is supported by Ministerio de Ciencia y Tecnología, Universidad de Costa Rica and Lincoln College, Oxford. We thank Mrs Elena Nomerotskaia for technical assistance.
Supporting Information Available
Infrared spectra of Hyd-1 adsorbed on carbon black particles before and after activation under H2. Graph showing how the potential at which the Ni-C and Ni-L peaks have maximum combined intensity varies as a function of solution pH. X-band HYSCORE spectra of a wild-type Hyd-1 sample, pH 4.0, at g = 2.18, before and after illumination. X-band CW EPR spectra of Hyd-1 at pH 3.0, showing the effect of illumination. The Supporting Information is available free of charge on the ACS Publications website at DOI: 10.1021/jacs.5b03182.
Author Present Address
§ School of Biological and Chemical Sciences, Queen Mary University of London, London E1 4NS.
The authors declare no competing financial interest.
Supplementary Material
References
- Lubitz W.; Ogata H.; Rüdiger O.; Reijerse E. Chem. Rev. 2014, 114, 4081. [DOI] [PubMed] [Google Scholar]
- Fontecilla-Camps J. C.; Volbeda A.; Cavazza C.; Nicolet Y. Chem. Rev. 2007, 107, 4273. [DOI] [PubMed] [Google Scholar]
- Ogata H.; Nishikawa K.; Lubitz W. Nature 2015, 520, 571. [DOI] [PubMed] [Google Scholar]
- Brecht M.; van Gastel M.; Buhrke T.; Friedrich B.; Lubitz W. J. Am. Chem. Soc. 2003, 125, 13075. [DOI] [PubMed] [Google Scholar]
- Foerster S.; van Gastel M.; Brecht M.; Lubitz W. J. Biol. Inorg. Chem. 2005, 10, 51. [DOI] [PubMed] [Google Scholar]
- Kampa M.; Lubitz W.; van Gastel M.; Neese F. J. Biol. Inorg. Chem. 2012, 17, 1269. [DOI] [PubMed] [Google Scholar]
- van der Zwaan J. W.; Albracht S. P. J.; Fontijn R. D.; Slater E. C. FEBS Lett. 1985, 179, 271. [DOI] [PubMed] [Google Scholar]
- Whitehead J. P.; Gurbiel R. J.; Bagyinka C.; Hoffman B. M.; Maroney M. J. J. Am. Chem. Soc. 1993, 115, 5629. [Google Scholar]
- Pandelia M. E.; Ogata H.; Lubitz W. ChemPhysChem 2010, 11, 1127. [DOI] [PubMed] [Google Scholar]
- Fichtner C.; van Gastel M.; Lubitz W. Phys. Chem. Chem. Phys. 2003, 5, 5507. [Google Scholar]
- Medina M.; Claude Hatchikian E.; Cammack R. Biochim. Biophys. Acta 1996, 1275, 227. [Google Scholar]
- Kampa M.; Pandelia M. E.; Lubitz W.; van Gastel M.; Neese F. J. Am. Chem. Soc. 2013, 135, 3915. [DOI] [PubMed] [Google Scholar]
- Niu S. Q.; Thomson L. M.; Hall M. B. J. Am. Chem. Soc. 1999, 121, 4000. [Google Scholar]
- Chambers G. M.; Mitra J.; Rauchfuss T. B.; Stein M. Inorg. Chem. 2014, 53, 4243. [DOI] [PubMed] [Google Scholar]
- Siegbahn P. E. M.; Tye J. W.; Hall M. B. Chem. Rev. 2007, 107, 4414. [DOI] [PubMed] [Google Scholar]
- Lill S. O. N.; Siegbahn P. E. M. Biochemistry 2009, 48, 1056. [DOI] [PubMed] [Google Scholar]
- Lindahl P. A. J. Inorg. Biochem. 2012, 106, 172. [DOI] [PMC free article] [PubMed] [Google Scholar]
- Roessler M. M.; Evans R. M.; Davies R. A.; Harmer J.; Armstrong F. A. J. Am. Chem. Soc. 2012, 134, 15581. [DOI] [PubMed] [Google Scholar]
- Cracknell J. A.; Wait A. F.; Lenz O.; Friedrich B.; Armstrong F. A. Proc. Natl. Acad. Sci. U.S.A. 2009, 106, 20681. [DOI] [PMC free article] [PubMed] [Google Scholar]
- Ogata H.; Kellers P.; Lubitz W. J. Mol. Biol. 2010, 402, 428. [DOI] [PubMed] [Google Scholar]
- Pandelia M.-E.; Infossi P.; Giudici-Orticoni M. T.; Lubitz W. Biochemistry 2010, 49, 8873. [DOI] [PubMed] [Google Scholar]
- Evans R. M.; Parkin A.; Roessler M. M.; Murphy B. J.; Adamson H.; Lukey M. J.; Sargent F.; Volbeda A.; Fontecilla-Camps J. C.; Armstrong F. A. J. Am. Chem. Soc. 2013, 135, 2694. [DOI] [PubMed] [Google Scholar]
- Lukey M. J.; Parkin A.; Roessler M. M.; Murphy B. J.; Harmer J.; Palmer T.; Sargent F.; Armstrong F. A. J. Biol. Chem. 2010, 285, 3928. [DOI] [PMC free article] [PubMed] [Google Scholar]
- Goris T.; Wait A. F.; Saggu M.; Fritsch J.; Heidary N.; Stein M.; Zebger I.; Lendzian F.; Armstrong F. A.; Friedrich B.; Lenz O. Nat. Chem. Biol. 2011, 7, 310. [DOI] [PubMed] [Google Scholar]
- Fritsch J.; Scheerer P.; Frielingsdorf S.; Kroschinsky S.; Friedrich B.; Lenz O.; Spahn C. M. T. Nature 2011, 479, 249. [DOI] [PubMed] [Google Scholar]
- Volbeda A.; Amara P.; Darnault C.; Mouesca J. M.; Parkin A.; Roessler M. M.; Armstrong F. A.; Fontecilla-Camps J. C. Proc. Natl. Acad. Sci. U.S.A. 2012, 109, 5305. [DOI] [PMC free article] [PubMed] [Google Scholar]
- Saggu M.; Zebger I.; Ludwig M.; Lenz O.; Friedrich B.; Hildebrandt P.; Lendzian F. J. Biol. Chem. 2009, 284, 16264. [DOI] [PMC free article] [PubMed] [Google Scholar]
- Pandelia M. E.; Infossi P.; Stein M.; Giudici-Orticoni M. T.; Lubitz W. Chem. Commun. 2012, 48, 823. [DOI] [PubMed] [Google Scholar]
- Tai H. L.; Nishikawa K.; Suzuki M.; Higuchi Y.; Hirota S. Angew. Chem., Int. Ed. 2014, 53, 13817. [DOI] [PubMed] [Google Scholar]
- Greene B. L.; Wu C. H.; McTernan P. M.; Adams M. W. W.; Dyer R. B. J. Am. Chem. Soc. 2015, 137, 4558. [DOI] [PubMed] [Google Scholar]
- Stoll S.; Schweiger A. J. Magn. Reson. 2006, 178, 42. [DOI] [PubMed] [Google Scholar]
- Ellis K. J.; Morrison J. F. Methods Enzymol. 1982, 87, 405. [DOI] [PubMed] [Google Scholar]
- Stoll V. S.; Blanchard J. S. Methods Enzymol. 1990, 182, 24. [DOI] [PubMed] [Google Scholar]
- Lukey M. J.; Roessler M. M.; Parkin A.; Evans R. M.; Davies R. A.; Lenz O.; Friedrich B.; Sargent F.; Armstrong F. A. J. Am. Chem. Soc. 2011, 133, 16881. [DOI] [PubMed] [Google Scholar]
- Dutton P. L. Methods Enzymol. 1978, 54, 411. [DOI] [PubMed] [Google Scholar]
- Saggu M.; Ludwig M.; Friedrich B.; Hildebrandt P.; Bittl R.; Lendzian F.; Lenz O.; Zebger I. ChemPhysChem 2010, 11, 1215. [DOI] [PubMed] [Google Scholar]
- Horch M.; Lauterbach L.; Saggu M.; Hildebrandt P.; Lendzian F.; Bittl R.; Lenz O.; Zebger I. Angew. Chem., Int. Ed. 2010, 49, 8026. [DOI] [PubMed] [Google Scholar]
- Murphy B. J.; Sargent F.; Armstrong F. A. Energy Environ. Sci. 2014, 7, 1426. [Google Scholar]
- Weber K.; Kramer T.; Shafaat H. S.; Weyhermuller T.; Bill E.; van Gastel M.; Neese F.; Lubitz W. J. Am. Chem. Soc. 2012, 134, 20745. [DOI] [PubMed] [Google Scholar]
- Dementin S.; Burlat B.; De Lacey A. L.; Pardo A.; Adryanczyk-Perrier G.; Guigliarelli B.; Fernandez V. M.; Rousset M. J. Biol. Chem. 2004, 279, 10508. [DOI] [PubMed] [Google Scholar]
- Mouesca J.-M.; Rius G.; Lamotte B. J. Am. Chem. Soc. 1993, 115, 4714. [Google Scholar]
- Hexter S. V.; Esterle T. F.; Armstrong F. A. Phys. Chem. Chem. Phys. 2014, 16, 11822. [DOI] [PubMed] [Google Scholar]
- Hexter S. V.; Grey F.; Happe T.; Climent V.; Armstrong F. A. Proc. Natl. Acad. Sci. U.S.A. 2012, 109, 11516. [DOI] [PMC free article] [PubMed] [Google Scholar]
Associated Data
This section collects any data citations, data availability statements, or supplementary materials included in this article.


