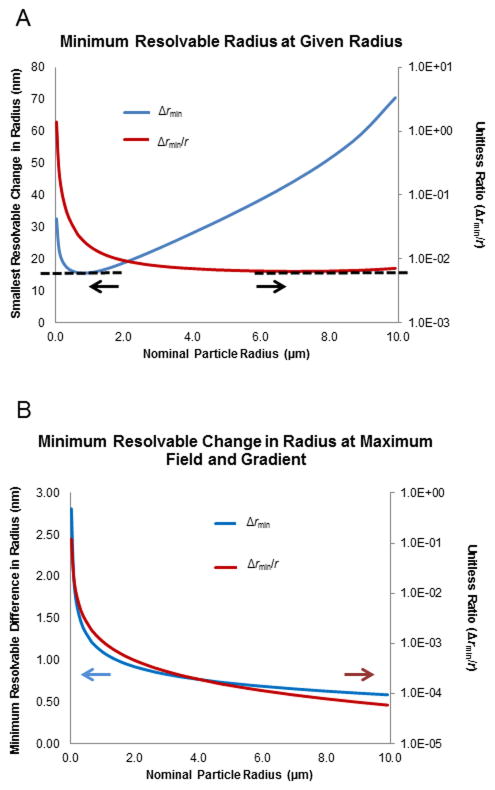
Figure 3.
A) Plot showing the smallest change in radius (blue line) that can be resolved as a function of the nominal radius of a particle using experimentally common field and gradient values (see Table 1). Also plotted is the normalized ratio of smallest resolvable difference divided by the nominal radius (red line). Arrows emphasize axis associated with each plot line. Note smallest value is ~15 nm at ~1 μm diameter and about 1:102 can be separated. B) Plot showing the smallest change in radius (blue line) that can be resolved as a function of the nominal radius of a particle using maximum experimentally accessible field and gradient values (Table 1). Also plotted is the normalized ratio of smallest resolvable difference divided by the nominal radius (red line). Arrows emphasize axis associated with each plot line. Note smallest value is ~500 pm at ~1 μm diameter and about 1:104 can be separated.

