Abstract
OBJECTIVE
The purpose of this article is to review abdominopelvic applications of diffusion-weighted imaging (DWI), discuss advantages and limitations of DWI, and illustrate these with examples.
CONCLUSION
High-quality abdominopelvic DWI can be performed routinely on current MRI systems and may offer added value in image interpretation. Particularly in unenhanced MRI examinations, DWI may provide an alternative source of image contrast and improved conspicuity to identify and potentially characterize pathology. DWI is a powerful technique that warrants implementation in routine abdominal and pelvic imaging protocols.
Keywords: abdomen, apparent diffusion coefficient, diffusion-weighted imaging (DWI), MRI
Although technical limitations made diffusion-weighted imaging (DWI) in the abdomen challenging in the recent past, developments, such as parallel imaging, high-density phased-array coils, high amplitude, faster gradients, and optimized ultrafast echo-planar techniques for body applications, have enabled routine implementation in abdominopelvic MRI protocols with more consistent image quality. We illustrate the utility of DWI in detection and characterization of disease processes in the abdomen and pelvis with several imaging examples.
Principles and Techniques
DWI exploits the physical property of random Brownian motion of intra- and extracellular water molecules [1, 2]. The extent of this motion varies depending on the surrounding environment. Protons that are unhindered in their ability to diffuse freely in tissues contribute little to signal intensity in DWI, whereas protons that cannot move as freely (i.e., restricted diffusion) yield higher signal intensity. Intact cell membranes and intracellular organelles are a common barrier to free water diffusion. Consequently, tissues with high cellularity, such as tumors, or tissues with ample connective tissue matrix, such as fibrosis, exhibit restricted diffusion [1–3].
DWI typically uses an ultrafast spin-echo echo-planar T2-weighted sequence with application of two gradients of equal amplitude and the same polarity: a dephasing gradient applied between the excitation and the 180° refocusing pulse and a rephasing gradient applied between the 180° refocusing pulse and the signal acquisition. Water molecules that freely move, or diffuse, (e.g., in a cyst) between both gradients do not get completely rephased by the second gradient, thus resulting in signal loss (Figs. 1A and 1B; see also Fig. S1C in the AJR electronic supplement to this article, available at www.ajronline.org). In contradistinction, water molecules that remain relatively static during and between the application of both gradients (hindered diffusion) do get rephased, thus contributing to MR signal intensity (Figs. 2A and 2B; see also Fig. S2C in the AJR electronic supplement to this article, available at www.ajronline.org). The amplitude and duration of the gradients and the time interval between the gradients determines the b value of the sequences. The b value (s/mm2) indicates the diffusion weighting of the images. Lower-b-value (e.g., < 100– 150 s/mm2) images are more sensitive to tissue perfusion, whereas higher b value (e.g., > 500 s/mm2) images are more specific for impaired Brownian motion, indicating truly restricted diffusion [3, 4]. Typical b values used in routine abdominal imaging range from 50 to 1000 s/mm2. We obtain diffusion-weighted images with b values of 0, 50, 400, and 800 s/mm2 for routine abdominal imaging and obtain additional higher-b-value images (1500 s/mm2) for MRI of the prostate because these b values help to overcome T2 shine-through effects within the peripheral zone [1].
Fig. 1.
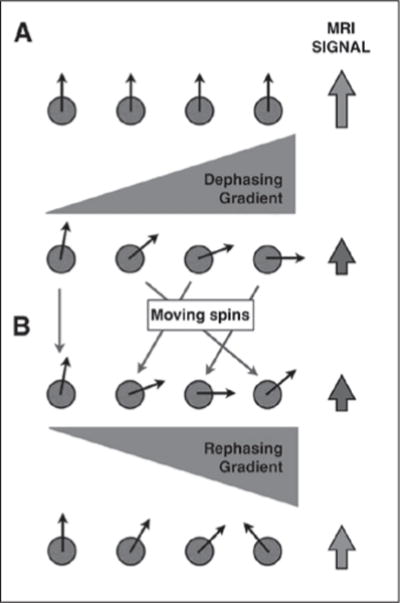
Diffusion-weighted imaging in relatively mobile protons.
A and B, Protons subject to initial diffusion sensitizing gradient (A) get dephased and result in loss of MRI signal intensity. These mobile protons (B), once subjected to rephasing gradient, do not acquire complete rephasing due to their change in position. Resultant MRI signal intensity is lower than at baseline. See also Figure S1C in supplemental data online.
Fig. 2.
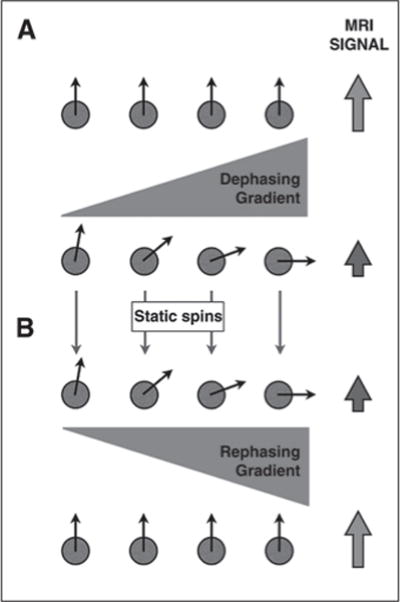
Diffusion-weighted imaging in relatively static protons.
A and B, Protons subject to initial diffusion sensitizing gradient (A) get dephased and result in loss of MRI signal intensity. These stationary protons (B), once subjected to rephasing gradient, acquire complete rephasing. Resultant MRI signal intensity is high (same as baseline). See also Figure S2C in supplemental data online.
The degree to which signal intensity is retained or lost as the b value is increased can be quantified as the apparent diffusion coefficient (ADC). At least two, but preferably more than two, acquisitions with different b values must be obtained to generate a quantitative ADC map or ADC image. Assuming monoexponential signal decay, the ADC of each voxel is calculated (mm2/s) by fitting the change in logarithmic signal intensity to various b values. Conceptually, the ADC value is the slope of the line that denotes logarithmic change in signal intensity as a function of b value. ADC value will be higher if there is a loss of signal intensity in a voxel on a high-b-value image relative to signal intensity on the low-b-value image and will be lower when there is no or little loss in signal intensity. Because DWI acquisitions are inherently T2-weighted sequences, tissues with very long T2 relaxation times may contribute to the overall signal intensity in the absence of restricted diffusion, which is T2 shine-through [1–3]. ADC can be used to differentiate between true restricted diffusion and T2 shine-through when the voxel in question remains bright on high-b-value images (i.e., low ADC indicates true restricted diffusion whereas high ADC confirms T2 shine-through effect). For example, the gallbladder sometimes remains slightly hyperintense on high-b-value images, but shows high ADC consistent with T2 shine-through (Fig. 3). The accuracy and variability of ADC values generated can be dependent on a number of technical factors, including the specific b values used during the acquisition [5], potential respiratory misregistration between acquisitions with different b values, and noise level in high-b-value acquisitions. In general, accuracy of the ADC value increases as the number of b values used to generate the ADC map is increased provided there is enough signal-to-noise; however, this is at the expense of increased acquisition times.
Fig. 3.
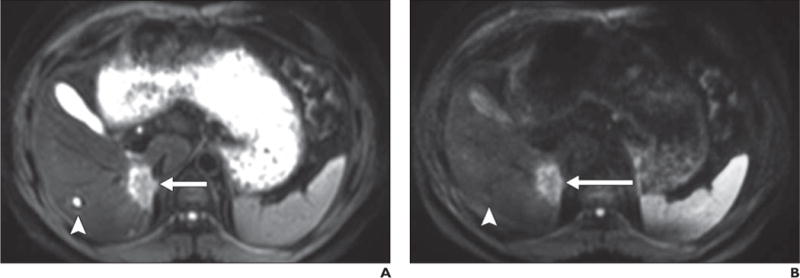
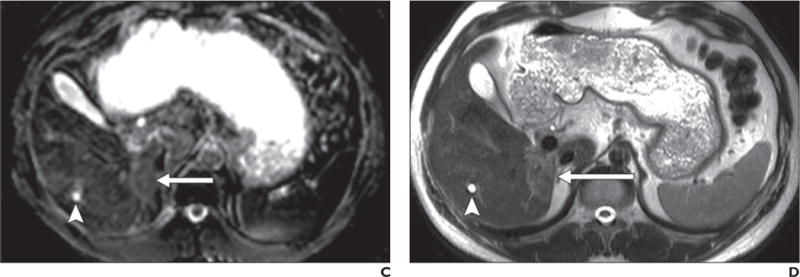
40-year-old man with biopsy-proven cholangiocarcinoma in posterior right hepatic lobe adjacent to inferior vena cava.
A–D, Malignant neoplasm (arrow) is shown as mass with high signal intensity on b50 (A) and b800 (B) images and low signal intensity on apparent diffusion coefficient (ADC) map (C); findings are consistent with restricted diffusion in solid lesion, which shows mild hyperintense signal intensity on T2-weighted single-shot fast spin-echo image (D). In contrast, gallbladder is moderately hyperintense on b50 image but only slightly hyperintense on b800 image and exhibits high signal intensity on ADC map, indicative of high ADC. High signal intensity on b800 image is consistent with T2 shine-through due to high inherent T2 relaxation time of bile (i.e., fluid) contents. Similarly, small cyst (arrowhead) in right hepatic lobe and fluid contents in stomach are hyperintense on b50 image, hypointense on b800 image, and hyperintense on ADC map, also indicative of lack of restricted diffusion (although without visible T2 shine-through).
Diffusion-weighted imaging is generally performed with fat suppression, which can be achieved with frequency-selective fat-saturation techniques, such as chemical shift selective saturation or nonselective inversion recovery techniques, such as STIR. Nonselective inversion recovery techniques may achieve more homogeneous fat suppression, particularly when using a large FOV anatomic coverage; however, these techniques can cause inadvertent suppression of nonfatty tissue moieties with short T1 relaxation times [6], suffer from decreased signal-to-noise ratio (SNR) and slightly increased scanning times, and are more prone to motion artifact. Frequency-selective fat-saturation techniques, on the other hand, are more susceptible to field inhomogeneity [7]. Alternatively, frequency-selective inversion recovery sequences, such as spectral presaturation inversion recovery may provide a compromise to achieve more uniform fat suppression without the consequences of nonselective inversion recovery. DWI can be performed using breathhold or nonbreathhold techniques [2, 3, 8]. Breath-hold techniques are faster but suffer from lower SNR and allow only a limited number of b values per acquisition, making the ADC calculation frequently inaccurate and less reproducible [3, 9]. Nonbreathhold techniques can be acquired by averaging the signal intensity of multiple acquisitions (i.e., multiple number of signals acquired) or with respiratory triggering strategies, such as the use of respiratory bellows or navigator technology [3]. Nonbreathhold strategies have inherently higher SNR than breathhold strategies, and the number of b values on these acquisitions is only limited by the practical constrains of longer acquisition times [10]. However, nonbreathhold acquisitions are more prone to misregistration, potentially leading to inaccurate estimations of ADC maps.
Although Gulani et al. [11] proposed that the T2 shortening effects of gadolinium may lead to signal degradation of single-shot echo-planar images, other authors have shown no significant change in ADC values of the liver and focal hepatic lesions or in the SNR and contrast-to-noise ratio (CNR) of DWI after the administration of an extracellular contrast agent [12]. Although the SNR and ADC values in the liver on DWI during the hepatobiliary phase after administration of a hepatobiliary contrast agent are lower compared with unenhanced DWI, the CNR of focal hepatic lesions in this setting increases on lower-b-value images after contrast administration without resulting in a significant change in ADC at 3 T [13]. This, however, does not have a significant impact on hepatic lesion detection and characterization on DWI [14].
One of the major technical advances that has enabled the broad use of DWI for body applications is parallel imaging. Historically, DWI for body applications has been hindered by the image distortions associated with large FOV and increased anatomic coverage intrinsic to echo-planar acquisitions. Because parallel imaging reduces the total number of phase-encoding steps without sacrificing spatial resolution, the acquisition duration is reduced, hence limiting image distortion. Although there is a SNR penalty associated with parallel imaging, the advantages of reduced image distortion and reduced T2 and T2* decay due to shorter readouts exceed the SNR penalty.
The two main advantages of DWI are the potential for improved detection of lesions (increased sensitivity) and the opportunity for lesion characterization (increased specificity). These advantages are highlighted when gadolinium is either contraindicated (e.g., allergy or severe renal insufficiency) or the obtained contrast-enhanced images do not offer a diagnosis (e.g., motion degraded, suboptimal bolus timing, lesion too small to characterize). In these settings, DWI becomes particularly valuable.
Limitations of DWI inherent to the technique include low spatial resolution, poor SNR, and vulnerability to susceptibility artifact (e.g., diminished image quality at 3 T vs 1.5 T) and to motion (e.g., peristalsis, pulsatility, respiratory motion) [1, 15]. Furthermore, the reproducibility of ADC values is currently under investigation [3, 16], and the accuracy of ADC values may be affected by multiple technical factors. Some of these are particularly relevant in body acquisitions. For example, misregistration of slices with different b values due to respiratory motion despite use of respiratory compensation strategies can result in inaccurate ADC values. Another factor that is often neglected is the contribution of tissue perfusion in the determination of ADC maps, particularly when lower b values (e.g., < 100– 150 s/mm2) are used. In such instances, a biexponential model fitting that includes tissue perfusion should be used to accurately determine the true restricted diffusion [17, 18].
Improved Lesion Detection
Although DWI has inherently low SNR compared with other sequences, the technique often yields very high lesion-to-background contrast, which increases the conspicuity of lesions relative to surrounding tissues and thus improves lesion detection relative to traditional T2-weighted sequences [3, 16]. For example, Parikh et al. [19] showed increased detection rates of both benign and malignant focal liver lesions using DWI over STIR and fast spin-echo T2-weighted sequences [19] (Fig. 4). We have found DWI to be particularly helpful for detection of small liver metastases. The increased conspicuity is accomplished by the cancellation of the intravascular signal intensity with low b values (Fig. 5), saturation of fluid signal intensity with higher b values, and high signal intensity resulting from restricted diffusion that is commonly present in neoplastic lesions (Fig. 6). Infiltrative lesions, such as certain hepatocellular carcinomas (HCCs), may also be best demarcated on DWI. However, we have anecdotally noted that, in the setting of cirrhosis, some HCCs are not well visualized because of poor lesion-to-background contrast. This may be secondary to restricted diffusion in the background cirrhotic liver parenchyma. Well-differentiated HCCs also may not show restricted diffusion relative to the surrounding parenchyma [20]. Similarly, in some patients with suspected HCC, the mass may be hyperintense relative to the background liver on high-b-value diffusion images; however, it may only be isointense and inconspicuous on the ADC maps (Fig. 4).
Fig. 4.
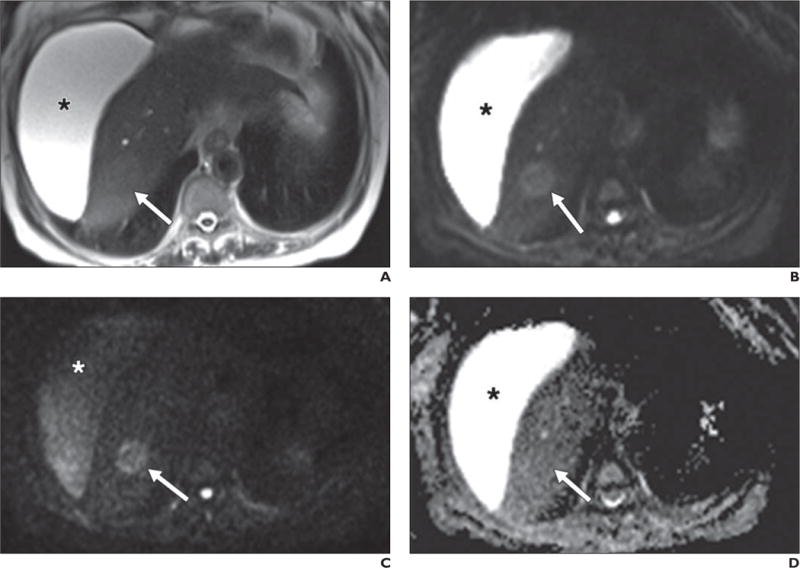
63-year-old woman with cirrhosis and new mass identified on ultrasound (not shown).
A–D, Lesion (arrow) nearly isointense to background liver on axial T2-weighted single-shot fast spin-echo image (A) is well shown on low-b-value diffusion-weighted (b = 50) image (B). Retained signal on high-b-value (b800) image (C) suggests solid lesion, which as new finding in setting of cirrhosis is worrisome for hepatocellular carcinoma. Note abdominal ascites (asterisk), which decreases in signal intensity on high-b-value images, suggestive of simple fluid. This fluid was bright on ADC map (D). Dynamic imaging was not performed due to contraindication to gadolinium. This example also shows potential inconspicuity of solid lesion on ADC map (D) on background of cirrhotic liver.
Fig. 5.
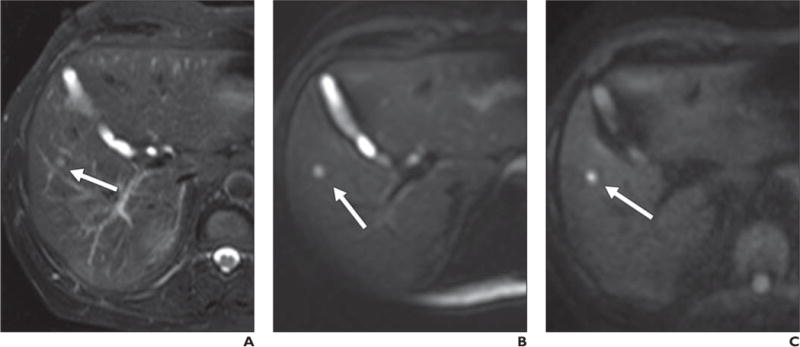
69-year-old man with lung cancer.
A, Axial T2-weighted fat-saturated single-shot fast spin-echo image shows small hyperintense lesion (arrow), which is difficult to differentiate from adjacent vessels.
B, Low-b-value (b = 50) diffusion-weighted image shows lesion (arrow) with far more conspicuity than T2-weighted sequence due to cancellation of intravascular signal.
C, Lesion (arrow) retains signal intensity on high-b-value (b800) image and is consistent with restriction in solid lesion. This patient could not receive contrast agent and diffusion-weighted imaging provided best opportunity to detect this lesion, suspicious for metastatic focus.
Fig. 6.
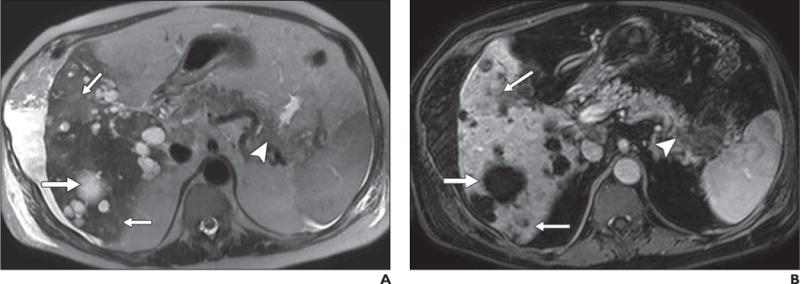
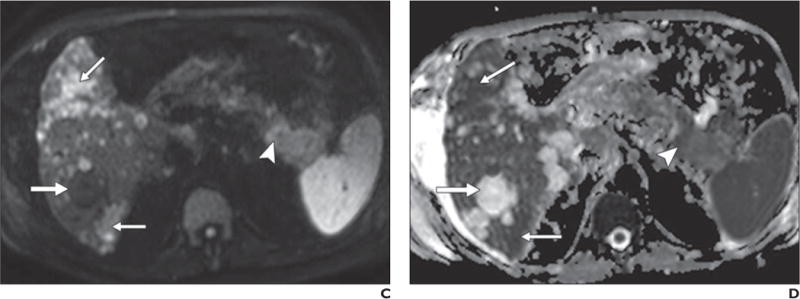
67-year-old man with history of polycystic kidney disease and T3NxMx gallbladder cancer.
A–D, In T2-weighted single-shot fast spin-echo image (A), gadolinium-enhanced T1-weighted spoiled gradient-echo image obtained during venous phase (B), diffusion-weighted image with b800 (C), and apparent diffusion coefficient (ADC) map (D), mass is seen in tail of pancreas (arrowhead), which was biopsy-proven to be adenocarcinoma. Numerous well-demarcated lesions are noted in liver (thick arrow) with homogenous high signal intensity on T2-weighted images, low signal intensity on diffusion-weighted b800 images, and high signal intensity on ADC map; these are consistent with simple cysts related to polycystic kidney disease and represent challenge for detection of metastatic disease. Subtle areas of high signal intensity relative to background liver are noted on T2-weighted images (thin arrows, A) with mild hypo-enhancement (thin arrows, B) but are far more conspicuous on diffusion-weighted image (thin arrows, C). Low signal intensity in these lesions on ADC map (thin arrows, D) in conjunction with contrast-enhanced images, helps to characterize these as solid lesions. Findings were suspicious for hepatic metastatic disease.
Aside from detection of liver lesions, DWI can potentially increase the accuracy in detection of peritoneal metastases [21] (Fig. 7) and assist in identifying inflammatory processes, such as appendicitis (Fig. 8), diverticulitis, or abscess (Fig. 9). DWI may serve as a tool to assess early response after tumor-directed therapies, such as thermal ablation and embolization, in HCC or liver metastases and possibly to predict response to therapy on the basis of pretreatment ADC values, although more investigation is necessary before widespread use of this application [3, 22–24].
Fig. 7.
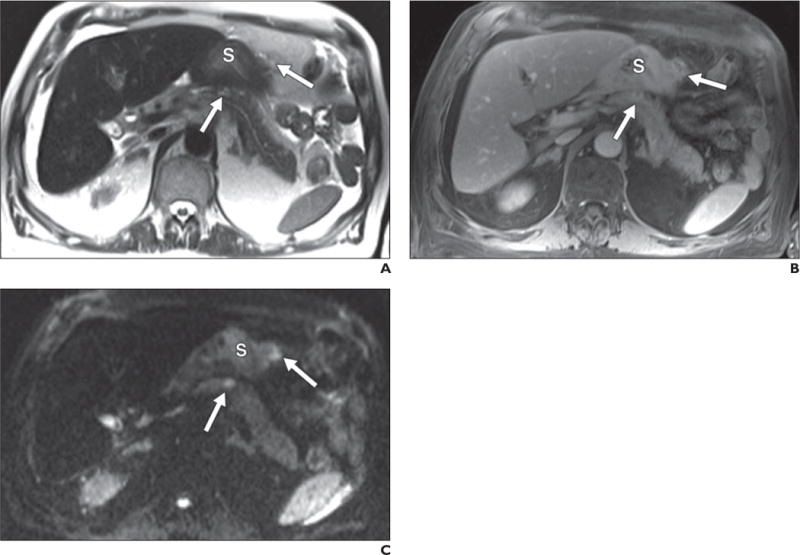
67-year-old man with peritoneal metastatic deposits (arrows) related to gastric adenocarcinoma.
A–C, Peritoneal disease is subtle on T2-weighted single-shot fast spin-echo (A) and gadolinium-enhanced T1-weighted spoiled gradient-echo (B) images but most conspicuous on diffusion-weighted b400 image (C) on which it is seen as foci of bright signal intensity. S = stomach.
Fig. 8.
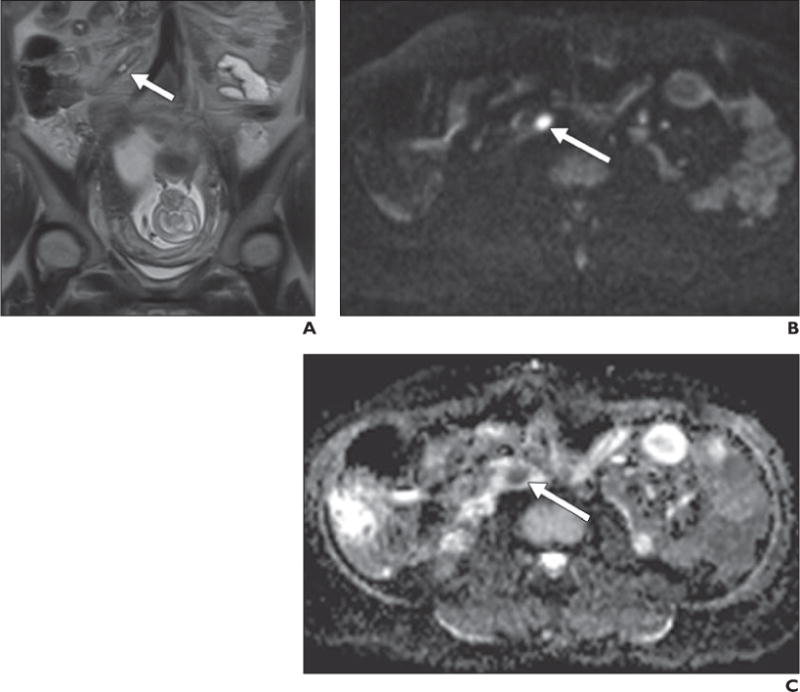
26-year-old pregnant woman with acute appendicitis.
A, Coronal T2-weighted single-shot fast spin-echo image shows minimally distended fluid-filled appendiceal tip (arrow) without obvious periappendiceal inflammatory changes. B and C, Axial diffusion-weighted image obtained with b800 (B) shows obvious increased signal intensity in appendix, and low signal intensity on apparent diffusion coefficient map (C) confirms restricted diffusion, which supports presence of inflammatory or infectious contents (arrow). Appendicitis was proven at surgery and histopathology.
Fig. 9.
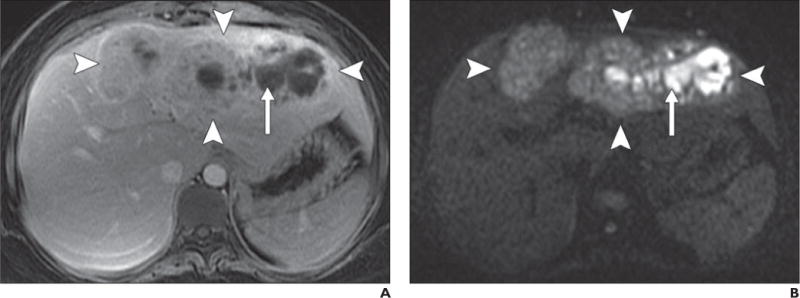
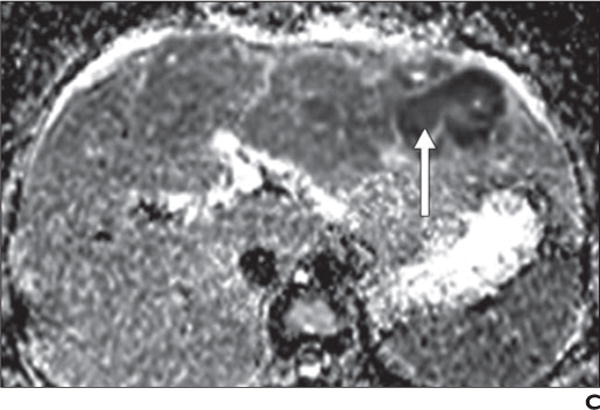
36-year-old woman with fever and hepatic abscess.
A, Gadolinium-enhanced T1-weighted spoiled gradient-echo image shows large ill-defined mass (arrowheads) in left lobe of liver with centrally nonenhancing area (arrow).
B, Diffusion-weighted image with b800 better delineates extent of mass, which shows mildly elevated signal intensity (arrowheads) and very high signal intensity in central, nonenhancing area (arrow).
C, Low signal intensity (arrow) in central nonenhancing areas on apparent diffusion coefficient map confirms restricted diffusion, which suggests presence of nonvascularized complex fluid, such as pus or hemorrhage. Clinical presentation together with imaging findings of restricted diffusion in nonenhancing area suggest large area of infective hepatitis with abscess formation. These findings were confirmed with biopsy and aspiration and patient showed significant improvement after antibiotic therapy.
Improved Lesion Characterization
DWI, in concert with an ADC map, provides an opportunity to further characterize lesions especially on unenhanced examinations. High signal intensity on the low-b-value image with persistent hyperintensity on the high-b-value image and a corresponding low ADC value is consistent with restricted diffusion and may be indicative of a solid lesion (Fig. 10), with the exception of certain caveats discussed later. Conversely, cystic lesions generally exhibit proportionate loss of signal intensity on high-b-value images compared with low-b-value images and have a corresponding high ADC value (Fig. 11). Therefore, DWI may provide an opportunity to differentiate simple cysts from either solid or complex nonsolid lesions without the use of IV contrast agents. Applying these principles, one can explore the characterization of heterogeneous mixed solid and cystic masses with DWI (Fig. 12). This approach tends to be more valuable when gadolinium cannot be administered because of renal dysfunction or other contraindications.
Fig. 10.
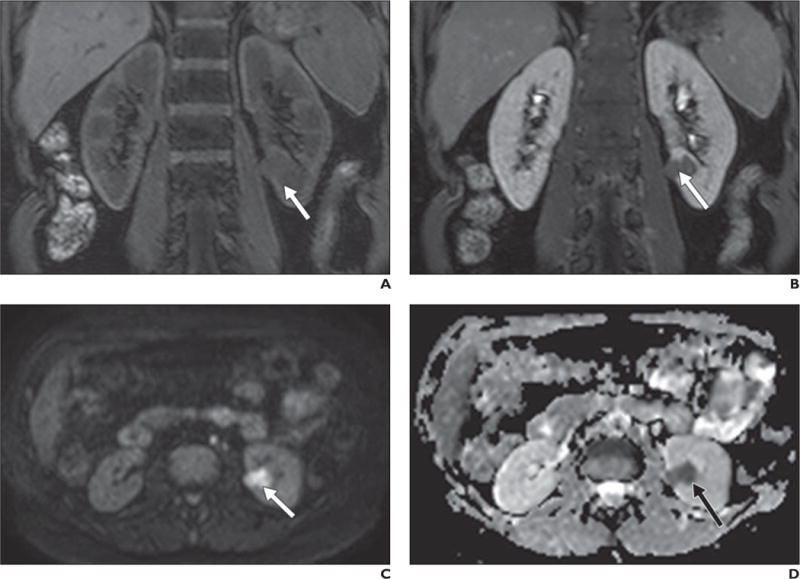
50-year-old woman with renal cell carcinoma (RCC).
A–D, Coronal T1-weighted 3D spoiled gradient-echo images obtained before (A) and after (B) gadolinium administration show left renal mass (arrow) with subtle enhancement. Lesion was iso- to slightly hypointense to kidney on low-b-value images (not shown) but is hyperintense compared with renal parenchyma on high-b-value diffusion-weighted image (C) and hypointense on apparent diffusion coefficient map (D). Findings are consistent with restricted diffusion, confirming solid neoplasm in this context and papillary RCC was confirmed at histopathology after partial nephrectomy.
Fig. 11.

69 year-old-man with simple renal cyst.
A–C, Lesion (arrow) shows high signal intensity on b50 image (A) relative to renal parenchyma with lower signal intensity relative to kidney on b800 image (B). Note high signal intensity on apparent diffusion coefficient (ADC) map (C), indicative of high ADC.
Fig. 12.
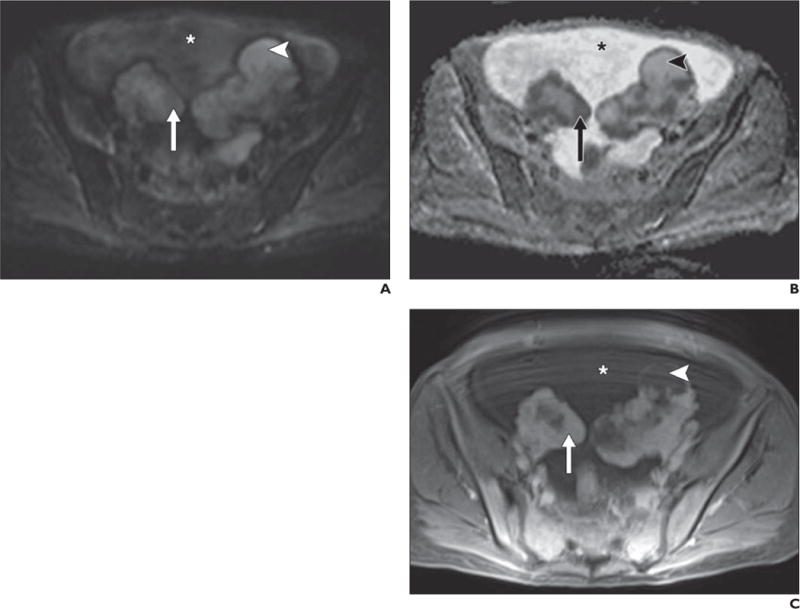
49-year-old woman with bilateral ovarian metastases from gastric adenocarcinoma (Krukenberg tumors).
A–C, Diffusion-weighted image with b800 (A), apparent diffusion coefficient (ADC) map (B), and contrast-enhanced T1-weighted spoiled gradient-echo image (C) show solid enhancing components (compared with unenhanced image, not shown) in ovarian masses (arrow), high signal intensity on b800 images, and low signal intensity on ADC map. Surrounding ascites (asterisk) has intermediate signal intensity on high-b-value image and high signal intensity on ADC map, consistent with T2 shine-through on b800 images. Cystic portions of ovarian masses (arrowheads) also show high signal intensity on high-b-value image and ADC map but are not as hyperintense as surrounding ascites on ADC map, suggesting more complex (e.g., proteinaceous or hemorrhagic) fluid.
Restricted diffusion in a lesion does not always confirm a lesion as solid because cystic lesions may show restricted diffusion if the composition is that of purulent, hemorrhagic, or keratinoid (epidermoid) material as in the case of an abscess (Fig. 9). Fibrotic tissue can also exhibit restricted diffusion [1]. Furthermore, solid lesions that have low cellularity (e.g., mucinous rectal carcinomas) may not show restricted diffusion. Lack of restricted diffusion in these circumstances may lead to false-negative results [25, 26]. Additionally, both benign and malignant solid lesions can show restricted diffusion. As a rule, if a lesion shows restricted diffusion, a simple cyst can be excluded. Differentiation between solid lesions and complex hemorrhagic, purulent, or epidermoid cystic lesions, however, may not be possible on the basis of the DWI appearance alone. Assessment of the lesion on the other sequences, comparison with prior examinations, and correlation with the clinical presentation may be helpful. Furthermore, the term “restricted diffusion” is relative because no absolute ADC values have been defined, and attempts at ADC quantification in the abdomen are sensitive to limited reproducibility of DWI acquisitions and differences in protocols among MRI vendors. However, an example of a practical approach is using the background liver parenchyma as the reference standard for hepatic lesions. In general, the lower the ADC value, the higher the likelihood that the lesion is solid; some authors have reported malignant tumors to have lower ADC relative to benign tumors (with variable degrees of overlap) whereas others have correlated the ADC value with tumor grading. For example, in the prostate gland, lower ADC values have been correlated with increased cell density and Gleason score [27–30].
Although DWI proves to be most valuable for lesion characterization in the absence of contrast-enhanced images, it may provide added value even when contrast-enhanced images are available by increasing the radiologist’s confidence or reinforcing information provided by other sequences in the imaging protocol. The utility of DWI for assessment of multiple abdominal and pelvic diseases in this context has been extensively reported. For example, in cirrhotic patients, DWI was useful for the characterization of small (< 1 cm) hypervascular liver lesions as HCC [31]. In patients with suspected pancreatic disease, high sensitivity and specificity of DWI for differentiation of pancreatic adenocarcinoma from chronic pancreatitis and intraductal papillary mucinous tumors have been reported using high-b-value images (b1000) [32]. However, others have found DWI to be unreliable in delineating almost half of pancreatic adenocarcinomas [33]. In patients with prostate cancer, DWI in combination with T2-weighted imaging increases the sensitivity and specificity of prostate cancer detection compared with T2-weighted imaging alone [34]. DWI has been reported to be helpful in differentiating bland thrombus from tumor thrombus; if the thrombus shows DWI signal intensity similar to that of the primary tumor, it is more likely to represent tumor thrombus than bland thrombus [35] (Fig. 13), although this observation needs further validation.
Fig. 13.
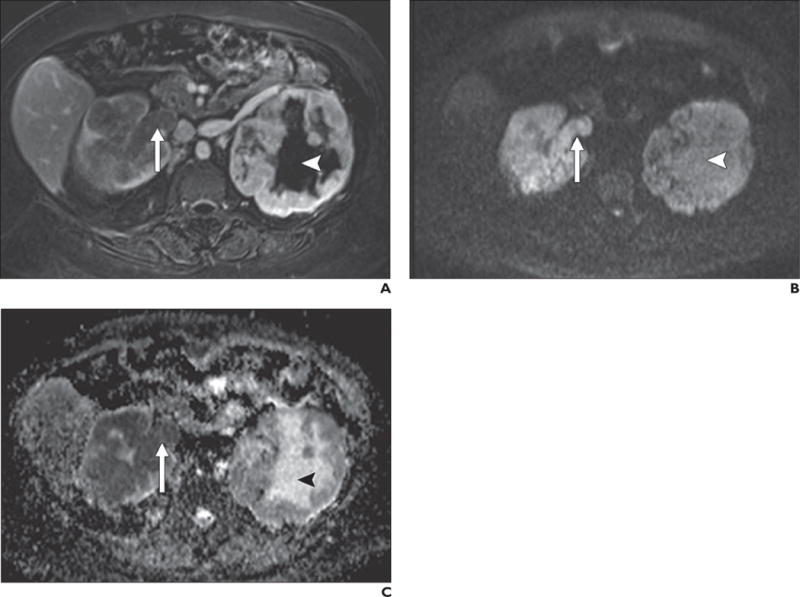
56-year-old woman with bilateral renal cell carcinoma.
A–C, T1-weighted 3D spoiled gradient-echo subtracted image (late nephrographic phase image after administration of gadolinium minus unenhanced image) (A) shows bilateral solid enhancing masses and enhancing tumor thrombus in right renal vein (arrow). Note conspicuity relative to background on high-b-value (b800) diffusion-weighted image (B). Low signal intensity on apparent diffusion coefficient (ADC) map (C) confirms restricted diffusion in masses bilaterally as well as in tumor thrombus in right renal vein. Note high signal intensity centrally within left renal mass (arrowhead, B and C) on b800 image and ADC map, consistent with T2 shine-through caused by presence of fluid due to tumor necrosis, which does not enhance (arrowhead, A).
Although ADC values can be used for quantitative analysis of a lesion, this application is burdened with pitfalls, including reliability and variability of ADC values [3, 5, 16]. Accurate ADC measurements may be confounded by motion and misregistration between the multiple-b-value acquisitions. This would be of particular concern when trying to characterize small lesions with DWI. Furthermore, significant overlap of ADC values has been reported between benign and malignant lesions in various organs, including but not limited to liver, pancreas, adrenal glands, and prostate gland [27, 36–39]. This limits differentiation of solid lesions that are benign from those that are malignant. Further research is necessary to determine appropriate use of ADC values in clinical practice.
Summary
DWI in the abdomen and pelvis is a valuable adjunct to traditional techniques and improves the sensitivity of MRI for lesion detection, especially metastases. Furthermore, DWI may enhance the ability to characterize lesions, particularly when gadolinium administration is contraindicated or contrast-enhanced images are suboptimal. Even in the presence of dynamic contrast-enhanced imaging, DWI may yield supportive evidence and increase the confidence in a specific diagnosis. DWI should always be used in conjunction with the information provided by additional sequences. DWI and ADC maps provide an opportunity for tissue characterization using a quantitative method, thus offering a new opportunity for longitudinal assessment of tumors undergoing therapy; however, further research is necessary to determine the role of such quantitative analysis in clinical practice. Given these merits and the ubiquitous availability of DWI on current MRI systems, DWI may be implemented as a routine sequence in standard abdominal MRI protocols and considered of the most value when IV contrast agents cannot be administered.
Supplementary Material
Acknowledgments
We thank Pam Curry and Glenn Katz for their assistance with the animations included in the electronic version of this article.
Footnotes
Presented at the 2012 annual meeting of the American Roentgen Ray Society, Vancouver, BC, Canada, and received certificate of merit.
Supplemental Data
Available online at www.ajronline.org.
References
- 1.Qayyum A. Diffusion-weighted imaging in the abdomen and pelvis: concepts and applications. RadioGraphics. 2009;29:1797–1810. doi: 10.1148/rg.296095521. [DOI] [PMC free article] [PubMed] [Google Scholar]
- 2.Koh DM, Collins DJ. Diffusion-weighted MRI in the body: applications and challenges in oncology. AJR. 2007;188:1622–1635. doi: 10.2214/AJR.06.1403. [DOI] [PubMed] [Google Scholar]
- 3.Taouli B, Koh DM. Diffusion-weighted MR imaging of the liver. Radiology. 2010;254:47–66. doi: 10.1148/radiol.09090021. [DOI] [PubMed] [Google Scholar]
- 4.Hollingsworth KG, Lomas DJ. Influence of perfusion on hepatic MR diffusion measurement. NMR Biomed. 2006;19:231–235. doi: 10.1002/nbm.1028. [DOI] [PubMed] [Google Scholar]
- 5.Bilgili MY. Reproducibility of apparent diffusion coefficients measurements in diffusion-weighted MRI of the abdomen with different b values. Eur J Radiol. 2012;81:2066–2068. doi: 10.1016/j.ejrad.2011.06.045. [DOI] [PubMed] [Google Scholar]
- 6.Krinsky G, Rofsky NM, Weinreb JC. Nonspecificity of short inversion time inversion recovery (STIR) as a technique of fat suppression: pitfalls in image interpretation. AJR. 1996;166:523–526. doi: 10.2214/ajr.166.3.8623620. [DOI] [PubMed] [Google Scholar]
- 7.Bley TA, Wieben O, Francois CJ, Brittain JH, Reeder SB. Fat and water magnetic resonance imaging. J Magn Reson Imaging. 2010;31:4–18. doi: 10.1002/jmri.21895. [DOI] [PubMed] [Google Scholar]
- 8.Taouli B, Sandberg A, Stemmer A, et al. Diffusion-weighted imaging of the liver: comparison of navigator triggered and breathhold acquisitions. J Magn Reson Imaging. 2009;30:561–568. doi: 10.1002/jmri.21876. [DOI] [PubMed] [Google Scholar]
- 9.Kim SY, Lee SS, Park B, et al. Reproducibility of measurement of apparent diffusion coefficients of malignant hepatic tumors: effect of DWI techniques and calculation methods. J Magn Reson Imaging. 2012;36:1131–1138. doi: 10.1002/jmri.23744. [DOI] [PubMed] [Google Scholar]
- 10.Kandpal H, Sharma R, Madhusudhan KS, Kapoor KS. Respiratory-triggered versus breath-hold diffusion-weighted MRI of liver lesions: comparison of image quality and apparent diffusion coefficient values. AJR. 2009;192:915–922. doi: 10.2214/AJR.08.1260. [DOI] [PubMed] [Google Scholar]
- 11.Gulani V, Willatt JM, Blaimer M, Hussain HK, Duerk JL, Griswold MA. Effect of contrast media on single-shot echo planar imaging: implications for abdominal diffusion imaging. J Magn Reson Imaging. 2009;30:1203–1208. doi: 10.1002/jmri.21945. [DOI] [PMC free article] [PubMed] [Google Scholar]
- 12.Chiu FY, Jao JC, Chen CY, et al. Effect of intravenous gadolinium-DTPA on diffusion-weighted magnetic resonance images for evaluation of focal hepatic lesions. J Comput Assist Tomogr. 2005;29:176–180. doi: 10.1097/01.rct.0000157472.98277.5c. [DOI] [PubMed] [Google Scholar]
- 13.Choi JS, Kim MJ, Choi JY, Park MS, Lim JS, Kim KW. Diffusion-weighted MR imaging of liver on 3.0-Tesla system: effect of intravenous administration of gadoxetic acid disodium. Eur Radiol. 2010;20:1052–1060. doi: 10.1007/s00330-009-1651-8. [DOI] [PubMed] [Google Scholar]
- 14.Choi SA, Lee SS, Jung IH, Kim HA, Byun JH, Lee MG. The effect of gadoxetic acid enhancement on lesion detection and characterisation using T2 weighted imaging and diffusion weighted imaging of the liver. Br J Radiol. 2012;85:29–36. doi: 10.1259/bjr/12929687. [DOI] [PMC free article] [PubMed] [Google Scholar]
- 15.Rosenkrantz AB, Oei M, Babb JS, Niver BE, Taouli B. Diffusion-weighted imaging of the abdomen at 3.0 Tesla: image quality and apparent diffusion coefficient reproducibility compared with 1.5 Tesla. J Magn Reson Imaging. 2011;33:128–135. doi: 10.1002/jmri.22395. [DOI] [PubMed] [Google Scholar]
- 16.Dale BM, Braithwaite AC, Boll DT, Merkle EM. Field strength and diffusion encoding technique affect the apparent diffusion coefficient measurements in diffusion-weighted imaging of the abdomen. Invest Radiol. 2010;45:104–108. doi: 10.1097/RLI.0b013e3181c8ceac. [DOI] [PubMed] [Google Scholar]
- 17.Luciani A, Vignaud A, Cavet M, et al. Liver cirrhosis: intravoxel incoherent motion MR imaging—pilot study. Radiology. 2008;249:891–899. doi: 10.1148/radiol.2493080080. [DOI] [PubMed] [Google Scholar]
- 18.Yamada I, Aung W, Himeno Y, Nakagawa T, Shibuya H. Diffusion coefficients in abdominal organs and hepatic lesions: evaluation with intravoxel incoherent motion echo-planar MR imaging. Radiology. 1999;210:617–623. doi: 10.1148/radiology.210.3.r99fe17617. [DOI] [PubMed] [Google Scholar]
- 19.Parikh T, Drew SJ, Lee VS, et al. Focal liver lesion detection and characterization with diffusion-weighted MR imaging: comparison with standard breath-hold T2-weighted imaging. Radiology. 2008;246:812–822. doi: 10.1148/radiol.2463070432. [DOI] [PubMed] [Google Scholar]
- 20.An C, Park MS, Jeon HM, et al. Prediction of the histopathological grade of hepatocellular carcinoma using qualitative diffusion-weighted, dynamic, and hepatobiliary phase MRI. Eur Radiol. 2012;22:1701–1708. doi: 10.1007/s00330-012-2421-6. [DOI] [PubMed] [Google Scholar]
- 21.Bozkurt M, Doganay S, Kantarci M, et al. Comparison of peritoneal tumor imaging using conventional MR imaging and diffusion-weighted MR imaging with different b values. Eur J Radiol. 2011;80:224–228. doi: 10.1016/j.ejrad.2010.06.004. [DOI] [PubMed] [Google Scholar]
- 22.Rhee TK, Naik NK, Deng J, et al. Tumor response after yttrium-90 radioembolization for hepatocellular carcinoma: comparison of diffusion-weighted functional MR imaging with anatomic MR imaging. J Vasc Interv Radiol. 2008;19:1180–1186. doi: 10.1016/j.jvir.2008.05.002. [DOI] [PubMed] [Google Scholar]
- 23.Yuan Z, Ye XD, Dong S, et al. Role of magnetic resonance diffusion-weighted imaging in evaluating response after chemoembolization of hepatocellular carcinoma. Eur J Radiol. 2010;75:e9–e14. doi: 10.1016/j.ejrad.2009.05.040. [DOI] [PubMed] [Google Scholar]
- 24.Li Z, Bonekamp S, Halappa VG, et al. Islet cell liver metastases: assessment of volumetric early response with functional MR imaging after transarterial chemoembolization. Radiology. 2012;264:97–109. doi: 10.1148/radiol.12112161. [DOI] [PubMed] [Google Scholar]
- 25.Cieszanowski A, Anysz-Grodzicka A, Szeszkowski W, et al. Characterization of focal liver lesions using quantitative techniques: comparison of apparent diffusion coefficient values and T2 relaxation times. Eur Radiol. 2012;22:2514–2524. doi: 10.1007/s00330-012-2519-x. [DOI] [PMC free article] [PubMed] [Google Scholar]
- 26.Lambregts DM, Vandecaveye V, Barbaro B, et al. Diffusion-weighted MRI for selection of complete responders after chemoradiation for locally advanced rectal cancer: a multicenter study. Ann Surg Oncol. 2011;18:2224–2231. doi: 10.1245/s10434-011-1607-5. [DOI] [PMC free article] [PubMed] [Google Scholar]
- 27.Bonekamp S, Corona-Villalobos CP, Kamel IR. Oncologic applications of diffusion-weighted MRI in the body. J Magn Reson Imaging. 2012;35:257–279. doi: 10.1002/jmri.22786. [DOI] [PubMed] [Google Scholar]
- 28.Hambrock T, Somford DM, Huisman HJ, et al. Relationship between apparent diffusion coefficients at 3.0-T MR imaging and Gleason grade in peripheral zone prostate cancer. Radiology. 2011;259:453–461. doi: 10.1148/radiol.11091409. [DOI] [PubMed] [Google Scholar]
- 29.Verma S, Rajesh A, Morales H, et al. Assessment of aggressiveness of prostate cancer: correlation of apparent diffusion coefficient with histologic grade after radical prostatectomy. AJR. 2011;196:374–381. doi: 10.2214/AJR.10.4441. [DOI] [PubMed] [Google Scholar]
- 30.Gibbs P, Liney GP, Pickles MD, Zelhof B, Rodrigues G, Turnbull LW. Correlation of ADC and T2 measurements with cell density in prostate cancer at 3.0 Tesla. Invest Radiol. 2009;44:572–576. doi: 10.1097/RLI.0b013e3181b4c10e. [DOI] [PubMed] [Google Scholar]
- 31.Kim JE, Kim SH, Lee SJ, Rhim H. Hypervascular hepatocellular carcinoma 1 cm or smaller in patients with chronic liver disease: characterization with gadoxetic acid-enhanced MRI that includes diffusion-weighted imaging. AJR. 2011;196:W758–W765. doi: 10.2214/AJR.10.4394. [web] [DOI] [PubMed] [Google Scholar]
- 32.Ichikawa T, Erturk SM, Motosugi U, et al. High-b value diffusion-weighted MRI for detecting pancreatic adenocarcinoma: preliminary results. AJR. 2007;188:409–414. doi: 10.2214/AJR.05.1918. [DOI] [PubMed] [Google Scholar]
- 33.Fukukura Y, Takumi K, Kamimura K, et al. Pancreatic adenocarcinoma: variability of diffusion-weighted MR imaging findings. Radiology. 2012;263:732–740. doi: 10.1148/radiol.12111222. [DOI] [PubMed] [Google Scholar]
- 34.Wu LM, Xu JR, Ye YQ, Lu Q, Hu JN. The clinical value of diffusion-weighted imaging in combination with T2-weighted imaging in diagnosing prostate carcinoma: a systematic review and meta-analysis. AJR. 2012;199:103–110. doi: 10.2214/AJR.11.7634. [DOI] [PubMed] [Google Scholar]
- 35.Catalano OA, Choy G, Zhu A, Hahn PF, Sahani DV. Differentiation of malignant thrombus from bland thrombus of the portal vein in patients with hepatocellular carcinoma: application of diffusion-weighted MR imaging. Radiology. 2010;254:154–162. doi: 10.1148/radiol.09090304. [DOI] [PubMed] [Google Scholar]
- 36.Feuerlein S, Pauls S, Juchems MS, et al. Pitfalls in abdominal diffusion-weighted imaging: how predictive is restricted water diffusion for malignancy. AJR. 2009;193:1070–1076. doi: 10.2214/AJR.08.2093. [DOI] [PubMed] [Google Scholar]
- 37.Miller FH, Hammond N, Siddiqi AJ, et al. Utility of diffusion-weighted MRI in distinguishing benign and malignant hepatic lesions. J Magn Reson Imaging. 2010;32:138–147. doi: 10.1002/jmri.22235. [DOI] [PubMed] [Google Scholar]
- 38.Miller FH, Wang Y, McCarthy RJ, et al. Utility of diffusion-weighted MRI in characterization of adrenal lesions. AJR. 2010;194:W179–W185. doi: 10.2214/AJR.09.2891. [web] [DOI] [PubMed] [Google Scholar]
- 39.Wiggermann P, Grutzmann R, Weissenbock A, Kamusella P, Dittert DD, Stroszczynski C. Apparent diffusion coefficient measurements of the pancreas, pancreas carcinoma, and mass-forming focal pancreatitis. Acta Radiol. 2012;53:135–139. doi: 10.1258/ar.2011.100252. [DOI] [PubMed] [Google Scholar]
Associated Data
This section collects any data citations, data availability statements, or supplementary materials included in this article.


