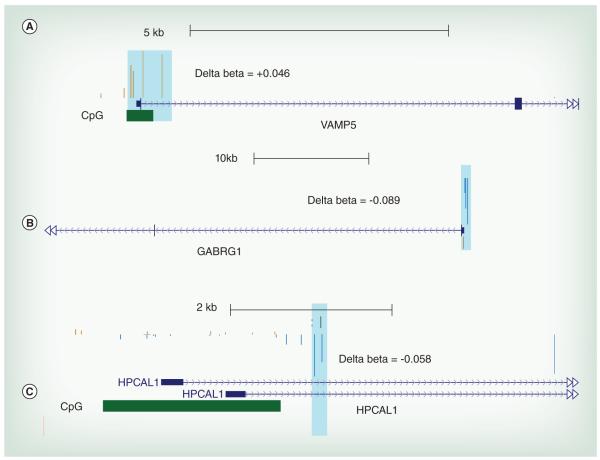
Figure 3. The representative University of California, Santa Cruz genome browser plot for candidate genes.
The delta beta value was calculated by subtracting the mean of β values for cases with high BLL samples (≥5 μg/dl) from the mean of β values for controls (BLL ≤ 5 μg/dl). The resulting delta beta was mapped to genome to visualize the estimated changes in methylation in UCSC genome browser for regions mapping to differentially methylated clusters (DMCs). The position of CpG Island is also shown. (A) Representative figure for Vamp5 for DMCs conserved in both males and females. This DMC shows a ~3% increase in DNA methylation in the promoter associated region. (B) Representative figure for GABRG1 for a male-specific Pb-associated DMC. This Pb-associated DMC shows an ~8% decrease in DNA methylation around the transcription start site (TSS) of the gene. (C) Representative figure for HPCAL1 for a female-specific Pb-associated DMC. This Pb-associated DMC shows a ~3.8% decrease in DNA methylation in a promoter associated region.

