

Abstract
Overweight and obesity is a rapidly expanding health problem in children and adolescents. Obesity is associated with greater bone mineral content that might be expected to protect against fracture, which has been observed in adults. Paradoxically however, the incidence of bone fractures has been found to increase in overweight and obese children and adolescents. Prior studies have shown some reduced mechanical properties as a result of high-fat diet (HFD) but do not fully address size-independent measures of mechanical properties, which are important to understand material behavior. To clarify the effects of HFD on the mechanical properties and microstructure of bone, femora from C57BL/6 mice fed either a HFD or standard laboratory chow (Chow) were evaluated for structural changes and tested for bending strength, bending stiffness and fracture toughness. Here we find that in young obese high fat fed mice all geometric parameters of the femoral bone, except length, are increased but strength, bending stiffness and fracture toughness all are reduced. This increased bone size and reduced size-independent mechanical properties suggests that obesity leads to a general reduction in bone quality despite an increase in bone quantity; yield and maximum loads, however, remained unchanged, suggesting compensatory mechanisms. We conclude that diet-induced obesity increases bone size and reduces size-independent mechanical properties of cortical bone in mice. This study indicates that bone quantity and bone quality play important compensatory roles in determining fracture risk.
Keywords: Obesity, cortical bone, fracture risk, fracture toughness, strength
Introduction
Obesity is an increasingly prevalent medical condition [1], which is associated with other medical problems such as diabetes and heart disease [2]. A number of public health studies have linked adult obesity with increased bone-mineral density and content and reduced fracture risk in adults [3,4,5,6,7,8,9,10]. Despite this trend in adults, an increased fracture incidence has been seen in adolescents and children when compared to age-matched controls [11,12,13].1 Children and adolescents who are overweight tend to also have poorer posture control and body position sense that their normal weight peers [14,15,16], which is likely a contributing factor even when diabetes is not present. However, in the general context, the question arises whether obesity can be related to microstructural and mechanical behavior changes in bone, i.e., to bone quality, in addition to higher bone mass (bone quantity), to explain the altered fracture risk, especially in adolescents and children who exhibit increased fracture incidence with obesity. Surprisingly, only a few studies have addressed this question using animal models. Rat studies have found reductions in yield and maximum stresses, energy absorption, structural rigidity and failure loads, despite larger bone sizes as a result of high-fat and high-sugar diet-induced obesity [17,18,19]. Conclusions have not always been consistent; however, in general, a significant decrease in mechanical performance (reduced bone quality) concurrent with an increase in bone size (increased bone quantity) has been reported.
Most prior studies have focused on properties such as failure load and energy absorption which do not account for changes in the bone cross-section area, thereby confounding the effects of bone quality and quantity. To fully understand the mechanical integrity of the bone and its resistance to fracture, size-independent mechanical properties should be measured [20], including yield and maximum stresses, stiffness and fracture toughness. Strength, defined by the yield stress at the onset of permanent deformation or maximum strength at the peak load before fracture, is a measure of the force/unit area that the bone can withstand. Stiffness is related to the elastic modulus and defines the force required to give a specific elastic strain. The fracture toughness measures resistance to fracture. Additionally, although most prior studies have involved rats, the use of mice allows for greater genetic control which could be used in future studies to identify specific biological factors that are responsible for the high-fat diet-induced changes in bone.
Two possible ways by which obesity could affect bone properties are increased body mass and altered secretion of biological factors. Although the contribution of body mass to bone size and quality has been debated, it is well established that bone responds to external loads and that lean mass is more important than fat mass at predicting bone size and mineral density/content measures [21,22,23,24,25,26,27]. The latter observation is further supported by research showing that remodeling is influenced by dynamic rather than static loads [28,29].
The levels of several hormones are altered by obesity, many of which can impact bone. Adipocyte-derived hormones such as leptin, adiponectin, and resistin also play a role in bone's response to obesity by a variety of mechanisms [7]. As leptin influences osteoblast activity directly and indirectly through the central nervous system, it is typically considered in studies involving obesity and bone. Additionally, it has been suggested that insulin-like growth hormone I (IGF-I) acts to increase bone size [30], and is an interesting factor to consider in this study as increased IGF-I concentrations have been observed with increasing weight [31].
Despite the complex relationship between fat and bone, described succinctly in ref. [7], it is evident that both fat mass and lean mass affect bone health. The purpose of this study is to determine whether diet-induced obesity affects bone-tissue quantity (bone size and mineral quantity measures), bone quality (defined by mechanical properties that affect fracture but are independent of bone size), or combinations of the two.
Materials and Methods
Animals
All protocols were approved by the Institutional Animal Care and Use Committee and performed according to federal guidelines for the care and use of animals in research. 30 four-week old C57BL/6 male mice were fed a high-fat diet (Research Diets High-Fat Diet 60 kcal% fat, 20 kcal% carbohydrate, 20 kcal% protein) (n=15 “HFD” group) or standard laboratory chow (PicoLab Mouse Diet 21.6 kcal% fat, 55.2 kcal% carbohydrate, 23.2 kcal% protein) (n=15, “Chow” group) for a diet duration of 19 weeks. All mice, grouped in cages of five animals each, were maintained under controlled temperature and photoperiod (12 hr light, 12 hr dark) with food and water provided ad libitum.
Body composition
Body weight was measured starting on postnatal day 37. At one-week intervals throughout the study and once prior to sacrifice, all mice were weighed. Fat and lean body mass, percent fat, areal bone-mineral density (aBMD) and bone-mineral content (BMC) were determined at the completion of the study by dual-energy x-ray absorptiometry (DXA), as described by the manufacturer (Lunar PIXImus mouse densitometer).
Blood Collection
Blood was collected at two intervals. In the first instance, mice were fasted for 4 hr before blood was collected through submandibular bleeding. For the second round of blood collection, mice were decapitated within 30 sec of mouse handling. Blood was collected in tubes containing ethylene-diaminetetraacetic acid (EDTA) and plasma was immediately separated by centrifugation and frozen at −80°C.
Blood Glucose and Glucose Tolerance Test
Blood glucose levels were measured from the tail vein using an Ascensia ELITE XL Blood Glucose Meter. Fasting glucose measurements at 15 and 21 weeks of age as well as the glucose tolerance test at age 22 weeks were performed after 4 hr of fasting. For the glucose tolerance test mice were injected IP with a 20% glucose solution at 2g of glucose per kg of body weight and glucose levels were measured at 15, 30, 60 and 120 minutes.
Leptin Level Measurement
Serum leptin levels were measured using a Crystal Chem Inc. Mouse Leptin ELISA Kit.
IGF-I Level Measurement
Serum IGF-I levels were measured using an Immunodiagnostic Systems Inc. Mouse/Rat IGF-I ELISA Kit.
Mechanical testing
Following sacrifice, the whole mice were stored at −20°C until dissection of the femora. At dissection, the right and left femora were isolated from any soft tissue with scissors and scalpel, after which bones were wrapped in gauze soaked with Hanks’ Balanced Salt Solution (HBSS) and stored at −20°C. Prior to testing, the femora were thawed in room-temperature HBSS, and the size and geometry of all samples were measured with calipers. The left femora were tested in unnotched three-point bending to measure bending strength and stiffness. The right femora were tested in notched three-point bending to measure the fracture toughness. For notched testing, the femoral shaft was notched in the mid-diaphyseal region through the posterior wall using the method described by Ritchie et al. [32]. Notches were sharpened by polishing in 1 μm diamond paste with a razor blade to a root radius of ~5-10 μm. Notched and unnotched femora were placed in a three-point bending rig such that the posterior side was in tension and the anterior was in compression. Femora were submerged in HBSS at 37°C for 1 min to acclimate, then tested in the same environment at a displacement rate of 0.001 mm/s until fracture occurred. Broken halves were then dehydrated and the fracture surface was examined in an environmental SEM (Hitachi S-4300SE/N ESEM, Hitachi America). The femoral cross-sectional area and second moment of inertia were computed from fracture surface images. Notch half-crack angles were determined in the SEM from the fracture surface using techniques described in ref. [32]. Stresses and strains were computed in accordance with the methods described by Akhter et al. [33]. The yield strength was determined as the stress at 0.2% plastic strain, and maximum strength as the stress at peak load. Bending stiffness was calculated as the slope of the linear region of the stress-strain curve. Fracture toughness values were defined at the onset of unstable fracture, i.e., at the point of instability, using the procedures described in ref. [32] for the toughness evaluation of small animal bone.
X-ray computed tomography and vBMD
X-ray micro-tomography (SRμCT) was employed to measure the volumetric bone mineral density (vBMD) of all samples using synchrotron beamline 8.3.2 at the Advanced Light Source, Lawrence Berkeley National Laboratory. The three-dimensional resolution was 4.45 μm. The samples were scanned in absorption mode at 14 keV and the reconstructed images were obtained using a filtered back-projection algorithm. The mean vBMD for each femur was calculated from a collection of the two-dimensional reconstructed slices [34].
Scanning electron microscopy
Scanning electron microscopy (SEM) was performed to evaluate structural differences at the tissue level near the fracture surface on the medial and lateral sides of the femur. After mechanical testing, five samples each from the Chow and HFD groups were mounted in Buehler Epoxycure Resin (Buehler) and the surface polished to 0.05 μm with diamond polishing suspension, then evaluated in an environmental SEM operating at 20 kV.
Transmission electron microscopy
Transmission electron microscopy (TEM) was performed with a JEOL2000 TEM (JEOL Ltd.), operating at 120 kV, on three specimens each from the Chow and HFD groups to discern whether there were differences between the two groups in the bone structure at sub-micrometer dimensions. Images were taken from the medial and lateral cortex near the fracture surface of each specimen. Specimens were fixed in anhydrous ethylene glycol for 24 hr, dehydrated by rinsing in 100% ethanol three times for 5 min in acetonitrile, and then infiltrated with resin (Agar Scientific) over several days. Mounting resin was prepared with 12 g Quetol, 6.5 g methyl nadic anhydride (MNA), 15.5 g nonenylsuccinic anhydride (NSA), and 0.7 g benzlydimethylamine (BDMA). The samples were agitated at room temperature in 1:1 solutions of acetonitrile and resin for 1 day, then 1:2 acetonitrile resin for 1 day, and finally 100% resin for 3 days under vacuum; the resin was changed every 24 hr. Samples were then cured in fresh resin for 24 hr at 60°C. Silver to gold sections (70–90 nm) were cut onto distilled water with an ultramicrotome using a 35 degree diamond knife. Samples were collected immediately on lacy carbon 300 mesh copper grids, and dried for 1 hr at 37°C.
Statistical analysis
Measured values are presented as mean ± standard deviation. Two-tailed independent sample Student's T-tests were executed to determine differences in measured variables between the Chow and HFD groups (SPSS 15.0, SPSS Inc). Differences were considered to be significant at P<0.05. Correlation analysis was performed within each group (Chow and HFD) to identify trends that might be diet-independent. To mitigate the risk of Type I errors, related measurements that were highly and positively correlated were grouped together and given a composite score (sum of Z-scores). For those measures which did not correlate to similar measurements (Py, Pu) or were conceptually unique (Kc, vBMD), the Z-score for that measurement was used in the analysis without any modification. Correlation analysis was performed between scores of predictive measures (mineral density, composite bone size score and two body composition measures) and mechanical property outcomes (composite strength and modulus score, fracture toughness and two load measures). The correlation between yield and maximum loads was weak, so these were not combined into a composite.
Results
Metabolic phenotype of experimental animals: validation of obesity model
To explore the effects of obesity on cortical bone, mice were fed a high-fat diet (HFD) for 19 weeks (Fig. 1a). As shown in Figure 1b, HFD mice gained weight twice as fast as the Chow (control) group (n=15 each group). Both groups stopped gaining weight after week 18 (week 14 of the diet); mean weights stabilized at 34.7± 2.1 g for the Chow group and 47.3± 3.4 g for the HFD group. DXA analysis revealed that HFD mice had 98% more fat mass than Chow mice (P<0.001) (Fig. 1c), but showed similar lean mass. As expected, the serum leptin concentration was significantly increased by the high-fat diet. The HFD group had 385% higher serum leptin concentration than in Chow (P<0.001) (Fig. 1d). Also, IGF-I levels were increased significantly in the HFD group (P<0.01); the HFD group showed a 34% increase in serum IGF-I concentration compared to Chow (Fig. 1e). Increased weight, fat mass, and serum concentrations of leptin and IGF-I confirm that the high-fat diet provides a successful model of obesity for the current study. Blood glucose levels indicated that hyperglycemia developed within the last week or so of the study, which is unsurprising in diabetes-prone C57Bl6 mice, but this diabetic condition was not present throughout most of the length of the study. Details of the blood glucose tests are discussed in the Appendix.
Fig. 1. Validation of Obesity Model: Body Composition, Serum Leptin Concentration, and Bone Mineral Measures.

(a) Representative HFD and Chow mice. Typical HFD mouse (top) and typical Chow mouse (bottom) at the conclusion of the 19 week diet period; (b) Average weekly weights of Chow and HFD groups. Horizontal axis is mouse age in weeks; (c) lean body mass (left) and fat body mass (right) for Chow and HFD groups at conclusion of study; (d) serum leptin concentration at conclusion of study; (e) serum IGF-I concentrations at the concluion of study. No difference was observed in lean mass, but signficant increase in the fat mass and in leptin concentration for the HFD group. n=15 for the Chow group and n=14 for HFD group. (** P<0.01, *** P<0.001)
Bone densitometry: bone-mineral content but not density increased with high-fat diet
To understand the effects of obesity on cortical bone in mice, it is critical to compare bone-mineral content and density between test groups. As shown in Figure 2a, bone-mineral content (BMC) levels were 7.5% higher in HFD mice than in Chow mice (P<0.001), consistent with their increased bone size. Although the total amount of bone was larger, the whole-body areal bone mineral density (aBMD), measured using DXA, was not significantly different between the Chow and HFD groups (Fig. 2b). Further evaluation of the DXA data revealed that spinal BMC and aBMD did increase significantly with weight, but that femoral BMC and aBMD were unchanged in the HFD group (Figs. 2c,2d,2f,2g, respectively). Synchrotron tomography was used to evaluate the volumetric bone mineral density (vBMD) of the femoral cortex. This yielded a similar result, with no significant difference between the Chow and HFD groups (Fig. 2e); this is consistent with prior reports that lean body mass, rather than fat mass, is more predictive of BMD [23,25,26,35].
Fig. 2. Bone quantity measures – Bone mineral.

(A) Whole-body bone mineral content (BMC); BMC is higher in the HFD group, which is expected because bones are larger (*** P<0.001). (b) Whole-body areal bone mineral denstiy (aBMD) is unchanged, which is not suprising as the lean body mass was unchanged (see Fig. 1). (c) Bone mineral content of the spine and (d) areal bone mineral density of the spine are significantly higher as a result of HFD (* P<0.05). (e) volumetric bone mineral density (vBMD) of the femoral cortical bone as well as (f) femoral BMC and (g) are not significantly different between groups.
Bone geometry: cortical bone size measures increase with high-fat diet
Since bone geometry can have a significant impact on the macro-mechanical behavior of cortical bone [36,37,38], several bone geometry parameters were measured; data are summarized in Figure 3. With the exception of bone length, all size parameters from the HFD group were significantly larger. Cortical wall thickness (Ct.Th.) was increased by 10.5% (P=0.012), outer cortical radius (Ro) by 6.1% (P=0.005), inner cortical radius (Ri) by 4.8% (P=0.027), cortical cross-sectional area (Ct.X-Sect.A.) by 11.4% (P=0.009), and the second moment of area (M.A.) by 26.7% (P=0.004). Overall, there was a clear increase in bone size with diet-induced obesity.
Fig. 3. Cortical bone quantity measures – Bone size.

(a) Average cortical thickness; (b) outer cortical thickness; (c) inner cortical radius; (d) cortical cross-sectional area; and (e) second moment of area. Significant increase (* P<0.05; ** P<0.01) for the HFD group is observed for all measures except (f) femoral length. (g) Whole-body bone mineral content (BMC); BMC is higher in the HFD group, which is expected because bones are larger (*** P<0.001). (f) Whole-body areal bone mineral denstiy (aBMD); and (i) volumetric bone mineral density (vBMD) of the femoral cortical bone are not significantly different between groups, which is not suprising as the lean body mass was unchanged (see Fig. 1). n=15 for the Chow group and n=14 for HFD group.
Mechanical testing: Size-independent mechanical properties decrease with obesity, but size-dependent mechanical properties are maintained
To evaluate the quality of the cortical tissue, size-independent mechanical properties were measured. Additionally, size-dependent properties, which are an indication of the load-bearing ability of cortical bone, were also determined. Mechanical test data are summarized in Figure 4. Size-independent parameters which indicate the inherent mechanical properties of the tissue, specifically bending strength, bending stiffness and fracture toughness, were all lower in the HFD group than in the Chow group. Bone in the HFD group displayed 24% lower yield strengths (σy, P<0.001), 15% lower maximum strengths (σu, P=0.012), 19% lower bending stiffness (E, P=0.017), and 13% lower fracture toughness (Kc, P=0.027). Based on the increased BMC, a decrease in the measured strains for yielding and fracture might be anticipated; however, no changes were observed in yield or maximum strains (εy, εu); these parameters are geometry-sensitive as strain is proportional to the outer bone radius). The size-dependent mechanical property measurements of yield load (Py) and maximum load (Pu), which are indicative of the load-bearing capacity of the actual bone, also did not change significantly. The reduction in size-independent mechanical properties in the HFD group indicates that the quality of the bone tissue is reduced, despite its increased size.
Fig. 4. Cortical bone quality: whole-bone and tissue-level mechanical property measurements.

(a) Yield strength; (b) maximum strength; (c) bending stiffness; (d) fracture toughness, Kc; (e) yield load; (f) maximum load; (g) yield strain; and (h) maximum strain. Measured size-independent mechanical properties (except strain) were significantly decreased for HFD group vs. Chow group despite increased bone size (a-f); these parameters are an indication of bone-tissue quality. Size-dependent measures which address whole-bone behavior (specifically, load) did not differ between groups indicating a compensatory mechanism between bone size and tissue quality. n=15 for the Chow group and n=14 for HFD group (* P<0.05; ** P<0.01; *** P<0.001).
Structural characterization: mineral organization and lamellar alignment of cortical bone is reduced in obese mice
The mechanical testing suggested that the quality of bone matrix is affected by the HFD condition. This was further assessed by scanning (SEM) and transmission (TEM) electron microscopy. SEM images indicate that the orientation of osteocyte lacunae and the lamellar structure, are less ordered and aligned in the HFD group (Fig. 5). Corresponding TEM images from the Chow and HFD mouse cortical bone are shown in Figure 6. In the Chow group, the bone was well aligned and appeared to be well organized (Figs. 6a and 6b); the HFD group displayed poorer mineral organization (Figs. 6c and 6d). Diffraction patterns taken from several regions were indexed to correspond to hydroxyapatite in both groups. Diffraction patterns (not shown) taken from the Chow group more frequently displayed characteristic (002) plane arcs related to oriented bone, confirming that the mineral organization was greater in normal bone than HFD bone.
Fig. 5. Through-wall SEM images of fracture region showing tissue structure at the whole-bone scale.
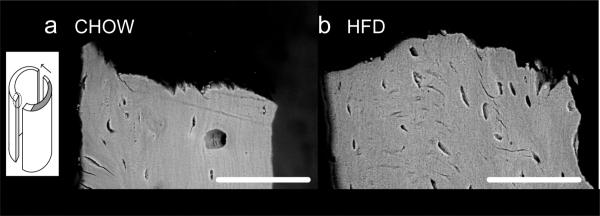
a) Cortical wall in bone from Chow group; (b) Cortical wall in HFD group. The scale bar indicates 100 μm. The medial cortex in HFD bone (b) shows reduced alignment of osteocyte lacunae and reduction in lamellar alignment at the tissue level. These images are representative of five samples each of HFD and Chow. The inset indicates that images were taken from vertical sections through a region beyond the notch at the crack surface. The dark grey region indicates the notch, and the arrow indicates direction of crack growth, with crack propagation happening evenly from both sides of the notch.
Fig. 6. High-magnification TEM images of structure and mineral organization.

(a) and (b) Mineral organization of bone from Chow group; as well as (c) and (d) mineral organization of bone from HFD group. The scale bar indicates 200 nm. Mineral appears more poorly aligned and organized in HFD bone than in Chow bone, suggesting a reduction in microstructural tissue quality.
Correlation Analysis: Bone-size measures, rather than body composition or bone-mineral measures, are most predictive of mechanical properties
In order to evaluate relationships between bone size, mechanical properties, and body composition, correlation analyses were performed between scores for each measure; correlation coefficients and corresponding P-values are summarized in Table 1 (Q-Q analysis revealed that the data were normally distributed). In both Chow and HFD groups, bone-size measures have the highest correlation coefficients with size-independent mechanical measures, although significance was more difficult to achieve in the Chow group due in part to the smaller variances within this group. In the Chow group, vBMD was correlated positively with fracture toughness (Kc), and fat body mass (FBM) was correlated negatively with maximum load (Pu). In HFD group, lean body mass (LBM) was correlated negatively with strength and bending modulus.
Table 1.
Correlation coefficients between standardized properties in bone from (a), (c) Chow and (b), (d) HFD groups. Coefficients from correlation analysis applied between standardized mechanical properties and standardized bone and physiological properties of (a) Chow group and (b) HFD group. In cases where measurements were related and highly positively correlated, a composite score was used in the analysis. Bone size is the largest predictor of mechanical properties, more so than bone-mineral measures or body composition. Interestingly, size-independent measures of bone quality are most affected by the size of the bone, which implies a reduced quality with increasing quantity. Correlation coefficients between body mass measures and bone size measures show that LBM is positively correlated with bone size in both groups (c) & (d), and that FBM is very weakly negatively correlated with bone size. HFD (d) was almost significant for LBM-bone size correlation (P=0.053).
| a. Chow (n=15) | b. HFD (n=14†) | |||||||
|---|---|---|---|---|---|---|---|---|
| Size – independent measures | Size – dependent measures | Size – independent measures | Size – dependent measures | |||||
| Predictors | (σy, σu, E) | Kc | P y | P u | (σy, σu, E) | Kc | P y | P u |
| vBMD | 0.12 | 0.55* | 0.08 | −0.42 | −0.24 | −0.07 | 0.24 | −0.01 |
| (M.A.A,Ro) | −0.44 | −0.43 | 0.23 | 0.19 | −0.86*** | −0.59* | 0.57 | −0.04 |
| LBM | −0.37 | −0.18 | 0.25 | −0.07 | −0.67* | −0.16 | 0.50 | 0.02 |
| FBM | −0.30 | 0.16 | −0.11 | −0.53* | 0.41 | 0.10 | −0.54 | −0.02 |
| c. Bone size in Chow- (M.A.,A,Ro) | d. Bone size in HFD - (M.A.A,Ro) | |||||||
| LBM | 0.514* | 0.548 | ||||||
| FBM | −0.215 | −0.315 | ||||||
One mouse was found to be diabetic and was excluded from all analyses.
P<0.05
** P<0.01
P<0.001.
vBMD = volumetric bone-mineral density; M.A.= second moment of area; A = Ct. cross-sectional area; Ro = outer Ct. Rd; LBM = lean body mass; FBM = fat body mass; σy = yield strength; σu = maximum strength; E = bending modulus; Kc = fracture toughness; Py = yield load; Pu = maximum load. (M.A., A, Ro ) = composite bone size score, (σy, σu, E) = composite strength and modulus score.
We also find that LBM is positively correlated with bone size measures, and FBM is weakly negatively correlated with bone size measures (Table 1).
Overall, a trend of decreasing mechanical properties with concurrent increase in bone size is apparent in the correlation analysis, but it is unclear at this time whether bone-size changes lead to bone-tissue quality changes, vice versa, or whether size and tissue quality change simultaneously. In this respect, further study is needed to determine whether this is a causal or correlative relationship.
Discussion
It is clear that a high-fat diet leads to obese mice with enhanced bone quantity (larger bone size and mineral content) but with diminished bone quality (lower size-independent mechanical properties), as compared to bone from mice on a standard Chow diet. Interestingly, while the (size-independent) bone stiffness, strength and toughness clearly deteriorated due to the high-fat diet, the yield and maximum loads that the femurs could sustain prior to failure were essentially unchanged by diet. Indeed, in terms of the loads the bones can withstand, the increase in bone size in the HFD group occurred to the extent necessary to maintain a given load-bearing capability. This argument supports the hypothesis that bone adapts to maintain the optimal size and material properties for a particular set of normal, or daily, physiological conditions, deemed “customary loading” by Turner [29]. Once a certain balance has been reached between these customary loads and the amount of bone necessary to support these loads, no more energy is expended in improving bone quality, a notion supported by Turner in his discussion of threshold behavior for remodeling activation in bone.2
In addition to loading, hormones play an important role in bone response to obesity. Leptin, which controls body weight, reproduction and bone remodeling, is secreted by adipocytes and is found in higher concentrations in the obese. Its actions in bone are discussed in detail by Karsenty [39] and references therein. Whether leptin's specific effects are beneficial or antagonistic to bone quality is under debate [35,40,41,42,43,44,45,46], although there is some consensus that increased leptin production in humans is associated with higher bone mineral density and bone size [7]. A proposed mechanism for this action is posited by Baldock and others whereby increased leptin production inhibits the action of neuropeptide Y (NPY) in the hypothalamus. As NPY is a potent inhibitor of bone growth, its inhibition by the presence of increased leptin production is consistent with increased body weight and bone size, especially increased periosteal circumference of long bones [47,48]. Finally, increased bone size, especially the periosteal circumference, as well as increased body weight have been associated with increased serum concentrations of IGF-I [30,31]. We do observe significant increases in serum IGF-I for the HFD group, which could explain at least some of the increased bone size, although this was not explored as a possible causation in this study.
We note that the mice in this study were young (4 weeks) at the beginning of the study. The reduction of quality of bone tissue despite increased body weight is in agreement with clinical observations that adolescents and children have increased bone fracture incidence with obesity [11]. Whether the qualitative effects would be seen in adult mice remains unclear at this time, although we do postulate that increases in bone size with obesity would be observed in adult or aged mice. Reduced fracture incidence in adults suggests that the qualitative reduction seen in adolescent animals would be lessened in adults. Furthermore, our observations that LBM is positively correlated with bone size measures (Table 1) are also consistent with prior studies looking into independent effects of lean body mass and fat body mass on bone size in adolescents [23,45,49]. Together, these similarities point to consistency between animal studies and observations in large human cohorts and also reveal the need for additional studies to investigate the progression of bone health with obesity.
It is conceivable that the effects of this study could be attributed to an increased rate of bone growth in the HFD group or to dietary choice. We show that bone indeed grew faster in the HFD group, as the bone size in this group is larger than that in the Chow group after a similar length of study, although we do not directly measure changes in growth rates between groups. It is possible the HFD femora grew to accommodate accumulating weight faster than the system can optimally support, thereby resulting in poorer quality bone. This behavior of rapid bone deposition to support weight gain is well known in woven bone in the long bones of livestock that need to walk soon after birth. Additionally, it has been observed that bone growth rates affect bone microarchitecture in birds [50] and many other animals. It is widely accepted that rapidly growing bone will be of inferior structural quality to that of more slowly grown bone [51] although further study could illuminate more specific growth rate – structure relationships, especially if rapidly growing animals such as high-growth, or hg, mice are compared to controls. SEM images showing differences in the apparent structural quality of bone in obese mice compared to the Chow group (Fig. 5) lend some credence to this hypothesis; TEM images also suggest a reduction in material quality with concurrent increase in weight (Fig. 6).
In examining whether the observed effects are due to obesity and not simply diet quality, standardized correlation analysis (Table 1) for the Chow and HFD groups suggest that diet choice is not the sole cause of the effects observed. This follows from the regression data where the general trends that exist in the overall study (in HFD vs. Chow groups) are also found within the individual groups. For example, the negative correlations between size-independent mechanical behavior and bone size are observed within both the Chow and HFD groups. Most interestingly, larger bones are consistently associated with poorer mechanical properties, independent of the obesity condition. This implies that larger bones in obese individuals are not necessarily protective against fracture, a fact which is supported by similar yield and maximum loads between the two groups. Since bone size increases and mechanical property decreases seem to be occurring concurrently, and are both brought about by obesity, bone size and size-independent mechanical properties are linked in the correlation analysis of this work.
We do note the presence of a hyperglycemic state in the majority of the HFD mice within the last week of the study. While the diabetic condition did not persist throughout our study, as indicated by the fasting blood glucose levels at age 15 and 21 weeks, it did appear to come into play by age 22 weeks, as indicated by the fasting blood glucose levels of the glucose tolerance test. Diabetics are known to have increased fracture risk, which is consistent with the results presented here, and it is possible that the hyperglycemia played a role in the results observed. The specific role of hyperglycemia was not investigated as part of this study; however, the short length of time that hyperglycemia was present in the obese mice makes it an unlikely candidate as the sole contributor to the effect seen.
In conclusion, this study has shown that diet-induced obesity in mice increases bone size yet decreases the (size-independent) mechanical properties of cortical bone. The maximum loads that the bones can sustain, however, remain essentially unchanged with the implication that the quality and quantity of bone act in a compensatory manner to optimize the load-bearing behavior of bone.
Acknowledgements
This study was supported by the Laboratory Directed Research and Development Program of Lawrence Berkeley National Laboratory (LBNL), funded by the U.S. Department of Energy under contract no. DE-AC02-05CH11231. Animal study work was supported by the National Institutes of Health under grant nos. RO3DE016868 and RO1-60540, 68152, as well as American Heart Association CDA 740041N. Transmission electron microscopy work was supported by the British Council. We acknowledge the use of the x-ray synchrotron micro-tomography beamline (8.3.2) at the Advanced Light Source at LBNL, supported by the Office of Science of the Department of Energy, and the laboratory of Dr. Raffaella Carzaniga in the Electron Microscopy Centre at Imperial College London (South Kensington campus) where TEM sample preparations were performed.
Appendix. Blood Glucose Levels
Blood glucose levels indicate that diabetes was likely present in most of the HFD mice in the final week of the study, but was not present for the first 18 weeks out of the 19 week study. Evaluation of levels at age 15, 21, and 22 weeks indicate that only two mice had blood glucose levels above 200 mg/dL at week 21, but 10 out of 15 HFD mice were over 200 mg/dL at week 22 and one mouse had uncontrolled diabetes. The uncontrolled diabetic mouse also died a few days prior to sacrifice and was excluded from any further analysis. None of the Chow mice exhibited blood glucose levels above 200 mg/dL, so this level was taken to be a cut-off for a diabetic state in the mice. Figure 7 shows the blood glucose levels at age 15, 21, and 22 weeks, as well as the glucose tolerance test results at age 22 weeks. The mice were sacrificed two days following the glucose tolerance test, so Figs. 7c-d reflect the glycemic condition of the mice at the conclusion of the study. There is a possibility that such incidence of diabetes could have had some influence on the observed data; however, as this diabetic condition presented itself very late in the study, we conclude that it is unlikely to be the sole contributor to the effects observed.
Fig. 7. Blood glucose levels after 4 hour fasting.

(a) Blood glucose levels at age 15 weeks; (b) blood glucose levels at age 21 weeks; (c) baseline blood glucose levels in glucose tolerance test at age 22 weeks; (d) glucose tolerance test curve at age 22 weeks. At week 21, two HFD mice exhibited blood glucose levels over 200 mg/dL, and at week 22, 10 out of 15 HFD mice were hyperglycemic. One mouse at age 22 weeks had uncontrolled diabetes and died shortly prior to the conclusion of the study.
Footnotes
Conflicts Of Interest: All authors have no conflicts of interest.
It should be noted that fracture risk in adults with type 2 diabetes does tend to increase in adults [12] (see Appendix); although fracture rates of diabetic children have not been reported, reduced bone mineral content and bone size have been observed in type 1 diabetic adolescents, which does imply an increased fracture risk [13].
Turner discusses “adaptation of bone cells to customary loading.” They will adapt, i.e., bone will grow to accommodate increased loading or will resorb to accommodate decreased loading, until a certain equilibrium has been reached. Once the system reaches a medium zone where “customary” loads are supported by the bone that is available in the body, no more bone adaptation will take place because this adaptation is an energy-expending mechanism.
References
- 1.Flegal KM, Carroll MD, Ogden CL, Johnson CL. Prevalence and trends in obesity among US adults, 1999-2000. JAMA. 2002;288:1723–7. doi: 10.1001/jama.288.14.1723. [DOI] [PubMed] [Google Scholar]
- 2.Kopelman PG. Obesity as a medical problem. Nature. 2000;404:635–43. doi: 10.1038/35007508. [DOI] [PubMed] [Google Scholar]
- 3.Edelstein SL, Barrett-Connor E. Relation between body size and bone mineral density in elderly men and women. Am J Epidemiol. 1993;138:160–9. doi: 10.1093/oxfordjournals.aje.a116842. [DOI] [PubMed] [Google Scholar]
- 4.Schott AM, Cormier C, Hans D, Favier F, Hausherr E, Dargent-Molina P, Delmas PD, Ribot C, Sebert JL, Breart G, Meunier PJ. How hip and whole-body bone mineral density predict hip failure in elderly women: the EPIDOS prospective study. Osteoporos Int. 1998;8:247–54. doi: 10.1007/s001980050061. [DOI] [PubMed] [Google Scholar]
- 5.Glauber HS, Vollmer WM, Nevitt MC, Ensrud KE, Orwoll ES. Body weight versus body fat distribution, adiposity, and frame size as predictors of bone density. J Clin Endocrinol Metab. 1995;80:1118–23. doi: 10.1210/jcem.80.4.7714079. [DOI] [PubMed] [Google Scholar]
- 6.Ensrun KE, Ewing SK, Stone KL, Cauley JA, Bowman PJ, Cummings SR. Intentional and unintentional weight loss increase bone loss and hip fracture risk in older women. J Am Geriatr Soc. 2003;51:1740–7. doi: 10.1046/j.1532-5415.2003.51558.x. [DOI] [PubMed] [Google Scholar]
- 7.Reid IR. Relationships between fat and bone. Osteoporos Int. 2008;19:595–606. doi: 10.1007/s00198-007-0492-z. [DOI] [PubMed] [Google Scholar]
- 8.Albala C, Yanez M, Devoto E, Sostin C, Zeballos L, Santos JL. Obesity as a protective factor for postmenopausal osteoporosis. Int J Obesity. 1996;20:1027–32. [PubMed] [Google Scholar]
- 9.Nguyen ND, Pongchaiyakul C, Center JR, Eisman JA, Nguyen TV. Abdominal fat and hip fracture risk in the elderly: The Dubbo osteoporosis epidemiology study. BMC Muscoskelet Disord. 2005;6:11–6. doi: 10.1186/1471-2474-6-11. [DOI] [PMC free article] [PubMed] [Google Scholar]
- 10.De Laet C, Kanis JA, Oden A, Johanson H, Johnell O, Delmas P, Eisman JA, Kroger H, Fujiwara S, Garnero P, McCloskey EV, Mellstrom D, Melton LJ, 3rd, Meunier PJ, Pols HAP, Reeve J, Silman A, Tenenhouse A. Body mass index as a predictor of fracture risk: A meta-analysis. Osteoporosis Int. 2005;16:1330–8. doi: 10.1007/s00198-005-1863-y. [DOI] [PubMed] [Google Scholar]
- 11.Taylor ED, III, Theim KR, Mirch MC, Ghorbani S, Tanofsky-Kraff M, Adler-Wailes DC, Brady S, Reynolds JC, Calis KA, Yanovski JA. Orthopedic complications of overweight in children and adolescents. Pediatrics. 2006;117:2167–74. doi: 10.1542/peds.2005-1832. [DOI] [PMC free article] [PubMed] [Google Scholar]
- 12.Lipscombe LL, Booth GL, Jamal SA, Hawker GA. The risk of hip fractures in older individuals with diabetes. Diabetes Care. 2007;30:834–841. doi: 10.2337/dc06-1851. [DOI] [PubMed] [Google Scholar]
- 13.Saha MT, Sievanen H, Salo MK, Tulokas S, Saha HH. Bone mass and structure in adolescents with type 1 diabetes compared to healthy peers. Osteoporos Int. 2009;20:1401–1406. doi: 10.1007/s00198-008-0810-0. [DOI] [PubMed] [Google Scholar]
- 14.Hills AP, Parker AW. Locomotor characteristics of obese children. Child Care Health Dev. 1992;18:29–34. doi: 10.1111/j.1365-2214.1992.tb00338.x. [DOI] [PubMed] [Google Scholar]
- 15.Colne P, Frelut ML, Peres G, Thoumie P. Postural control in obese adolescents assessed by limits of stability and gait initiation. Gait Posture. 2008;28:164–169. doi: 10.1016/j.gaitpost.2007.11.006. [DOI] [PubMed] [Google Scholar]
- 16.Wang L, Li JX, Xu DQ, Hong YL. Proprioception of ankle and knee joints in obese boys and nonobese boys. Med Sci Monit. 2008;14:CR129–135. [PubMed] [Google Scholar]
- 17.Brahmabhatt V, Rho J, Bernardis L, Gillespie R, Ziv I. The effects of dietary-induced obesity on the biomechanical properties of femora in male rats. Int J Obesity. 1998;22:813–8. doi: 10.1038/sj.ijo.0800668. [DOI] [PubMed] [Google Scholar]
- 18.Li KC, Zernicke RF, Barnard RJ, Li AFY. Effects of a high-fat sucrose diet on cortical bone morphology and biomechanics. Calcif Tissue Int. 1990;47:308–13. doi: 10.1007/BF02555914. [DOI] [PubMed] [Google Scholar]
- 19.Zernicke RF, Salem GJ, Barnard RJ, Schramm E. Long-term, high-fat-sucrose diet alters rat femoral neck and vertebral morphology, bone mineral content, and mechanical properties. Bone. 1995;16:25–31. doi: 10.1016/s8756-3282(00)80007-1. [DOI] [PubMed] [Google Scholar]
- 20.Turner CH, Burr DB. Basic biomechanical measurements of bone: A tutorial. Bone. 1993;14:595–608. doi: 10.1016/8756-3282(93)90081-k. [DOI] [PubMed] [Google Scholar]
- 21.Burr DB. Muscle strength, bone mass, and age-related bone loss. J Bone Miner Res. 1997;12:1547–51. doi: 10.1359/jbmr.1997.12.10.1547. [DOI] [PubMed] [Google Scholar]
- 22.Frost HM. Obesity, and bone strength and “mass”: A tutorial based on insights from a new paradigm. Bone. 1997;21:211–4. doi: 10.1016/s8756-3282(97)00124-5. [DOI] [PubMed] [Google Scholar]
- 23.Janicka A, Wren TAL, Sanchez MM, Dorey F, Kim PS, Mittelman SD, Gilsanz V. Fat mass is not beneficial to bone in adolescents and young adults. J Clin Endocrinol Metab. 2007;92:143–7. doi: 10.1210/jc.2006-0794. [DOI] [PubMed] [Google Scholar]
- 24.Petit MA, Beck TJ, Lin HM, Bentley C, Legro R, Lloyd T. Femoral bone structural geometry adapts to mechanical loading and is influenced by sex steroids: The Penn State young women's health study. Bone. 2004;35:750–9. doi: 10.1016/j.bone.2004.05.008. [DOI] [PubMed] [Google Scholar]
- 25.Petit MA, Beck TJ, Shults J, Zemel BS, Foster BJ, Leonard MB. Proximal femur bone geometry is appropriately adapted to lean mass in overweight children and adolescents. Bone. 2005;36:568–76. doi: 10.1016/j.bone.2004.12.003. [DOI] [PubMed] [Google Scholar]
- 26.Wu S, Lei SF, Chen XD, Tan LJ, Jian WX, Xu H, Deng FY, Sun X, Xiao SM, Jiang C, Guo YF, Zhu XZ, Deng HW. The contributions of lean tissue mass and fat mass to bone geometric adaptation at the femoral neck in Chinese overweight adults. Ann Hum Bio. 2007;34:344–53. doi: 10.1080/03014460701275749. [DOI] [PubMed] [Google Scholar]
- 27.Pietrobelli A, Faith MS, Wang J, Brambilla P, Chiumello G, Heymsfield SB. Association of lean tissue and fat mass with bone mineral content in children and adolescents. Obesity Res. 2002;10:56–60. doi: 10.1038/oby.2002.8. [DOI] [PubMed] [Google Scholar]
- 28.Lanyon LE, Rubin CT. Static vs dynamic loads as an influence on bone remodelling. J Biomechanics. 1984;17:897–905. doi: 10.1016/0021-9290(84)90003-4. [DOI] [PubMed] [Google Scholar]
- 29.Turner CH. Three rules for bone adaptation to mechanical stimuli. Bone. 1998;23:399–407. doi: 10.1016/s8756-3282(98)00118-5. [DOI] [PubMed] [Google Scholar]
- 30.He J, Rosen CJ, Adams DJ, Kream BE. Postnatal growth and bone mass in mice with IGF-I haploinsufficiency. Bone. 2006;38:826–835. doi: 10.1016/j.bone.2005.11.021. [DOI] [PubMed] [Google Scholar]
- 31.Bluher M, Kahn BB, Kahn R. Extended longevity in mice lacking the insulin receptor in adipose tissue. Science. 2003;299:572–574. doi: 10.1126/science.1078223. [DOI] [PubMed] [Google Scholar]
- 32.Ritchie RO, Koester KJ, Ionova S, Yao W, Lane NE, Ager JW. Measurement of the toughness of bone: a tutorial with special reference to small animal studies. Bone. 2008;43:798–812. doi: 10.1016/j.bone.2008.04.027. [DOI] [PMC free article] [PubMed] [Google Scholar]
- 33.Akhter MP, Cullen DM, Gong G, Recker RR. Bone biomechanical properties in prostaglandin EP1 and EP2 knockout mice. Bone. 2001;29:121–5. doi: 10.1016/s8756-3282(01)00486-0. [DOI] [PubMed] [Google Scholar]
- 34.Vlassenbroeck J, Dierick M, Masschaele B, Cnudde V, Van Hoorebeke L, Jacobs P. Software tools for quantification of X-ray microtomography. Nucl Instr & Meth A. 2007;580:442–5. [Google Scholar]
- 35.Hamrick MW, Pennington C, Newton D, Xie D, Isales C. Leptin deficiency produces contrasting phenotypes in bone of the limb and spine. Bone. 2004;34:376–83. doi: 10.1016/j.bone.2003.11.020. [DOI] [PubMed] [Google Scholar]
- 36.Muller ME, Webber CE, Bouxsein ML. Predicting the failure load of the distal radius. Osteoporosis Int. 2003;14:345–52. doi: 10.1007/s00198-003-1380-9. [DOI] [PubMed] [Google Scholar]
- 37.Black DM, Bouxsein ML, Marshall LM, Cummings SR, Lang TF, Cauley JA, Ensrud KE, Nielson CM, Orwoll ES. Proximal femoral structure and the prediction of hip fracture in men: A large prospective study using QCT. J Bone Miner Res. 2008;23:1326–33. doi: 10.1359/JBMR.080316. [DOI] [PMC free article] [PubMed] [Google Scholar]
- 38.Boutroy S, Van Rietbergen B, Sornay-Rendu E, Munoz F, Bouxsein ML, Delmas PD. Finite Element Analysis Based on In Vivo HR-pQCT Images of the distal radius is associated with wrist fracture in postmenopausal women. J Bone Miner Res. 2008;23:392–9. doi: 10.1359/jbmr.071108. [DOI] [PubMed] [Google Scholar]
- 39.Karsenty G. Convergence between bone and energy homeostases: Leptin regularion of bone mass. Cel Metab. 2006;4:341–348. doi: 10.1016/j.cmet.2006.10.008. [DOI] [PubMed] [Google Scholar]
- 40.Steppan CM, Crawford DT, Chidsey-Frink KL, Ke H, Swick AG. Leptin is a potent stimulator of bone growth in ob/ob mice. Reg Peptides. 2000;92:73–78. doi: 10.1016/s0167-0115(00)00152-x. [DOI] [PubMed] [Google Scholar]
- 41.Ducy P, Amling M, Takeda S, Priemel M, Schilling AF, Beil FT, Shen J, Vinson C, Rueger JM, Karsenty G. Leptin inhibits bone formation through a hypothalamic relay: A central control of bone mass. Cell. 2000;100:197–207. doi: 10.1016/s0092-8674(00)81558-5. [DOI] [PubMed] [Google Scholar]
- 42.Tamasi JA, Arey BJ, Bertolini DR, Feyen JHM. Characterization of Bone structure in leptin receptor-deficient zucker (fa/fa) rats. J Bone Miner Res. 2003;18:1605–11. doi: 10.1359/jbmr.2003.18.9.1605. [DOI] [PubMed] [Google Scholar]
- 43.Lorentzon M, Landin K, Mellstrom D, Ohlsson C. Leptin is a negative independent predictor of areal BMD and cortical bone size in young adult Swedish men. J Bone Miner Res. 2006;21:1871–7. doi: 10.1359/jbmr.060814. [DOI] [PubMed] [Google Scholar]
- 44.Wang X, Rundle CH, Wergedal JE, Srivastava AK, Mohan S, Lau KHW. Loss of sex-specific difference in femoral bone parameters in male leptin knockout mice. Calcif Tissue Int. 2007;80:374–82. doi: 10.1007/s00223-007-9026-0. [DOI] [PubMed] [Google Scholar]
- 45.Lin S Thomas TC, Storlien LH, Huang XF. Development of high fat diet-induced obesity and leptin resistance in C57Bl/6J mice. Int J Obesity. 2000;24:639–46. doi: 10.1038/sj.ijo.0801209. [DOI] [PubMed] [Google Scholar]
- 46.Amling M, Takeda S, Karsenty G. A neuro (endo)crine regulation of bone remodeling. BioEssays. 2000;22:970–5. doi: 10.1002/1521-1878(200011)22:11<970::AID-BIES3>3.0.CO;2-L. [DOI] [PubMed] [Google Scholar]
- 47.Baldock PA, Allison S, McDonald MM, Sainsbury A, Enriquez RF, Little DG, Eisman JA, Gardiner EM, Herzog H. Hypothalamic regulation of cortical bone mass: Opposing activity of the Y2 receptor and leptin pathways. J Bone Miner Res. 2006;21:1600–1607. doi: 10.1359/jbmr.060705. [DOI] [PubMed] [Google Scholar]
- 48.Baldock PA, Allison SJ, Lundberg P, Lee NJ, Slack K, Lin ED, Enriquez RF, McDonald MM, Zhang L, During MJ, Little DG, Eisman JA, Gardiner EM, Yulyaningsih E, Lin S, Sainsbury A, Herzog H. Novel role of Y1 receptors in the coordinated regulation of bone and energy homeostasis. J Biol Chem. 2007;282:19092–19102. doi: 10.1074/jbc.M700644200. [DOI] [PubMed] [Google Scholar]
- 49.Pollock NK, Liang EM, Baile CA, Hamrick MW, Hall DB, Lewis RD. Is adiposity advantageous for bone strength? A peripheral quantitative computed tomography study in late adolescent females. Am J Clin Nutr. 2007;86:1530–48. doi: 10.1093/ajcn/86.5.1530. [DOI] [PubMed] [Google Scholar]
- 50.de Margerie E, Robin J-P, Verrier D, Cubo J, Groscolas R, Castanet J. Assessing a relationship between bone microstructure and growth rate: a fluorescent labeling study in the king penguin chick (aptenodytes patagonicus). J Exp Biol. 2004;207:869–79. doi: 10.1242/jeb.00841. [DOI] [PubMed] [Google Scholar]
- 51.Currey JD. Bones. Princeton University Press; Princeton: 2002. pp. 17–20. [Google Scholar]