Abstract
Purpose:
To report the impact of transient, self-resolving, untreated “macular edema” detected on spectral domain optical coherence tomography in Asian Indian premature infants with retinopathy of prematurity (ROP) on visual acuity (VA) and refraction at 1-year of corrected age.
Materials and Methods:
Visual acuity and refraction of 11 infants with bilateral macular edema (Group A) was compared with gestational age-matched 16 infants with ROP without edema (Group B) and 17 preterms infants without ROP and without edema (Group C) at 3, 6, 9 and 12 months of corrected age using Teller Acuity Cards and cycloplegic retinoscopy. Sub-group analysis of the previously described pattern A and B macular edema was performed.
Results:
Visual acuity was lower in infants with macular edema compared with the other two control groups throughout the study period, but statistically significant only at 3 months. Visual improvement in these infants was highest between the 3rd and 6th month and plateaued by the end of the 1st year with acuity comparable to the other two groups. The edema cohort was more hyperopic compared to the other two groups between 3 and 12 months of age. Pattern A edema had worse VA compared to pattern B, although not statistically significant.
Conclusion:
Macular edema, although transient, caused reduced VA as early as 3 months of corrected age in Asian Indian premature infants weighing <2000 g at birth. The higher hyperopia in these infants is possibly due to visual disturbances caused at a critical time of fovealization. We hypothesize a recovery and feedback mechanism based on the principles of active emmetropization to explain our findings.
Keywords: Emmetropization, hand-held, macular edema, retinopathy of prematurity, spectral-domain optical coherence tomography, visual acuity
The recent availability of hand-held spectral domain optical coherence tomography (HH SD-OCT),[1,2,3] has provided us a new tool to image the retinae of infants and children in the office, obviating the requirement for general anesthesia[4] and providing rapid and repeatable images of regions of interest.[5,6] The SD-OCT has been used to study subclinical foveal morphology of premature infants, thereby providing new insights into their macular anatomy and pathology and opening an unexplored field of research that is aimed at better understanding of the process of foveal maturation at that critical age and time.[6,7]
We have previously reported a cohort of Asian Indian premature infants with retinopathy of prematurity (ROP) in whom SD-OCT performed during the acute ROP screening period had detected foveal disruptive changes which had spontaneously resolved.[8,9] At the time of that first report, the terminology,[10,11] morphology, sub-types and clinical significance were unknown and we had chosen to use the nomenclature, “abnormal foveal changes,” sub-classifying our findings into two distinct OCT patterns “A” and “B.”[8] These changes that resembled cystoid macular edema in adults have subsequently been described in other ethnic groups as well.[3,12,13,14,15] However, to the best of our knowledge, the long-term visual and refractive outcome of infants with these foveal changes has not yet been described.
In this paper, we report the visual and refractive outcomes of the originally described cohort of infants with macular edema at periodic intervals of 3, 6, 9 and 12 months of corrected age, by comparing them to two age-matched control groups-with ROP without macular edema and with no ROP.
Materials and Methods
This study was approved by the Institutional Review Board of our institute and followed the tenets of the Declaration of Helsinki. Informed consent was obtained from the parents or legal guardians of all the enrolled infants who presented to the ROP clinic of our institute.
Study infants
The test group comprises of the twelve infants with macular edema detected on SD-OCT from the original cohort (Group A).[8,9] These infants had previously completed ROP screening with photo-documentation (Retcam shuttle, Clarity MSI, USA) of their retinal status during each of their multiple screening sessions. The control groups comprised of 16 gestational age-matched preterm infants with comparable severity of ROP but no macular edema on SD-OCT imaged during the acute phase (Group B) and 17 age-matched controls of preterm infants without ROP and without macular edema (Group C) during any of their screening sessions.
To avoid the influence of confounders like comorbid conditions that may influence visual acuity (VA), our controls were chosen from infants who did not have known risk factors including intraventricular hemorrhage, kernicterus, hypoglycemia, seizures, developmental delay, poor Apgar scores, birth asphyxia or known metabolic disorders and syndromes. Our cases (Group A) did not have any neonatal risk factors as previously reported.[8]
The sub-group nomenclature of pattern A and B previously described has been used in this study as well.[8] Briefly, “pattern A” comprised of a dome-shaped elevation in the center of the fovea that resembled classical cystoid macular edema in adults. There were intraretinal cystoid spaces with highly reflective intervening vertical septae between the roof and floor of the dome with complete disruption of the foveal depression in all cases. “Pattern B” featured multiple confluent or near confluent vacuolated optically empty or hyporeflective spaces within the layers of the retina with no obvious or few septae and a fairly well preserved foveal depression.
Vision and refraction assessment
At our institute, we routinely assess the vision and refraction of all premature infants every 3 months, starting at the 3rd corrected month of age (approximately 52 corrected weeks of postmenstrual age [PMA]). Infants undergo vision assessment monocularly and binocularly, using the Teller Acuity Cards (TAC).[16,17] For vision analysis, monocular recordings were used. The procedure was performed at a distance of 38 cm for infants between birth and 6 months of age and 55 cm for infants between 7 months to 1-year of age. The child's acuity was then calculated from the frequency (specified in cycles/cm) and the test distance (in cm). The values for conversion of cycles/cm to cycles/degree were derived from the charts provided and converted to a decimal for statistical analysis.[16,17] Cycloplegic retinoscopy was performed on the study infants at each of the study intervals after vision was tested. The mean spherical equivalent (MSE) at each visit was used for statistical analysis.
Additionally, at every visit, all infants had a comprehensive examination of the anterior and dilated posterior segment. The mean VA and the MSEs were compared between the groups at each study interval.
Statistical analysis
Analysis was performed using SPSS (IBM, USA) version 22.0 and MedCalc (MedCalc Software, Belgium) version 11.0. Online convertor http://www.myvisiontest.com/logmar.php was used to convert TAC readings to logMAR. The data set was tested for normality using the Shapiro–Wilk test and the following statistical tests were used on the sub-sets depending on the normality: Kruskal–Wallis, Mann–Whitney U-test, ANOVA and repeated measures analysis with the appropriate post-hoc tests when required. P <0.05 was considered to be significant.
Results
Demographic details of the groups
Of the original 12 infants with macular edema (Group A), one baby historically had macular edema in one eye only and was excluded for analysis. The other 11 infants had completed 1-year of follow-up and are the subject of further analysis. Historically, these infants had type 2 ROP, which resolved spontaneously. Five of them (45.45%) had pattern A and six infants (54.55%) had pattern B foveal changes respectively. The mean birth weight and period of gestation between the pattern A and B sub-groups were comparable (P = 0.65 and P = 0.31 respectively).
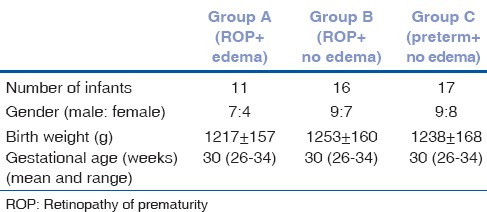
Gestational age-matched premature infants with similar type 2 ROP without macular edema (Group B, n = 16 infants) and gestational age-matched premature infants without historical ROP of any stage and without macular edema (Group C, n = 17 infants) were chosen and prospectively followed up at the similar study time periods of 3, 6, 9 and 12 months respectively. The birth weight, gestational age and gender distribution between the three groups is summarized in Table 1.
Table 1.
Demographic distribution of infants enrolled in the study matched for gestational age with the cohort of infants with ROP with macular edema
Visual acuity and its distribution across the groups
Visual acuity was converted from the TAC readings to logMAR for statistical analysis. The mean VA improved in all three groups across the study time intervals (P < 0.001). The mean VA of Group A was 1.59 at 3 months which improved to 1.08 at 12 months (P < 0.001), for Group B it improved from 1.52 to 1.01 (P < 0.001) and for Group C it improved from 1.44 to 0.98 (P < 0.001). The details of the logMAR VA of the study population across the study time intervals are summarized in Table 2.
Table 2.
Visual acuity (logMAR) of the three groups across the study time periods

The mean VA was compared between the groups to determine if macular edema had any influence on vision. Although the mean vision was worst in the edema group, better in the group with ROP without edema and best in the preterms without ROP or edema across all the study periods, Kruskal–Wallis performed showed that this difference was statistically significant only at 3 months (P = 0.015) and not at 6 (P = 0.12), 9 (P = 0.49) or 12 months (P = 0.13) respectively. Further, Mann–Whitney U-test was performed for the data set at 3 months, which showed there was a significant difference between Group A and C (P = 0.012) and Group B and C (P = 0.028) and not between Group A and B (P = 0.407). The distribution of VA between the groups is graphically represented in Fig. 1.
Figure 1.
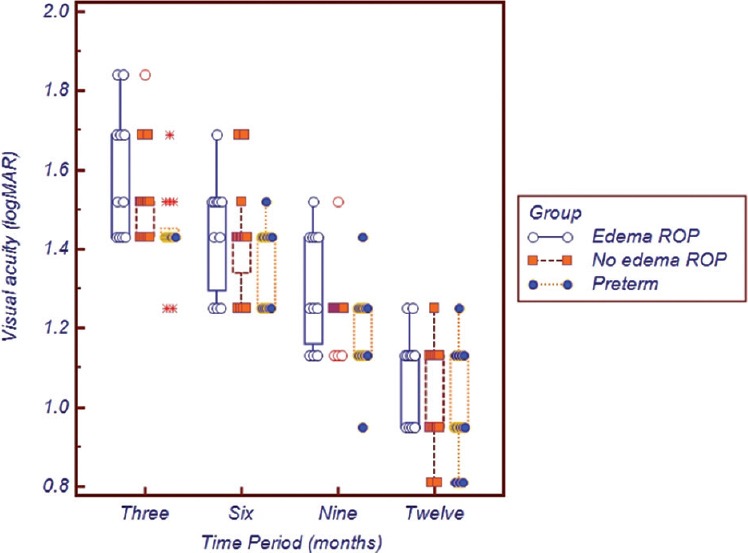
Graphical representation of the visual acuity (logMar) between the three groups across the study time periods
The mean difference in VA (i.e., improvement) between successive time periods was computed. The difference was highest (i.e., the vision improved the most) between the 3rd and the 6th month in Group A (0.146 logMAR difference) compared to 0.104 in Group B and 0.079 in Group C respectively. In the final 3 months of the study period, that is, from 9 to 12 months, visual improvement was almost similar in all three groups (Group A: 0.221, Group B: 0.226 and Group C: 0.201) respectively. The improvement in vision across the study intervals between the groups is depicted in Fig. 2.
Figure 2.
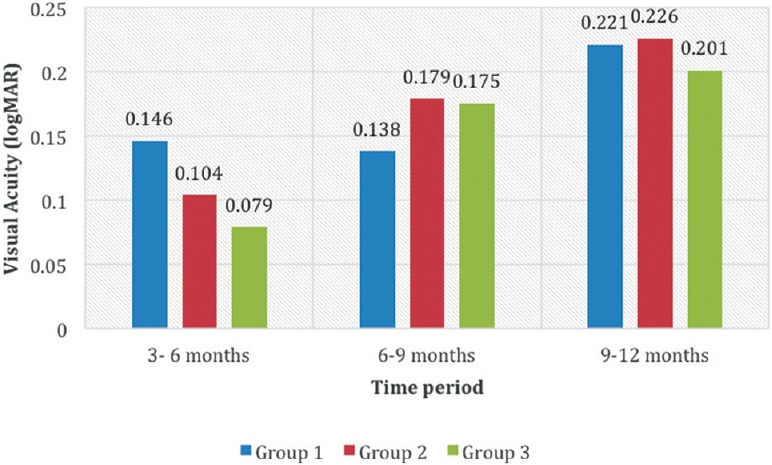
Difference in logMAR vision (improvement in vision) between the study intervals in the three groups
Mean spherical equivalent and its distribution across the groups
The MSE was computed for each reading of cycloplegic refraction that was recorded for statistical analysis. All infants showed a hyperopic refraction throughout the study period. The quantum of hyperopia reduced from the 3rd to the 12th month in all three groups. (P < 0.001) and is detailed in Table 3. The highest hyperopia measured was at 3 months of corrected age. Group A infants were the most hyperopic at 4.68, which was more than 3.79 in Group B and 3.40 diopters in Group C, respectively.
Table 3.
MSE of the three groups across the study time periods

To compare the difference of MSE between the groups, ANOVA was employed. The difference was significant between groups for the study periods of 3 months (P = 0.037), 6 months (P = 0.024), 9 months (P = 0.002) and 12 months (P = 0.035), respectively. Throughout the period, hyperopia was highest in the edema group and least in the non-ROP preterm group C. Post-hoc test with Bonferroni correction was done, which showed that at 3 months there was a significant difference between Group A and C (P = 0.033); at 6 months it was between Group A and B (P = 0.042) as well as between Group A and C (P = 0.043). At 9 months there was significant difference between Group A and B (P = 0.002) as well as B and C (P = 0.032) and at 12 months of corrected age, all groups became comparable (P = 0.052). The distribution of MSE between the groups is graphically represented in Fig. 3.
Figure 3.
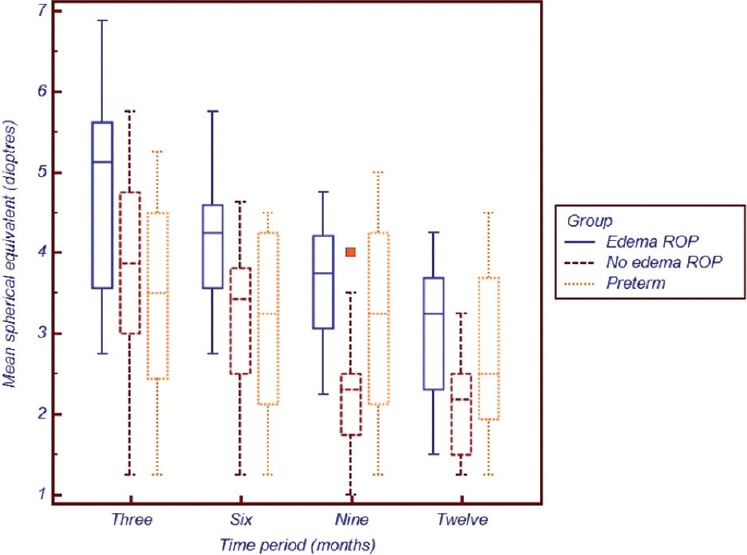
Graphical representation of the mean spherical equivalent between the three groups across the study time periods
Sub-group analysis between pattern A and B macular edema with vision and refraction
Although the sample size was small we compared the mean VA and refraction between the pattern A and pattern B babies. Despite the VA being worse in pattern A eyes compared to pattern B [Fig. 4], this was not statistically significant at 3 (P = 0.184), 6 (P = 0.175), 9 (P = 0.341) or 12 months (P = 0.922) respectively. The worst vision was recorded in pattern A eyes at 3 months of age compared to pattern B at the same time period and this difference gradually reduced between 6 and 12 months of corrected age. At 12 months, both VA were within comparable ranges [Fig. 4]. Similarly, MSE between these two sub-groups was not statistically significant, although pattern A eyes remained more hyperopic than their counterparts with pattern B edema throughout the study period [Table 4].
Figure 4.
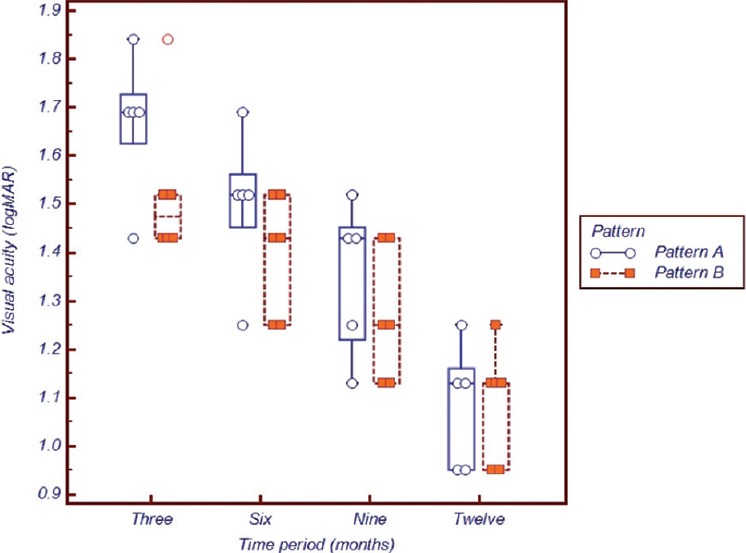
Visual Acuity in logMAR between eyes with pattern A and pattern B macular edema
Table 4.
MSE of pattern A versus pattern B across the study time periods

Discussion
Macular edema detected on SD-OCT in infants with clinically “normal looking” foveae during the acute phase of ROP was described first in 29.1% of Asian Indian infants with spontaneously resolved stage 2 ROP.[8,9] The mean PMA of OCT imaging in the cohort was 37.18 weeks and although the exact age at which this macular edema returned to normal was not determined, all infants were noted to have a “normal” contoured foveal OCT at the 52nd week, or 3rd corrected month of PMA.[8,9] Subsequently, this macular edema has been reported in other ethnic groups as well,[3,12,13,14,15] and shown to spontaneously resolve without any active management.
The original cohort of infants with these foveal disruptive changes had shown significant differences in their foveal contours and thicknesses compared to the normal cohorts. The mean central foveal thickness in the eyes with stage 2 ROP with the macular edema was 315.5 ± 109.3 microns compared to 158.9 ± 37.6 microns in eyes with stage 2 ROP without macular edema (P < 0.001).[8] With large morphological differences from the “normal” it would be intuitive to speculate that these may have an influence on VA and/or refractive error in the immediate short-term or perhaps in the long-term as well.
Hence, we undertook the current study to compare the vision and refraction of the originally described cohort with gestational age-matched positive (with ROP, no edema) and negative (no ROP, no edema) controls to investigate any possible influence that the macular edema may have played in this fovealization.
Our results suggest that VA is worse in the eyes with macular edema compared to the two control groups throughout the study period of 1-year. The difference however, was statistically significant at 3 months alone and not thereafter. This coincides with the fact that the foveal contour returned to normal by the 52nd week (i.e., 3rd corrected month) in our edema cohort. This allows us to speculate that the foveal disruption may have contributed to the lower VA and its subsequent resolution by the 3rd month allowed visual improvement in the ensuing 3 months. It is important to note that post-hoc tests showed that there was significant difference between: (1) The ROP group with edema and preterms without ROP as well as (2) the group with ROP without edema and preterms without ROP. This highlights the fact that the presence of ROP (even without edema) may negatively influence VA early on. Clinically, especially in the Indian setting, ROP develops in babies with several co-morbidities,[18,19] which may influence development in general and visual maturation in particular.
Extending the hypothesis that the morphological disruption in the foveal center contributed to lower vision, we performed a sub-group analysis between pattern A and B eyes. Pattern A eyes had a more disruptive morphology, increased central thickness, obliteration of the foveal dip and larger intraretinal cystic spaces compared to pattern B eyes. Although not powered to compare the difference owing to the small sample size, an important trend is evident. Fig. 4 depicts that pattern A eyes had worse vision compared to pattern B at all time periods. This gives an anatomical basis to our hypothesis, since poorer anatomy may give rise to poorer vision.
Having had the visual system challenged at 3 months of age, there appears to exist an interesting “recovery” mechanism thereafter. This improvement in vision may be a compensatory mechanism secondary to the disrupted visual feedback evidenced by the “recovery” of vision in the edema cohort more than the other two groups. The improvement in VA between 3 and 6 months in the edema group was significantly greater than the improvement in any other group at any other time period. Fig. 2 denotes the trend of improvement, which indicates that there is a plateauing of improvement between the 6th and 9th month and further during the 9th and 12th month the quantum of improvement is more comparable. There appears a central range of VA that all three groups approach at the end of the 12 months of corrected age. This may suggest that the short-term loss of vision in infants with edema may be compensated by the time they turn 1-year of age.
However, 12 months may not be the appropriate “finishing line” in the maturing visual development of these infants. Rothman et al.[14] showed that even after 18–24 months poor language and motor skills and lower cognitive scores were observed in infants with macular edema. Further longitiudinal studies with a larger sample size would be required to clarify the long-term impact on vision in these infants.
The other important outcome of the study is the significantly higher hyperopic refraction that is evidenced in the edema cohort compared to the other two groups. We present a hypothesis based on emmetropization to explain these findings. The refractive status of the infant eye relies on visual experiences. Trolio has summarized the literature on the theories of emmetropization that indicate that some aspects of visual experiences mediate a feedback control system that uses the refractive state itself to control growth and the eventual refractive status.[20] Whereas the theory of “passive” emmetropization deals with the heritable and environmental influence on the growth of the axial length and ametropia, the theory of “active” emmetropization is more relevant to our study. Active emmetropisation suggests that there is an interference with emmetropization if there is disturbance in the form vision. Non-human mammalian studies have shown that raising macaques with experimental defocussed vision results in hyperopia which may persist even after removal of the trigger.[21]
Disruption of normal visual experience has been shown to alter the process of emmetropization.[22] There is evidence to suggest that the normal end-point of refractive development may actually be mild hyperopia rather than emmetropia.[23] Population studies have shown that the refractive error distribution in infants is normally distributed with a mean of about +2.0 D with a standard deviation of 2.75 D.[22,23]
We hypothesize that the interference in vision caused by the macular edema may have influenced the refractive state to be “more hyperopic,” albeit in the non-amblyopic range. Furthermore, the abnormal visual experiences may alter the speed at which emmetropization could have occurred with a result that these infants remained “more hyperopic” compared to the two groups that did not suffer such visual disturbances.
The chief limitation of the study is the small sample size. This especially limits the interpretation when comparing pattern A versus B eyes. It is intuitive to speculate that infants with pattern A with a mean central foveal thickness of 406.8 microns (compared to 224.1 microns in pattern B),[8] may have experienced a worse “visual disturbance” but the difference was not statistically significant owing to the small sub-group. Another limitation is the fact that we did not have a cohort of normal, term infants to compare with. Our negative controls were preterms without ROP or edema and these cannot be regarded as “normal” since prematurity itself portends to several comorbidities, some of which may influence VA and maturation. Thirdly, absence of axial length, corneal curvature biometrics and anterior chamber depth in our study limit our ability to understand the true refractive status of these eyes. Finally, our findings may not be generalizable to other population groups. The incidence of CME and the visual growth are likely to differ from Western studies where edema has been reported in infants with birth weights of 800 g and 26 weeks.[15] In India, we encounter larger, more mature infants who suffer from ROP,[24,25,26] who remain sicker despite the larger weights, and suffer from malnutrition and failure to thrive even after the early neonatal period. This may influence vision thereby making comparisons difficult.
Conclusion
Transient macular edema reported in 29.1% of stage 2 ROP in Asian Indian infants which peaked at 37 weeks of PMA and resolved by 52nd week, appears to have caused visual disturbance severe enough to lead to poorer VA at 3 months of corrected age than infants who did not have the edema or ROP. This reduced acuity probably influences the feedback mechanism of visual maturation causing accelerated improvement in the next 3 months to plateau by the end of the 1st year, with acuity almost comparable to other infants at that time. Infants with edema are more hyperopic than infants without edema and this differential refractive status persists until the end of the 1st year. Possible impact of this transient edema on the emmetropization process, fovealization and vision maturation has been hypothesized. Further multi-ethnic, multi-center research will be required to clarify the current lacuna in our understanding of this entity.
Footnotes
Source of Support: Nil.
Conflict of Interest: None declared.
References
- 1.Scott AW, Farsiu S, Enyedi LB, Wallace DK, Toth CA. Imaging the infant retina with a hand-held spectral-domain optical coherence tomography device. Am J Ophthalmol. 2009;147:364–73.e2. doi: 10.1016/j.ajo.2008.08.010. [DOI] [PubMed] [Google Scholar]
- 2.Maldonado RS, Izatt JA, Sarin N, Wallace DK, Freedman S, Cotten CM, et al. Optimizing hand-held spectral domain optical coherence tomography imaging for neonates, infants, and children. Invest Ophthalmol Vis Sci. 2010;51:2678–85. doi: 10.1167/iovs.09-4403. [DOI] [PMC free article] [PubMed] [Google Scholar]
- 3.Maldonado RS, O’Connell RV, Sarin N, Freedman SF, Wallace DK, Cotten CM, et al. Dynamics of human foveal development after premature birth. Ophthalmology. 2011;118:2315–25. doi: 10.1016/j.ophtha.2011.05.028. [DOI] [PMC free article] [PubMed] [Google Scholar]
- 4.Patel CK. Optical coherence tomography in the management of acute retinopathy of prematurity. Am J Ophthalmol. 2006;141:582–4. doi: 10.1016/j.ajo.2005.10.002. [DOI] [PubMed] [Google Scholar]
- 5.Vajzovic L, Hendrickson AE, O’Connell RV, Clark LA, Tran-Viet D, Possin D, et al. Maturation of the human fovea: Correlation of spectral-domain optical coherence tomography findings with histology. Am J Ophthalmol. 2012;154:779–89.e2. doi: 10.1016/j.ajo.2012.05.004. [DOI] [PMC free article] [PubMed] [Google Scholar]
- 6.Isenberg SJ. Foveal development in the premature infant: The motion picture. Ophthalmology. 2011;118:2313–4. doi: 10.1016/j.ophtha.2011.06.007. [DOI] [PubMed] [Google Scholar]
- 7.Vinekar A, Sivakumar M, Shetty R, Mahendradas P, Krishnan N, Mallipatna A, et al. A novel technique using spectral-domain optical coherence tomography (Spectralis, SD-OCT+HRA) to image supine non-anaesthetized infants: Utility demonstrated in aggressive posterior retinopathy of prematurity. Eye (Lond) 2010;24:379–82. doi: 10.1038/eye.2009.313. [DOI] [PubMed] [Google Scholar]
- 8.Vinekar A, Avadhani K, Sivakumar M, Mahendradas P, Kurian M, Braganza S, et al. Understanding clinically undetected macular changes in early retinopathy of prematurity on spectral domain optical coherence tomography. Invest Ophthalmol Vis Sci. 2011;52:5183–8. doi: 10.1167/iovs.10-7155. [DOI] [PubMed] [Google Scholar]
- 9.Vinekar A, Avadhani K, Sivakumar M, Mahendradas P, Kurian M, Braganza S, et al. Macular edema in premature infants. Ophthalmology. 2012;119:1288–9.e1. doi: 10.1016/j.ophtha.2012.03.029. [DOI] [PubMed] [Google Scholar]
- 10.Vinekar A, Maldonado R, Toth C. Spectral Domain Optical Coherence Imaging of the Eye. New Delhi: Elsevier; 2013. Foveal layers in an infant; pp. 354–6. [Google Scholar]
- 11.Vinekar A, Maldonado R, Toth C. New Delhi: Elsevier; 2013. Spectral Domain Optical Coherence Imaging of the Eye; pp. 357–60. [Google Scholar]
- 12.Maldonado RS, O’Connell R, Ascher SB, Sarin N, Freedman SF, Wallace DK, et al. Spectral-domain optical coherence tomographic assessment of severity of cystoid macular edema in retinopathy of prematurity. Arch Ophthalmol. 2012;130:569–78. doi: 10.1001/archopthalmol.2011.1846. [DOI] [PMC free article] [PubMed] [Google Scholar]
- 13.Dubis AM, Subramaniam CD, Godara P, Carroll J, Costakos DM. Subclinical macular findings in infants screened for retinopathy of prematurity with spectral-domain optical coherence tomography. Ophthalmology. 2013;120:1665–71. doi: 10.1016/j.ophtha.2013.01.028. [DOI] [PMC free article] [PubMed] [Google Scholar]
- 14.Rothman AL, Tran-Viet D, Gustafson KE, Goldstein RF, Maguire MG, Tai V, et al. Poorer neurodevelopmental outcomes associated with cystoid macular edema identified in preterm infants in the intensive care nursery. Ophthalmology. 2015;122:610–9. doi: 10.1016/j.ophtha.2014.09.022. [DOI] [PMC free article] [PubMed] [Google Scholar]
- 15.Lee AC, Maldonado RS, Sarin N, O’Connell RV, Wallace DK, Freedman SF, et al. Macular features from spectral-domain optical coherence tomography as an adjunct to indirect ophthalmoscopy in retinopathy of prematurity. Retina. 2011;31:1470–82. doi: 10.1097/IAE.0b013e31821dfa6d. [DOI] [PMC free article] [PubMed] [Google Scholar]
- 16.Teller Acuity Card. [Last accessed on 2015 Jan 04]. Available from: http://www.eiiwebassets.s3.amazonaws.com/s/sterooptical/pdf/other-manuals/TAC_II_manual.pdf .
- 17.Mayer DL, Beiser AS, Warner AF, Pratt EM, Raye KN, Lang JM. Monocular acuity norms for the Teller acuity cards between ages one month and four years. Invest Ophthalmol Vis Sci. 1995;36:671–85. [PubMed] [Google Scholar]
- 18.Hungi B, Vinekar A, Datti N, Kariyappa P, Braganza S, Chinnaiah S, et al. Retinopathy of Prematurity in a rural Neonatal Intensive Care Unit in South India – A prospective study. Indian J Pediatr. 2012;79:911–5. doi: 10.1007/s12098-012-0707-y. [DOI] [PubMed] [Google Scholar]
- 19.Vinekar A, Hegde K, Gilbert C, Braganza S, Pradeep M, Shetty R, et al. Do platelets have a role in the pathogenesis of aggressive posterior retinopathy of prematurity? Retina. 2010;30:S20–3. doi: 10.1097/IAE.0b013e3181cafc30. [DOI] [PubMed] [Google Scholar]
- 20.Troilo D. Neonatal eye growth and emmetropisation – A literature review. Eye (Lond) 1992;6 (Pt 2):154–60. doi: 10.1038/eye.1992.31. [DOI] [PubMed] [Google Scholar]
- 21.Crewther SG, Nathan J, Kiely PM, Brennan NA, Crewther DP. The effect of defocus sing contact lenses on refraction in cynomolgus monkeys. Clin Vision Sci. 1988;3:221–8. [Google Scholar]
- 22.Saunders KJ, Woodhouse JM, Westall CA. Emmetropisation in human infancy: Rate of change is related to initial refractive error. Vision Res. 1995;35:1325–8. doi: 10.1016/0042-6989(94)00222-8. [DOI] [PubMed] [Google Scholar]
- 23.Morgan IG, Rose KA, Ellwein LB. Refractive Error Study in Children Survey Group. Is emmetropia the natural endpoint for human refractive development? An analysis of population-based data from the refractive error study in children (RESC) Acta Ophthalmol. 2010;88:877–84. doi: 10.1111/j.1755-3768.2009.01800.x. [DOI] [PMC free article] [PubMed] [Google Scholar]
- 24.Vinekar A, Dogra MR, Sangtam T, Narang A, Gupta A. Retinopathy of prematurity in Asian Indian babies weighing greater than 1250 grams at birth: Ten year data from a tertiary care center in a developing country. Indian J Ophthalmol. 2007;55:331–6. doi: 10.4103/0301-4738.33817. [DOI] [PMC free article] [PubMed] [Google Scholar]
- 25.Vinekar A, Gilbert C, Dogra M, Kurian M, Shainesh G, Shetty B, et al. The KIDROP model of combining strategies for providing retinopathy of prematurity screening in underserved areas in India using wide-field imaging, tele-medicine, non-physician graders and smart phone reporting. Indian J Ophthalmol. 2014;62:41–9. doi: 10.4103/0301-4738.126178. [DOI] [PMC free article] [PubMed] [Google Scholar]
- 26.Vinekar A, Jayadev C, Bauer N. Need for telemedicine in retinopathy of prematurity in middle-income countries: E-ROP vs KIDROP. JAMA Ophthalmol. 2015;133:360–1. doi: 10.1001/jamaophthalmol.2014.4913. [DOI] [PubMed] [Google Scholar]


