

Abstract
Ketoreductases (KRs) from modular polyketide synthases (PKSs) can perform stereospecific catalysis, selecting a polyketide with a D-α or an L-α-methyl substituent for NADPH-mediated reduction. In this report Molecular Dynamics (MD) simulations were performed to investigate the interactions that control stereospecificity. We studied the A1-type KR from the second module of the amphotericin PKS (A1), which is known to be stereospecific for a D-α-methyl-substituted diketide substrate (dkD). MD simulations of two ternary complexes comprised of the enzyme, NADPH, and either the correct substrate, dkD, or its enantiomer (dkL) were performed. The coordinates for the A1/NADPH binary complex were obtained from a crystal structure [Zheng, J. T. et al. (2010) Structure 18, 913–922], and substrates were modeled in the binding pocket in conformations appropriate for reduction. Simulations were intended to reproduce the initial weak binding of the polyketide substrate to the enzyme. Long (tens of nanoseconds) MD simulations show that the correct substrate is retained in a conformation closer to the reactive configuration. Many short (up to a nanosecond) MD runs starting from the initial structures display evidence that Q364, three residues N-terminal to the catalytic tyrosine, forms a hydrogen bond to the incorrect dkL substrate to yield an unreactive conformation that is more favorable than the reactive configuration. This interaction is not as strong for dkD, as the D-α-methyl substituent is positioned between the glutamine and the reactive site. This result correlates with experimental findings [Zheng, J. T. et al. (2010) Structure 18, 913–922] in which a Q364H mutant was observed to lose stereospecificity.
Understanding how enzymes catalyze reactions is a fundamental problem in biochemistry. A typical reaction is described by the following series of steps (see Scheme 1 in(1):
The enzyme weakly binds the substrate in the open conformation;
The enzyme undergoes a conformational transition from the open to the closed state (induced fit), tightening the binding, and locking the ligand in a specific conformation;
The chemical reaction is carried out;
The product is released to solution.
The cellular milieu contains a large number of potential substrates for the enzyme. It is therefore important that the enzyme is specific to the correct substrate.(1)
The enzymes may show their specificity in the binding step, by selecting the ligand that properly fits the binding pocket, or in the chemistry step, by the alignment of the reactive amino acids. But there are also examples in which the conformational transition selects the proper ligand.(1) Overall, it is reasonable to believe that any of the steps discussed before can contribute to the specificity.(1)
The microscopic reasons for specificity may go beyond the static fitting of the ligand in the binding pocket. Therefore, Molecular Dynamics (MD) holds the promise of a more comprehensive understanding of the atomically-detailed mechanism of specificity. The main limitation of MD in this case is its classical nature. It is difficult with classical simulations to describe the chemical step, since specific functional form for the Born-Oppenheimer energy surface that allows for bond breaking and forming must be developed. In typical simulations of biological molecules the potential used in MD simulations retains specific bonded topology. Within the limitations of these approximations, MD can shed light on the microscopic reasons for specificity. To do so, a possible approach is to run simulations of the enzyme with the correct and incorrect substrate and to look at the differences in the structure of the binding site, as well as at the free energy of the two complexes. Using an approach of this type, it was argued that the specificity of lactate dehydrogenase for the pro-R compared to the pro-S hydride of the nicotinamide ring of NADH was due to favorable electrostatic interactions of the carboxamide group of the NADH ring when the pro-R hydrogen faces the pyruvate.(2) For a DNA polymerase, a successful comparison of kinetic data from MD simulations and experiments for the complex with the correct and an incorrect (mismatched) nucleotide led to microscopic insights on role of induced fit in selecting the correct substrate.(3) Indeed, experimental findings(1) and results from MD simulations(3) have shown that DNA polymerase favorably changes its structure from the open to the closed conformation only if the matching nucleic acid is bound. Mutation of one amino acid into another one has proven a fundamental tool to understand the role of a residue in establishing the catalytic power of an enzyme.(4) Similarly, the contribution of specific interaction between a substrate and the enzyme can be estimated by computationally modifying a chemical moiety of the substrate into a different one.(5) The calculation of the free energy difference upon binding between two ligands, or between two protein sequences can be done with alchemical methods.(6) This means that to compute these free energy differences a ligand or an amino acid are progressively mutated into their counterpart during a simulation. Even though the intermediate states are non-physical, these numerical methods yield the correct free energy differences. Calculations of these types were conducted to study the stereospecificity of a mutant of cytochrome P450.(7)
Here we study a ketoreductase (KR) domain excised from a modular polyketide synthase (PKS) assembly line. PKSs are large multi-enzyme complexes that generate polyketide secondary metabolites, many of which are biologically active as antibiotics.(8) They are composed of multiple enzymes, some of which extend the growing polyketide and others that process the intermediate through subtle chemical modifications.(8) During its biosynthesis, a polyketide is bound through a thioester linkage to an ~18 Å-long prosthetic group of an acyl carrier protein (ACP) domain. ACPs shuttle intermediates between the enzymatic domains of the PKS. The structure of a module, the repeating unit of a PKS, was recently solved at different stages of extension/processing by cryo-EM,(9) highlighting the large movements made by ACP during the catalytic cycle of a module. KR is a processing domain of that binds to an intermediate and reduces its β-keto group with NADPH. Different KRs yield hydroxyl groups with different orientations: the A type generates L-β-hydroxyl groups, while the B-type generates D-β-hydroxyl groups. The work presented here is on an A1-type KR, a subclass of A-type KRs. A-type KRs are divided into A1-type enzymes, which stereoselectively reduce polyketide intermediates with D-α-substituent, and A2-type enzymes, which reduce polyketide intermediates with a L-α-substituent (see Figure 1A for the two enantiomers used in the simulations). The question being addressed is: what are the microscopic reasons for the stereospecificity of an A1-type KR? Experimental studies on mutants of the A1-type KR from the second module of the amphotericin PKS (A1) provide interesting insights. Stereospecificity was shown to be lost when the glutamine three residues N-terminal to the reactive tyrosine (Q364) was mutated to histidine.(10) A second mutation from glycine (G355) to threonine 12 residues N terminal to the reactive tyrosine completely switches its stereospecificity such that it behaves as an A2-type KR.(11) This mutation shifts the position of a tryptophan considered responsible for properly aligning the ligand in the binding pocket.(11)
Figure 1.


(A) The two substrates used in the simulations: dkD and dkL. (B) Mechanism of the enzyme.(8) The ligands are shown together with two amino acids involved in the reactions. The Y367 donates a hydrogen to the ligand. The W359 is considered important for the correct alignment of the ligand in the binding pocket.(11)
The coordinates of A1 and NADPH were obtained from a crystal structure (PDB 3MJS, molecule B). The substrate 2-methyl-3-oxopentanoate-S-N-acetylcysteamine (dk) was modeled into the binding site of the A1/NADPH binary complex to form the ternary complex in proximity of a reactive configuration (see following). Others have modeled a ternary complex with phosphopantetheinylated ACP.(12) In these studies the pantetheinyl moiety was docked at the reactive site, and the stability of the entire complex was illustrated by MD simulations. We concentrated exclusively on the binding of a dk substrate and its enantiomer, without the phosphopantetheinyl moiety. N-acetylcysteamine-bound diketides, as those used in our simulations, are widely-utilized, in vitro substrates of isolated PKS KRs. Kinetic parameters and stereochemical outcomes have been extensively measured for these substrates.(13, 14) The dk ligands possess a chiral center at their α-carbons, thus one enantiomer has a D-α-methyl group (dkD) while the other has an L-α-methyl group (see Figure 1A). A1 is stereospecific for dkD.
To perform MD simulations of ternary complexes several challenges needed to be addressed. Firstly, the force field for the dk and NADPH ligands was not available, so they were generated by combining force fields of similar chemical species and filling the gaps with quantum mechanical simulations (see Supplementary Information). The force field was not tested against experimental measurements. Therefore, we studied in detail some expected features of the enzyme-ligand interaction, such as the fact that the correct ligand in a reactive configuration should be in the correct geometry to allow the chemistry step of the reaction (see Table 3 and Figure 5). Verifying these expected observations allows reporting of more surprising and detailed results with more confidence in the force field and the computational protocol. Secondly, A1 is large (475 amino acids), which makes it computationally challenging to relax the slow modes of the enzyme. Third, as we discussed before, only the binary and not the ternary structures were available. Finally, the ligand is extremely flexible, and the binding cleft from the crystal structure is not tight enough to allow for a single binding configuration. For these reasons it was not possible to conduct simulations to predict thermodynamic and kinetic properties. Nevertheless, from the set of simulations that were performed the correct ligand (dkD) is clearly retained closer to the reactive configuration compared to the incorrect ligand (dkL). Also, it was observed that the Q364 plays an important role in helping control stereospecificity. The simulations showed that Q364 can inhibit formation of the reactive alignment by forming a hydrogen bond with the ligand. This interaction occurs more often in the incorrect complex. Results agree with the experimental observation that the Q364 mutation dramatically reduces stereospecificity.(10)
Table 3.
Value of Sα for the different torsions in the diketide. The torsions are reported in the first column. The second and third column show the value of Sα for the torsions of dkD in the A1-dkD complex in all the configurations (second) and in the reactive configurations (third). The fourth and fifth columns show the value of Sα for the torsions of dkL in the A1-dkL complex. The fourth column shows the result for all the configurations, the fifth for the reactive configurations. The sixth column has the value of Sα for the torsions for the dkD ligand in water, the seventh for the dkL ligand in water.
| A1-dkD | A1-dkL | dkD | dkL | |||
|---|---|---|---|---|---|---|
| all | reactive | all | reactive | |||
| 10 C1-C2-C3-C4 | 1.94 | 1.51 | 2.16 | 2.18 | 2.11 | 2.11 |
| 13 C2-C3-C4-C5 | 1.82 | 1.26 | 2.10 | 2.10 | 1.86 | 1.87 |
| 14 C2-C3-C4-C6 | 1.81 | 1.26 | 2.10 | 2.08 | 1.88 | 1.88 |
| 19 C3-C4-C6-S | 1.84 | 0.97 | 1.54 | 1.36 | 2.12 | 2.13 |
| 23 C5-C4-C6-S | 1.85 | 0.99 | 1.55 | 1.34 | 2.11 | 2.12 |
| 28 C4-C6-S-C7 | 0.71 | 0.71 | 0.72 | 0.72 | 0.71 | 0.71 |
| 30 C6-S-C7-C8 | 1.59 | 0.60 | 1.63 | 1.59 | 1.89 | 1.91 |
| 33 S-C7-C8-N | 1.05 | 0.84 | 1.23 | 1.19 | 1.45 | 1.48 |
| 42 C7-C8-N-C9 | 1.23 | 0.58 | 1.27 | 1.31 | 0.92 | 1.02 |
| 45 C8-N-C9-C10 | 0.70 | 0.67 | 0.68 | 0.68 | 0.70 | 0.70 |
| TOTAL | 14.54 | 9.39 | 14.98 | 14.55 | 15.75 | 15.93 |
Figure 5.

Superposition of ten structures of the dk randomly selected among the following sets of structures: (A) dkD in reactive state, (B) dkD in any enzyme-ligand configuration, (C) dkL in reactive state, (D) dkL in any enzyme-ligand configuration.
METHODS
Modeling the substrates into the binding site
The crystal structure for A1 (PDB 3MJS)(10) was used as the starting structure in the preparation of the simulations. The enzyme is stereospecifc for dkD, while it does not turn over its enantiomer, dkL. The dkD ligand was modeled into the binding pocket. In the first step of the modeling it was docked into the protein binding site. In Figure 1B we sketch the positions of the critical protein groups that participate in the reaction (Y367), or that are considered important for the alignment of the substrate in the reactive configurations (W359). We also show the spatial position of the NADPH.
The amino acid Y367 is directly involved in the chemical reaction. It donates the hydrogen of the hydroxyl group of the tyrosine side-chain to the β-carbonyl oxygen of dk. The NADPH is part of the reaction as well. It is oxidized, and donates a hydride of the nicotinamide ring to the β-carbon of the dkD. The hydride that is donated to the ligand is derived from the pro-S hydrogen. Another interaction believed to be important for the correct alignment of the ligand in the binding pocket is the hydrogen bond of the dkD amide carbonyl group and the side-chain NH of W359. This interaction, proposed by biochemical insight,(11) helped in the initial modeling of the correct dkD ligand into the binding pocket. The incorrect enantiomer, dkL, was obtained by inverting the methyl group of the α substituent with the hydrogen at the α-carbon. The structures obtained so far were the starting point for all the simulations that followed. Below we use the name E0 (experimental 0) to denote these initial structures.
Setup and list of simulations
We ran 4 different sets of simulations:
One 20-ns simulation for each of the complexes A1-dkD and A1-dkL, which we refer to as L1.
A set of 20 shorter simulations of the complexes A1-dkD and A1-dkL, each of 1 ns, which we refer to as S1;
A longer simulation of both complexes of 50 ns each, which we will refer to as L2;
A set of 20 short simulations of both complexes, each of 800 ps, which we will refer to as S2.
Besides the lengths, the differences between L1, S1, and L2, S2 are in the choice of the initial conditions for the simulations.
We started the L1 and S1 simulation from the E0 structures. These structures include experimentally determined positions of the protein atoms and of the modeled coordinates of the substrate. We optimize the coordinates of the substrate as follows. We restrained the positions of all the atoms resolved by X-ray crystallography (i.e. protein and NADPH) by attaching a stiff spring to their starting position. We added the penalty function where is the current 3D position vector of the atom and is the three-dimensional coordinate vector of the “tethering” atom in the E0 structure. The force constant was chosen to be highly stiff (100 kcal/mol/Å2). The dk ligand was left unrestrained, so that the algorithm could modify its position in space and its internal structure following the minimization of the energy of the interactions with the X-ray resolved atoms and within the substrate. Hence, we adjust the modeled structure but the experimentally determined coordinates are remained roughly unchanged. We call these new structures M1 (minimized 1).
Simulations L2 and S2 also started from the structures E0 as well, but we ran a different energy minimization procedure. As before we restrained the atoms resolved by the crystal structures. At variance with the construction of M1, we added two more distance restraints on the dk ligand to better mimic the reactive configuration (Figure 1B). One constrained distance is between the β-carbonyl oxygen and the reactive hydrogen of Y367, the other distance is between the β-carbonyl carbon and the pro-S hydrogen of NADPH. These restraints were modeled as springs with equilibrium distance of 2 Å and spring stiffness of 10 kcal/mol Å2. After the minimization of the energy of interaction, we equilibrate the system for 10 ps at 10 K allowing only the ligand to move, but keeping the restraints on the reactive distances. The structures obtained in this way are called M2 (minimized 2). The construction of different initial conditions aimed at better reproducing the reactive configuration. However, the risk is that the additional constraint will bias the conformation to higher energy, less stable states. What we observed is that indeed the second setup of the system was affected by an internal strain resulting in larger displacements of the ligand (see Figure 2, Figure 3, and Figure SI–6B) or of the amino acids around the reactive site (see Figure SI–6A). This is indicative that the distances chosen do not describe accurately a reaction coordinate, therefore there might be other degrees of freedom that need to be relaxed.
Figure 2.

Distance between Y367 side-chain hydroxyl hydrogen and dk β-carbonyl oxygen (Y367-dk). The red line shows A1-dkD for L2 simulations, the blue line A1-dkL for L2, the orange line A1-dkD for L1, and the green line A1-dkL for L1.
Figure 3.
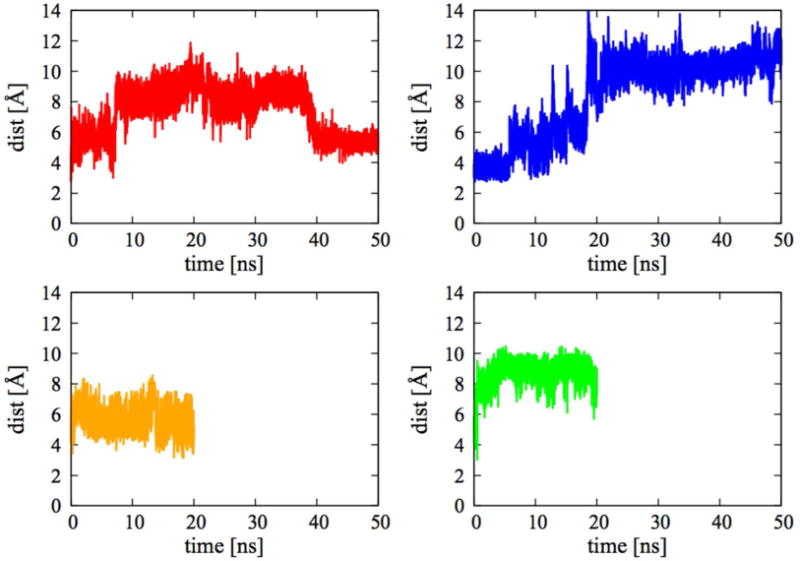
Distance between pro S hydrogen of NADPH and the dk β-carbonyl carbon (NADPH-dk). The red line shows A1-dkD for L2 simulations, the blue line A1-dkL for L2, the orange line A1-dkD for L1, and the green line A1-dkL for L1.
In all the simulation sets, the system was solvated in a 97.5-Å3 box of water molecules. The size of the box was chosen to ensure that in the 8 corners of the box the density of water was close to the expected one for the A1-dkD enzyme-ligand complex (0.988 g/cm3 for A1-dkD complex in the L1 setup computed over 1 ns simulation; the number is slightly larger then the expected one for the water model used, TIP3, which has density 0.982 g/cm3 (15) at 298 K and 1 atm). The box was filled with an average of 28539 water molecules, with a variation between the 8 different initial structures (four simulation sets, two complexes each) of less then 10 water molecules. Twenty-seven sodium ions were added to ensure the neutrality of the simulation box. The solvated M1 and M2 structures are addressed as SolvM1 and SolvM2.
The configurations from which the production runs were started were generated following slightly different heating and equilibration protocols.
For L1, we first relaxed the structure SolvM1 by heating it from 10 K to 300 K in 20 ps. We then run 1 ns of equilibration before sampling the initial structure. For S1, we decided to look at the immediate response of the protein to the ligand starting from a configuration close to the X-ray structure. We suspected that the equilibrium structure is different from the PDB structure and therefore we initiated another set of simulations from a configuration closer to the X-ray structure. Therefore, as for L1, we relaxed the structure SolvM1 by increasing the temperature from 10 K to 300 K in 20 ps. We used the structure at the end of the 20 ps as the initial structure.
For L2, we relaxed the A1-dkD and A1-dkL structures SolvM2 by heating them from 10 K to 300 K in 100 ps while keeping the restraints on the reactive distances. The structure obtained in this way was our initial structure.
For S2, we took the initial structure of L2 and we ran 2ns at temperature 300 K keeping the restraints. We selected 20 configurations per complex, equally spaced along the trajectory, to start the short runs of S2.
The list of all the different MD simulations is reported in Table 1.
Table 1.
List of MD runs performed. The name of the run is in the first column. In the second column we report the name of the structure after minimization. SolvM1 was minimized leaving the dkD/dkL ligand free to move in the binding pocket. For SolvM2 two further restraints were applied to keep the ligands close to the reactive configuration. The third column reports the short equilibration times before running the sampling. The first number is the amount of time spent increasing the initial temperature of the system, the second reports an equilibration at 300 K. The fourth column shows the number of simulation per complex. The last column reports the length of each run.
| Name of Simulation | Initial Structure | Equilibration Time | Number of runs per complex | Time per run |
|---|---|---|---|---|
| L1 | SolvM1 | 0.02 ns + 1.0 ns | 1 | 20 ns |
| S1 | SolvM1 | 0.02 ns | 20 | 1 ns |
| L2 | SolvM2 | 0.100 ns (constrained) | 1 | 50 ns |
| S2 | SolvM2 | 0.100 ns + Variable 0.1–2 ns (all constrained) |
20 | 0.800 ns |
Though the results depend on the initial configuration used, they show the common feature that the correct ligand is a preferred binder compared to the incorrect one.
All the simulations were carried out using the MD software MOIL-OPT,(16) adopting similar setups. The L1 and L2 simulations were run on a single GPU (Graphic Processor Unit) and multiple CPUs (three or four in our simulations) at the same time. The many short simulations (S1 and S2) were run on CPUs, and parallelized to work on three threads.
The Particle Mesh Ewald (PME)(17) algorithm was used to account for the long range electrostatic interactions. The cutoff for van der Waals interactions and for the real space part of PME was set to 9.5 Å. The PME tolerance was set to 10−9, and the PME grid to 1003. A spring was attached to the geometric center of the enzyme to restrain its center of mass translation. The SHAKE algorithm(18) in its matrix form(19) was used to constrain bonds and angles in the water molecules. All the bonds in the enzyme and ligands were also constrained using matrix shake(19, 20) in L1/S1, while in L2/S2 only the light atoms were constrained with SHAKE.
A “velocity rescaling” thermostat was used to run the simulations in the NVT ensemble.(21) The time step was 1 fs. We used the RESPA algorithm,(22) which allowed us to compute the long-range part of PME (i.e. the reciprocal space part of the calculation) once every four steps.
The force field that we used for the protein was the all atom version of OPLS.(23) For the water molecules the TIP3P force field was adopted.(15) The force field for NADPH and dk was parameterized for this work (see Supplementary Information for details).
RESULTS
First we present the results from the L1/L2 simulation sets. We then report the results from the S1 simulation set. The analysis of the S2 simulation set is described in the Supplementary Information, together with a comparison of the conformations explored by the diketide in the binding site, in solution, and in vacuum.
Evidence From The Long Simulations L1/L2
The L1/L2 simulations for both of the complexes show that the force field that we used is accurate enough to keep the correct ligand (dkD) closer to the reactive configuration.
In Figure 2 and Figure 3 we show the reactive distances Y367-dk and NADPH-dk as a function of time.
The L1 simulations (orange and green) reach quickly (within few ns) a steady state that is kept throughout the rest of the simulation. Within the first 20 ns, the L2 simulations (red and blue) show instead larger changes. This might suggest that initial structure of the L1 simulations is closer to a stable bound state than the one of the L2 simulations.
In the first 7.5 ns of the L2 simulations the A1-dkL complex (blue) shows more reactive configurations than the A1-dkD complex (red), i.e. the Y367-dk (Figure 2) and NADPH-dk (Figure 3) distances are simultaneously less than 4 Å. On the other hand, after this initial stage, the NADPH-dk distance for the A1-dkL complex (blue, Figure 3) starts to drift away from the reactive configuration, while the NADPH-dk distance for the A1-dkD complex (red, Figure 3), after an initial drift, goes back to roughly 6 Å. In the last 10 ns of the L2 simulations, the Y367-dk distance (Figure 2) for A1-dkD (red) and A1-dkL (blue) tends to stay at around 6 Å, with A1-dkD showing smaller fluctuations than A1-dkL.
Since the Y367-dk and NADPH-dk distances in the L1 trajectories and in the last 10 ns of the L2 trajectories are more stationary, properties averaged over the simulations are more likely to be converged. We consider first the average displacement of the correct and incorrect ligand from their initial structure. To do so, we align all the structures sampled in the L1/L2 simulations to the initial structure (as initial structures we used the structures obtained after energy minimization – SolvM1 and the SolvM2 configurations – for the L1 and L2 simulation sets, respectively). To do so, the Kabsch algorithm(24) is used to align the Cα carbons of all the protein residues. In what follows, all the structural alignments are performed by aligning the α carbons of all the protein residues, unless otherwise stated. We then measure the average distance of the dk ligand from the initial one using the following formula for the average RMSD:
| (1) |
where the subscript i refers to atom and the number in parenthesis to the configuration. The starting configuration is labeled “0”, the total number of configurations is NCONF, Ndk is the number of atoms belonging to dk. The result is that the average displacement for the dkD ligand in the binding pocket from the initial structure for the L1 simulations is 2.09 Å, while the RMSD of dkL is 4.19 Å. For the last 10 ns of the L2 simulations instead we have that the dkD RMSD is 5.72 Å, while the dkL RMSD is 8.97 Å. This suggests that the correct enantiomer stays closer to the initial configuration compared to the incorrect substrate, as it should.
We also examined the number of configurations that are reactive, i.e. structures in which the Y367-dk and NADPH-dk distances are simultaneously below 4 Å. There are 46 such configurations for the A1-dkD complex, spanning the whole length of the simulation (the first reactive structure is observed after around 0.25 ns, the last after 19.97 ns). There are only 4 reactive configurations found for A1-dkL, all in the first 0.554 ns. In the last 10 ns of the L2 simulations there are 2 reactive configurations of the A1-dkD complex, while we found none for the A1-dkL. Indeed, the dkL ligand is close to the reactive tyrosine (closer then dkD in fact, see Figure 2), but it does never come close to the NADPH (see Figure 3).
In conclusion, the L1 and L2 simulations show that the A1 enzyme is able to recognize dkD as a preferential ligand at the level of weak physical interactions. They also show that the system setup of L1 generates trajectories that tend to drift from the initial structure less than those generated with the L2 setup. The initial structures for the L2 simulations may carry significant internal strain due to our initial bias. The internal strain may be due to the restrain on the reactive hydrogen bonds that were added in the generation of the initial configurations for L2/S2. Instead of facilitating the generation of an initial structure close to the reactive configuration, these restrains may have introduced some strain that is reflected in a more mobile ligand (see Fig. SI–6). On the other hand, it is still remarkable that the correct ligand dkD finds its way back to a configuration much closer to the reactive structure compared to dkL.
In both L1 and L2 the ligand abandons at least temporarily the reactive configuration. It moves away within the first few nanoseconds (L2 for A1-dkD, L1 and L2 for A1-dkL). In the L2 simulation of the A1-dkD complex the substrate returns to a configuration close to the reactive one. In the other cases, during the rest of the simulation dk does not get close again to a reactive configuration. A different simulation strategy may be in place if we want to understand the behavior of the complex in the neighborhood of the reactive configuration. Such a strategy is described in the next section.
Evidence From the Short Simulations Sets: S1
Twenty trajectories of the S1 set are generated starting from SolvM1 (see Table 1) configuration with different initial velocities sampled from the Maxwell-Boltzmann distribution at 300 K. The initial configuration for the S1 simulation set is not equilibrated, and as such is much closer to the PDB structure, so the configurations tend to drift rapidly from the initial structure. Nevertheless, it is interesting to look at the average displacement of the ligand (see Eq. 1) and at the number of reactive configurations found. The data is reported in Table 2.
Table 2.
Average displacement from the initial structure (see definition in Eq. 1) and number of reactive configurations (i.e. instances in which NADPH-dk distance and Y367-dk distance are simultaneously below 4Å) for A1-dkD and A1-dkL complexes in the S1 simulation set.
| dkD | dkL | |||
|---|---|---|---|---|
| <RMS> | # React Conf | <RMS> | # React Conf | |
| A1 | 2.07Å | 3957 (~20%) | 2.51Å | 1163 (~6%) |
The A1-dkD has more reactive configuration and the ligand moves less from the initial condition. The short simulations set S1 reproduces this qualitative feature of the L1 simulation set.
The incorrect ligand may abandon the reactive configuration using either or all of three different types of movement:
A rigid body displacement of the ligand out of the binding pocket;
A rigid body rotation of the ligand in the binding pocket;
A distortion of the internal degrees of freedom.
Figure 4 shows:
the distribution of the center of mass displacement in the binding pocket for dkD (red) and dkL (blue) with respect to the initial position;
the distribution of the angles of rigid body rotation for dkD (red) and dkL (blue) respect to the initial position (details on the definition of the angle are in the caption of Figure 4);
the “end-to-end” distance of the ligand, i.e. the distance between the initial and final methyl group for dkD in the A1 enzyme (red), for dkL in the A1 enzyme (blue), and for dkD and dkL in solution (dark green and dark yellow, respectively), and in vacuum (light green and light yellow, respectively).
Figure 4.

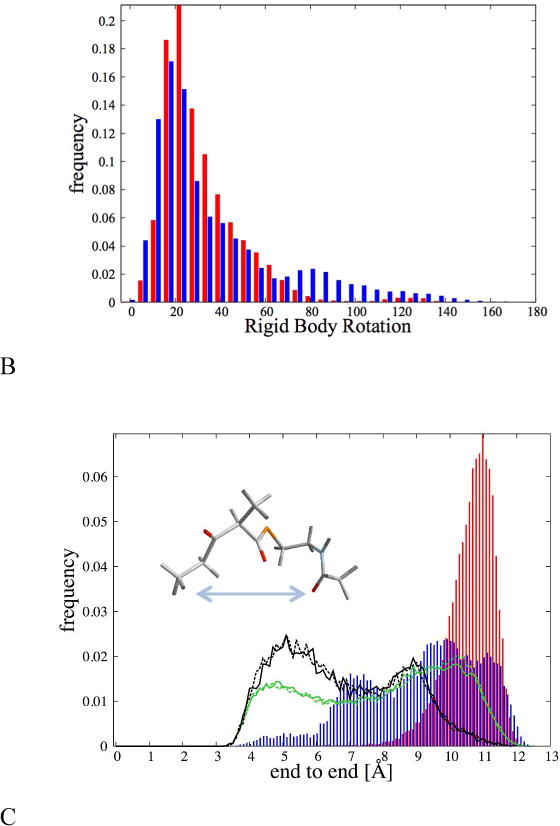
Different types of movement of the ligand in the binding pocket. (A) Displacement of the center of mass of the ligand; (B) rigid body rotation; (C) change of the internal structure, measured as the end-to-end distance, i.e. the distance between the methyl carbon C1 and the methyl carbon C10 (see Figure 1A for the nomenclature). In red we show the distribution for dkD, in blue for dkL. In (C) the dark green and dark yellow gold histograms report the distribution of end-to-end distances in solution for dkD (green) and dkL (yellow). In light green and light yellow the histograms of the end-to-end distances in vacuum for dkD (green) and dkL (yellow). The rigid body displacements were computed aligning all the trajectory configurations to the initial structure (SolvM1, see Table 1). The atoms used for the alignment were those belonging to the residues around the binding pocket (residues A309-A313, W359-Y367, W393-M401, P405-Q414, and E447-A455). The translation is defined as the distance from the center of mass of the ligand in the initial configuration. The overall rotation was computed by aligning the ligand (already rotated to account for the changes in the position of the binding pocket) with the ligand in the initial configuration using the Kabsch algorithm.(24) From the rotation matrix we extracted the rotation angle as arccos .
From Figure 4-A,B it is clear that the overall translations and rotations are similar for the correct and incorrect substrates.
The sharply peaked distribution of the end-to-end distance of the correct substrate in Figure 4C (red) illustrates that dkD is held stretched by the enzyme. In contrast the dkL ligand (blue) has a much broader distribution of distances, almost as broad as the distribution of end-to-end distance of both enantiomers in solution (dark yellow and dark green). This suggests that the incorrect ligand is unable to “hook” to the protein with specific interactions.
The Reactive Configuration
The significant sample of short trajectories allows us to examine how the enzyme in the crystal structure responds to the two ligands (dkD and dkL) placed in a reactive configuration. Recall that we define a reactive configuration by only two distance constraints between the ligand, the protein and NADH (one with the β-carbon C3 and one with the β-carbonyl oxygen O3, see Figure 1A for the names of the atoms). We expect the correct stereoisomer to be more tightly packed in the binding pocket compared to the incorrect one. In particular, we expect that the dkD ligand is the correct geometry when it is in the reactive configuration We therefore examine below additional degrees of freedom.
We consider the dihedral angles of the ligand that include only carbon, sulfur or nitrogen atoms. A histogram of the distribution of these dihedral angles (with 12 bins from −180 to 180) was computed. Let piα is be the probability that the dihedral angle α is found in the i-th bin. We measure the spread of the distribution with the function
| (2) |
The above function is the entropy in equilibrium. This function is maximal when the distribution is uniform. The larger is the value of the function, the least informative, or more spread, is the distribution.
In Table 3 we report the values of Sα measured on the whole set of configurations, only on the reactive configurations, and in a 50-ns simulation of the two enantiomers in water. The calculations were conducted for both ligands A1-dkD and A1-dkL.
In the A1-dkD complex, the reactive configurations are always characterized by a reduction of Sα. This happens also with torsions 33 and 42, which are far away from the atoms whose positions is used to define the reactive configuration. This is not the case for A1-dkL: the value of Sα in the reactive configurations is smaller for some dihedrals, though larger for others. The selection of a specific reactive configuration and locking into a particular configuration seem to be properties of only the correct complex, A1-dkD. Also, the sum of the values of Sα is representative of the overall internal flexibility of dk (it does not measure it correctly because the torsions are not independent). This sum is larger for the dkL ligand than the sum of Sα of dkD, in agreement with what we stated before: the internal degrees of freedom of the incorrect ligand are looser. The last two columns show the value of Sα for all the torsions of the two stereoisomers of the ligand in water solution. Note that, in the case of the dkD molecules, with the exception of torsion 42, all the dihedrals in water have larger value of Sα. For the dkL molecule instead, the value of Sα in the binding site is larger than in water for dihedral 10, 13, 14, 28 (almost the same), and 42.
A pictorial representation of this difference is given in Figure 5. First, we show ten dkD ligands randomly selected from the set of reactive configurations and then aligned (Figure 5A). Then we show ten structures taken randomly from the whole sample of structures (Figure 5B). Clearly, imposing the two conditions on the β-carbonyl carbon and oxygen reduces the configurations available throughout the ligand. The same conditions do not reduce significantly the flexibility of the dkL ligand in reactive configurations (Figure 5C): the superposition of the randomly chosen structures shows poor structure selection for the incorrect enantiomer, making Figure 5C similar to the sample of ten structure from the whole simulations of A1-dkL shown in Figure 5D.
A typical reactive configuration obtained from our simulation for the A1-dkD complex is shown in Figure 6A.
Figure 6.

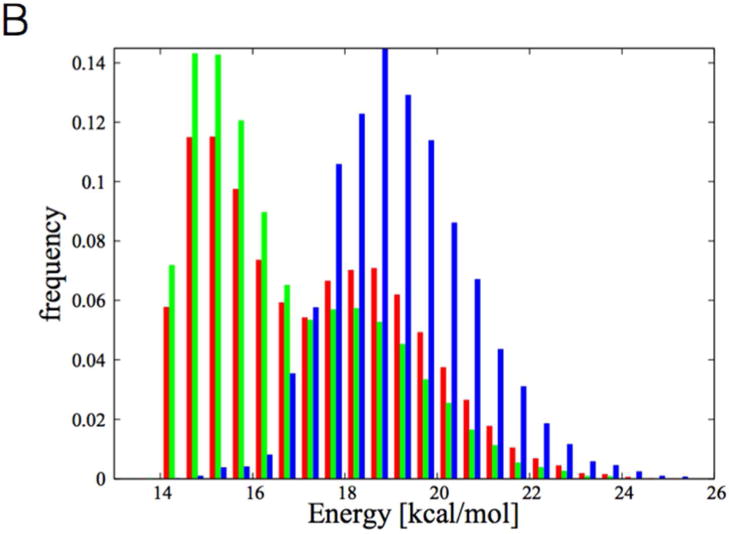
(A) A reactive configuration for the A1-dkD complex. Only the ligand (dkD), the reactive tyrosine (Y367), and the NADPH are shown. In dashed lines the NADPH-dk and Y367-dk distances are shown. (B) Distribution of energies of interaction (van der Waals and electrostatic) between the sulfur of the ligand S and the β-carbonyl oxygen O3 (for nomenclature see Figure 1A) for the A1-dkD complex. In red we report the distribution for all the configurations, in green the distribution for the non-reactive ones, and in blue the distribution for the reactive configurations.
This configuration is characterized by a rotation of the non-reactive β-carbonyl away from Y367. At the same time, the sulfur (in orange, highlighted by the orange arrow) is moved towards the reactive oxygen. As shown in Figure 5A, this feature seems to be common to many reactive configurations, while this is not true in general (see Figure 5B). The vicinity of the sulfur to the β-carbonyl oxygen in the reactive configuration might play a role in facilitating the reaction catalyzed by the enzyme. Indeed, the vicinity of two electronegative atoms may assist the transfer of a proton from Y367 to the β-carbonyl oxygen, and reduce the electrostatic repulsion. The repulsive energy between the sulfur and the reactive oxygen is shown in Figure 6B, where the red histogram shows the distribution of interaction energies (electrostatic and van der Waals) in all the configurations found, the green for the non-reactive configurations and the blue for the reactive. Clearly, in the reactive configurations there is a strong repulsion between the sulfur and the β-carbonyl oxygen.
At this stage, the role played by the repulsion between the sulfur and the β-carbonyl oxygen in facilitating the reaction is suggestive. Quantum mechanical calculations could further assist in determining whether the interactions include higher order terms such as polarization and charge transfer. Moreover, extensive sampling will be required to learn about thermodynamics and kinetics of the process. It has been pointed out in many circumstances how important is the role of electrostatic interactions in the catalytic power of enzyme.(25)
Microscopic Reasons For Specificity
So far, we illustrate by analysis of trajectory data that the weakly bound protein-ligand complex with the correct ligand (dkD) is more favorable than the one with the incorrect ligand (dkL). In particular, we showed that more reactive configurations are found, and that they are characterized by a specific geometry (Figure 5) that fits the desired protein function (Figure 6A). We did not discuss the microscopic interactions responsible for the selection of the proper enantiomer; a topic which is addressed in the present section.
We start by examining the NADPH and Y367, which are both involved in the reaction. We ask: “Is their behavior significantly different for the correct and incorrect binding cases?” It seems that it is not. NADPH is strongly bound for both the correct and the incorrect complex (average RMSD of 1.03 Å and 1.02 Å, respectively, see also Appendix). The same is true for the reactive tyrosine Y367 (average RMSD of 0.91 Å and 0.92 Å, respectively). There is a strong hydrogen bond between the 2′ hydroxyl group of the ribose ring of NADPH and Y367 side-chain oxygen (see Figure 7A), which holds in position the tyrosine ring. This is regardless of the chirality of the substrate.
Figure 7.

(A) dkD ligand, NADPH and reactive tyrosine Y367 shown together as in Figure 6A, but from a different angle. The hydrogen bond between the 2′ hydroxyl group and Y367 side-chain oxygen is shown in dashed lines. The carbons in the ribose ring of NADPH are numbered. (B) Distribution of the hydrogen bond distance between the NADPH 2′ hydroxyl hydrogen and Y367 side-chain oxygen (atoms connected with a dashed line in panel A of this figure) for A1-dkD (red) and A1-dkL (blue).
The distributions of the hydrogen bond distance for the correct (red) and incorrect (blue) enzyme-ligand pairs are shown in Figure 7B.
The hydrogen bond between the amide carbonyl group of the ligand and the side-chain of W359 is considered important for properly aligning the ligand in the binding pocket (see Figure 8A).
Figure 8.


(A) dkD ligand, tyrosine Y367, NADPH, and tryptophan W359 are displayed in a reactive configuration. The hydrogen bond between the dk oxygen O9 (see Figure 1A for the nomenclature) and the side-chain of W359 is shown as a black dashed line. (B–C) Distribution of distances between W359 side-chain and the O9 oxygen of the dk ligand (see Figure 1A for nomenclature and the dashed black line in panel A of this figure) for A1-dkD complex (B) and A1-dkL complex (C). The red histograms show the distribution of distances in all configurations. The green histograms show the distribution of distances for non-reactive configurations, and the blue ones the distribution for reactive configurations.
Figure 8B–C shows that this hydrogen bond is tighter in the case of the correct complex (A1-dkD, red histogram Figure 8B) than with the wrong one (A1-dkL, red histogram Figure 8C).
To explore the role of the α-methyl substituent, we looked at what is the amino acid whose center of mass is closer to the α-methyl substituent at every instant of time. The data for the A1-dkD complex for reactive (green) and non-reactive (red) configurations is shown in Figure 9, together with the two distributions for A1-dkL complex: in orange the one for reactive configurations, and in blue the one for non-reactive configurations.
Figure 9.

Histogram of the number of times the center of mass of the amino acid listed on the x-axis is the closest to the α-methyl substituent. Red: A1-dkD complex, non-reactive configurations. Green: A1-dkD complex, reactive configurations. Blue: A1-dkL complex, non-reactive configurations. Orange: A1-dkL complex, reactive configurations.
In Figure 10 and Figure 11 the amino acids discussed in Figure 9 are colored as the highest bar in Figure 9. So, V407 is reported in red, A356, Q364, and Y367 are green, M401 is blue, and G394 and A402 are orange.
Figure 10.

(A) A1-dkD complex, reactive configuration. All the amino acids discussed in Figure 9 are shown. Note that the D-α-methyl substituent (highlighted in a black circle) is close to the green amino acids, particularly very close to Q364. The dashed line shows that the reactive oxygen of dkD is aligned with the reactive hydrogen of Y367. (B) A1-dkD complex, non-reactive configuration. In this case the D-α-methyl substituent (highlighted in a black circle) is close to the red amino acid, V407. The dashed line shows that the reactive oxygen of the β-carbonyl of dk points towards the Q364.
Figure 11.
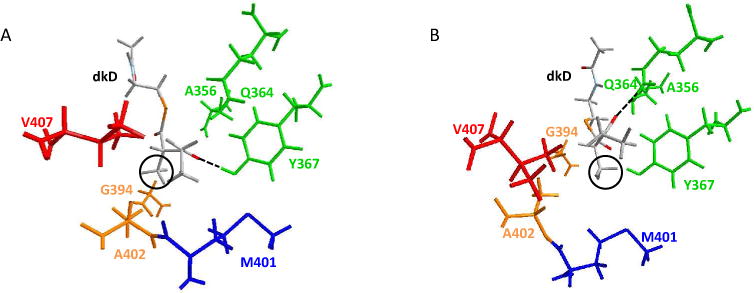
(A) A1-dkL complex, reactive configuration. All the amino acids discussed in Figure 9 are here shown. Note that the L-α-methyl substituent (highlighted in a black circle) is close to the orange amino acids, G394 and A402. (B) A1-dkL complex, non-reactive configuration. In this case the L-α-methyl substituent (highlighted in a black circle) is close to the blue amino acid, M401. Note that the dashed line shows that the reactive oxygen of the β-carbonyl of dk points towards Q364.
For A1-dkD, the non-reactive configurations are peaked on the V407 amino acid (red, see Figure 10B), which is on the lid helix (the lid helix is the helix on the opposite side of the binding pocket with respect to the Y367). The reactive configurations are instead peaked on Q364 and Y367 (green, see Figure 10A). We observe from Figure 9 that the non-reactive configurations (red) have a large population also for the Q364 and Y367 amino acids, indicating that the sets of configurations, reactive and non-reactive, are not dramatically different. Note also that in non-reactive configurations the oxygen of the β-carbonyl group of dkD is pointing towards the glutamine 364, as shown by the dashed black line in Figure 10B.
For A1-dkL instead (see Figure 11), the non-reactive configurations (blue, see Figure 9) have a peak at the M401 amino acid (reported in blue in Figure 11B), which is buried in the binding pocket, away from the cleft, close to the NADPH (non displayed in Figure 11 for clarity, but it would be under Y367, on the right side of M401). The reactive configurations (orange, see Figure 9) are peaked near G394 (reported in orange in Figure 11A), which is still away from the cleft, but on the opposite side with respect to the NADPH, closer to W359 (not reported on Figure 11 for clarity, but it would be close to A356, on its left). Note that, as in Figure 10B, also in this case for non-reactive configurations the oxygen of the β-carbonyl group of dkL is pointing towards Q364, shown with the dashed lines.
This analysis suggests the presence of two different modes in the binding pocket for the β-carbonyl of the ligand: a reactive one, in which it binds with the hydroxyl group of Y367 (Figure 10A and Figure 11A, dashed lines), and a non-reactive one, in which it moves closer to the side-chain of Q364 (Figure 10B and Figure 11B, dashed lines). To further assess this conjecture, we plot a two dimensional histogram. On the x-axis there is the distance between the ligand O3 β-carbonyl oxygen and the Q364 side-chain nitrogen (the distance highlighted in dashed lines in Figure 10B and Figure 11B, let’s refer to it as Q364-dk). On the y-axis there is the distance between the same dk oxygen O3 and the hydrogen of the hydroxyl group of Y367 (the distance highlighted in dashed lines in Figure 10A and Figure 11A, which we will refer to as Y367-dk, as we did in the previous paragraphs).
In Figure 12A the result is shown for the A1-dkD complex, in Figure 12B for the A1-dkL complex.
Figure 12.
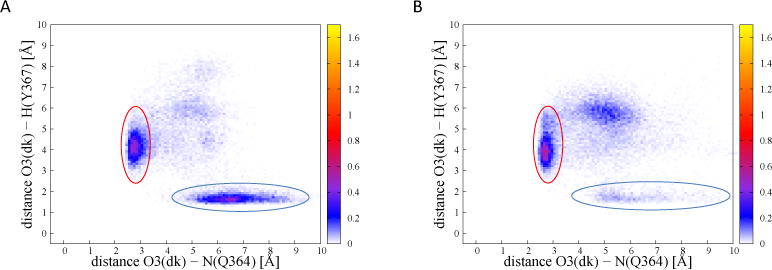
Two-dimensional probability density of critical distances. (A) A1-dkD complex, two-dimensional histogram. The horizontal axis is the distance between the nitrogen on the side-chain of Q364 and the dk reactive oxygen O3 (Q364-dk). The vertical axis is the Y367-dk distance. The probability density is color-coded. The circles highlight the two possible contacts. The red circle corresponds to the region where the oxygen is in contact with Q364 (see Figure 10B, dashed lines), the blue corresponds to the reactive hydrogen bond between Y367 and the β-carbonyl oxygen (see Figure 10A, dashed lines) (B) A1-dkL, same figure. The red region corresponds to the bond highlighted with a dashed line in Figure 11B; the blue region to the one highlighted with a dash line in Figure 11A.
Figure 12A has two clear peaks, one corresponding to a hydrogen bond between the reactive oxygen of dkD and the reactive hydrogen of Y367 (in a blue circle), and another in which instead the reactive carbonyl is closer to Q364 side-chain (in a red circle). In Figure 12B we notice that the first of the two peaks is significantly weaker (blue circle), while the second is more pronounced (red circle). Indeed, the maximum height of the peak circled in red in Figure 12 is 0.495 for A1-dkD (Figure 12A), and 0.625 for A1-dkL (Figure 12B). This suggests that glutamine Q364 is able to “fish out” the reactive carbonyl from its reactive configuration more efficiently in the A1-dkL enzyme than in the A1-dkD.
What is the role of the α-methyl substituent in this different behavior? Figure 10A shows that the D-α-methyl substituent in a reactive configuration places itself between the reactive carbonyl and Q364, while in a non-reactive configuration (Figure 10B) it rotates away from Q364, facilitating the interaction between the reactive carbonyl of the ligand and the amide group of Q364 side-chain. In the A1-dkL complex (Figure 11) the L-α-methyl substituent is oriented towards the inside of the cleft and is unable to perturb the interaction between the reactive carbonyl and Q364. These features are common to a significant number of reactive configurations, as we can illustrate looking at the histogram of the following order parameter:
| (3) |
where d (a, b) is the distance between a and b, dkO3 is the reactive oxygen of the ligand, dkC5 is the α-methyl substituent carbon and Q364 is the position of the nitrogen of the glutamine residue. There are three possibilities, as illustrated in Figure 13:
The triangle with vertexes dkO3, dkC5, and the nitrogen of Q364 becomes close to a line segment with dkC5 lying between dkO3 and the nitrogen of Q364. In this case T ≈ 0;
The three atoms form a triangle; the further away dkC5 is from the segment connecting dkO3 and Q364, the larger is T.
dkC5 is close to the line identified by dkC5 and Q364, but outside of the line segment connecting dkO3 and Q364; in this case T is positive and roughly twice as large as the distance between dkC5 and the farthest away between the other two (in Figure 13 Q364).
Figure 13.

Three pictorial illustrations of the size of the parameter T in three different cases. In red the dkO3 is reported, in blue the dkC5, and in green Q364. The orange thick line represents the parameter T, as introduced in Eq. 3. (A) The case in which the three atoms almost lie on the same line, with dkC5 between dkO3 and Q364. The parameter T is close to zero. (B) When the triangle is formed, T is large. (C) If the three atoms almost lie on the same line, but with dkC5 outside of the segment connecting dkO3 and Q364, then the parameter T is large. The cases presented in (B) and (C) both result in large values of the order parameter T. Hence, T can only distinguish configurations like the one in (A) from other spatial arrangements.
The cases B and C are not distinguished by the order parameter T. Hence, this order parameter can only distinguish the spatial arrangement pictured in Figure 13A from other spatial arrangements.
In Figure 14A T is shown for the A1-dkD complex for all the configurations (red), for the non-reactive configurations (green), and for the reactive configurations (blue). The same color code holds for Figure 14B, where T is shown for the complex A1-dkL.
Figure 14.
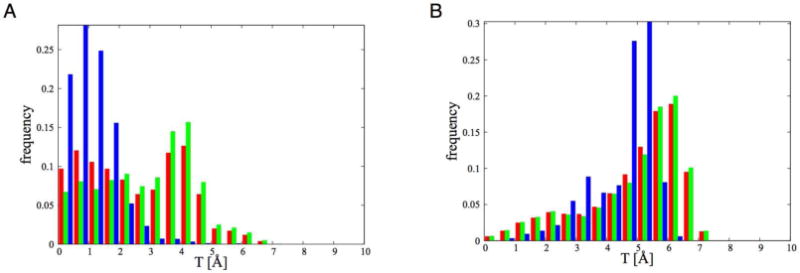
(A) Parameter T (see Eq. 3 for the definition) for A1-dkD complex. In red the distribution for all the configurations is reported, in green the distribution for the non-reactive and in blue for the reactive ones. (B) Same as (A) but for the complex A1-dkL.
Figure 14 shows that when A1-dkD is in the reactive state the distribution of T has a peak for small values (Figure 14A, blue), suggesting that indeed the dkC5 places itself between dkO3 and Q364, keeping them away and reducing the strength of their interaction. This is not true for the A1-dkL complex (Figure 14B).
Experiments have shown a loss of specificity upon mutation of Q364 with histidine.(10) The above analysis of MD simulations correlate positively with this experimental finding, and it also suggests their microscopic interpretation. Histidine is less flexible than glutamine, and tends to form shorter hydrogen bonds.(26) This suggests that it might not be able to reach for the β-carboxyl group as well as the glutamine. Furthermore, histidine is bulkier compared to glutamine. This might challenge the rotation of the D-α-methyl substituent towards the configuration found in the reactive configuration (see Figure 10A and Figure 14A). Ultimately, a simulation of the mutant is needed to show whether this is indeed the case. We leave a detailed analysis of the Q364H mutant for future work.
Discussion
In this paper, we presented MD simulations of the enzyme KR in complex with NADPH and either of two enantiomers of the substrate dk (dkD and dkL). Experiments show that the enzyme as examined in MD simulations is physically stereospecific for the D-enantiomer.
The goals of our simulations are:
Test whether the MD model is capable of determining the known stereospecificity of the enzyme;
Suggest a microscopic picture of the stereospecificty by analyzing atomistic trajectories.
To establish the specificity of the enzyme, we placed the correct and incorrect ligands close to a reactive configuration in the binding pocket. A reactive configuration was established by examining two distances: between the β-carbonyl oxygen of the substrate and the hydroxyl hydrogen of Y367, and between the β-carbonyl carbon of the substrate and the pro S-hydrogen of NADPH.
Two sets of long simulations (20 ns and 50 ns) of the correct (A1+NADPH+dkD) and the incorrect (A1+NADPH+dkL) ternary complexes showed that the enzyme tends to retain the correct ligand in the binding pocket closer to the reactive configuration. This encouraging result suggested that the force field might be accurate enough to capture the subtle difference between the correct and incorrect ligand. On the other hand, the long MD simulations also showed that the substrate is not tightly bound in the cleft. The substrate dk is extremely flexible, as we showed running simulations of the substrate in water and in vacuum (see also Supplementary Information). The substrate undergoes significant displacements and fluctuations also in the binding pocket. This may also be caused by the structure of the enzyme. Indeed, we used a crystal structure of an open configuration of the enzyme, and a few tens of nanoseconds are unlikely to be sufficient for the enzyme to undergo the complete conformational transition towards a close state. The time scale for induced fit might not be accessible to standard MD simulations. So, we conclude that the analysis of the long trajectories, even though encouraging, is incomplete, as it is focused on the initial step of physical binding and not on the conformational transition of the protein (induced fit).
The microscopic interactions that lead to the stereospecificty are hard to detect if we look at a single event in which the substrate is loosely bound, as in the long simulations. A better approach is to reproduce multiple short trajectory from the enzyme with the substrate bound, and look at the very early (within 1 ns) fluctuations of the complex, hoping to detect in these short simulations a signal of stereospecificity, and to use the statistics gathered to rationalize the results.
According to our definition of a reactive configuration, the first set of short simulations (S1) shows that the substrate in the correct ternary complex stays closer to the initial structure, and shows more reactive configurations. The stereospecificity was then recovered in these simulations.
The analysis of the S1 short trajectories highlighted a number of interesting features of the complex in reactive configurations. First of all, in the first nanosecond the incorrect ligand drifts away from the reactive configuration because of a larger internal flexibility compared to the correct ligand. Some hydrogen bonds, such as the hydrogen bond with W359, which is tighter for the correct ligand, may play a role in restraining these internal fluctuations. We also found that when the correct substrate is in a reactive configuration, it shows a reduced flexibility, so that the reactive distances induce an overall structure for the substrate. This structure shows that the sulfur group rotates towards the reactive β-carbonyl oxygen, creating some strain in the reactive region of the substrate. This is suggestive of a role played by the electrostatic strain induced by the sulfur in facilitating the reduction of the β-carbonyl carbon.
The analysis of the interactions of the D/L-α-methyl substituent with the amino acids in the binding pocket suggests an atomistic picture of specificity. While in reactive configurations the β-carbonyl carbon is close to the hydroxyl of Y367 side-chain, in non-reactive configurations it seems to rotate towards the amide of Q364 side-chain. This is true for both the enantiomers of the substrate. What is significantly different in the population of the two configurations? In the case of the correct ligand, the two configurations are similarly populated, while in the case of the incorrect ligand the frequency of the reactive configuration is significantly smaller. This difference correlates well with the role that the α-methyl substituent plays in disrupting the interaction between the β-carbonyl oxygen of dk and the amide of Q364 side-chain. Indeed, while the D-α-methyl substituent tends to place itself in between the reactive β-carbonyl oxygen and Q364, for the D-α-methyl substituent is it geometrically more difficult to interfere with this interaction. It seems then that the enzyme offers two binding modes close to the reactive configuration, a correct one with Y367, and an incorrect one with Q364. The incorrect ligand has a larger population of the incorrect binding mode compared to the correct ligand. The D-α-methyl group around the chiral carbon interferes with the amide of Q364, keeping it away from the place of the reaction. This picture compares favorably with experimental evidence that highlights the importance of Q364 in stereospecificity. Indeed, it was shown that the Q364H mutant of the enzyme is non-specific.(10)
A different set of short simulations (S2) did not show the same picture. On the other hand, their initial structure showed some strain due to a minimization procedure in which the reactive distances were enforced at 2 Å. Yet, those simulations showed the importance of a network of hydrogen bonds for the proper alignment of Y367 in the reactive configurations. These hydrogen bonds involve the hydroxyl group of Y367 and the hydroxyl group of the neighbor S354, and the 2′ hydroxyl of NADPH ribose ring (see Supplementary Information for the analysis of the S2 simulation set).
The simulations of the dkD and dkL ligands in water and vacuum showed some features that could play a role in the preferential turning over of the dkD ligand. The reactive region of the dkD substrate tends to have a configuration in the binding pocket more similar to the configuration in water and vacuum then dkL. The differences are not very large, but they can possibly contribute to the stereospecificity favoring the binding of the correct substrate compared to the incorrect one (see Supplementary Information for the comparison of the configurations explored by the substrates dkD and dkL in different environments).
Finally, while considerable efforts were devoted to test the convergence of the sampling by conducting long trajectories, and multiple MD runs with different protocols, KR includes a number of flexible loops. The conformational sampling of these loops is particularly challenging and we are not sure if the computations presented fully explored the loop conformations. Further future studies of loop conformations are therefore warranted.
Supplementary Material
Acknowledgments
The PDB file of the E0 structure (ternary complex with the dkD ligand) was provided by Dr. Jianting Zheng, whose contribution is gratefully acknowledged.
Funding Source Statement. We thank the National Institutes of Health (GM106112, A.T.K., and GM59796, R.E.) and the Welch Foundation (F-1712, A.T.K., and F1783, R.E.) for financial support.
List of abbreviations
- PKS
modular polyketide synthase
- KR
a PKS ketoreductase
- A1
an A1-type KR (PDB 3MJS, molecule B)
- dk
the diketide ligand, 2-methyl-3-oxopentanoate-S-N-acetylcysteamine
- dkD
dk containing a D-α-methyl group
- dkL
dk containing a L-α-methyl group
- NADPH
nicotinamide adenine dinucleotide phosphate (reduced form)
- E0
experimental structure with the dk modeled in
- M1
structures following the first energy minimization protocol
- M2
structures following the second energy minimization protocol
- SolvM1
solvated M1 structure
- SolvM2
solvated M2 structure
- MD
molecular dynamics
- L1
first set of long (20 ns) MD simulations
- L2
second set of long (50 ns) MD simulations
- S1
first set of short (1 ns) MD simulations
- S2
second set of short (800 ps) MD simulations
APPENDIX
The NADPH is bound to the protein in the crystal structure configuration for the entire simulation. However, we observed a rotation of the phosphate group attached to the 2′ carbon of the adenine of NADPH. In this new conformation the phopshate group maintains its position inside its binding pocket (arginines 251–252). This new conformation allows the formation of a hydrogen bond between the hydroxyl group at the 3′ position of the adenine sugar ring and an oxygen of the phosphate group that was not present before. The new conformation may be transient or a free energy minimum. The changes are small, and the group is far from the reactive site to suggest that this has an impact on our analysis. However this observation should be taken into consideration in further studies of this system.
Footnotes
Supporting Information
In the Supplementary Information we provide a description of the force field that we used to simulate NADPH and dk. We pay particular attention to those parameters that we have obtained as a result of the quantum mechanical calculations that we conducted.
We further discuss the analysis of the S2 set of simulations, and compare the results with the other sets. The analysis of these trajectories highlighted that the initial configuration had some strain, and pointed also to the importance of a couple of hydrogen bonds in the binding pocket. Finally, we look at the configurations explored by the dkD and dkL ligands in the binding pocket, in water, and in vacuum. The distribution of the torsion O3-C3-C6-O6 (see Figure 1A for nomenclature) are dkD is similar in all the environments, while more differences are observed for dkL when it is in the enzyme compared to solution/vacuum. This material is available free of charge via the Internet at http://pubs.acs.org.
References
- 1.Johnson KA. Role of induced fit in enzyme specificity: A molecular forward/reverse switch. J Biol Chem. 2008;283:26297–26301. doi: 10.1074/jbc.R800034200. [DOI] [PMC free article] [PubMed] [Google Scholar]
- 2.vanBeek J, Callender R, Gunner MR. The contribution of electrostatic and van der Waals interactions to the stereospecificity of the reaction catalyzed by lactate dehydrogenase. Biophys J. 1997;72:619–626. doi: 10.1016/s0006-3495(97)78700-9. [DOI] [PMC free article] [PubMed] [Google Scholar]
- 3.Kirmizialtin S, Nguyen V, Johnson KA, Elber R. How Conformational Dynamics of DNA Polymerase Select Correct Substrates: Experiments and Simulations. Structure. 2012;20:618–627. doi: 10.1016/j.str.2012.02.018. [DOI] [PMC free article] [PubMed] [Google Scholar]
- 4.Warshel A, Naray-Szabo G, Sussman F, Hwang J-K. How do serine proteases really work? Biochemistry. 1989;28:3629–3637. doi: 10.1021/bi00435a001. [DOI] [PubMed] [Google Scholar]
- 5.Plount-Price ML, Jorgensen WL. Analysis of Binding Affinities for Celecoxib Analogues with COX-1 and COX-2 from Combined Docking and Monte Carlo Simulations and Insight into the COX-2/COX-1 Selectivity. Journal of the American Chemical Society. 2000;122:9455–9466. [Google Scholar]
- 6.Chipot C, Pohorille A. Free Energy Calculations Theory and Applications in Chemistry and Biology. Springer-Verlag; Berlin, Heidelberg: 2007. [Google Scholar]
- 7.de Graaf C, Oostenbrink C, Keizers PHJ, van Vugt-Lussenburg BMA, Commandeur JNM, Vermeulen NPE. Free energies of binding of R and S propranolol to wild-type and F483A mutant cytochrome P450 2D6 from molecular dynamics simulations. Eur Biophys J Biophy. 2007;36:589–599. doi: 10.1007/s00249-006-0126-y. [DOI] [PMC free article] [PubMed] [Google Scholar]
- 8.Keatinge-Clay AT. The structures of type I polyketide synthases. Nat Prod Rep. 2012;29:1050–1073. doi: 10.1039/c2np20019h. [DOI] [PubMed] [Google Scholar]
- 9.Whicher JR, Dutta S, Hansen DA, Hale WA, Chemler JA, Dosey AM, Narayan ARH, Hakansson K, Sherman DH, Smith JL, Skiniotis G. Structural rearrangements of a polyketide synthase module during its catalytic cycle. Nature. 2014;510:560–564. doi: 10.1038/nature13409. [DOI] [PMC free article] [PubMed] [Google Scholar]
- 10.Zheng JT, Taylor CA, Piasecki SK, Keatinge-Clay AT. Structural and Functional Analysis of A Type Ketoreductases from the Amphotericin Modular Polyketide Synthase. Structure. 2010;18:913–922. doi: 10.1016/j.str.2010.04.015. [DOI] [PubMed] [Google Scholar]
- 11.Zheng JT, Piasecki SK, Keatinge-Clay AT. Structural Studies of an A2-Type Modular Polyketide Synthase Ketoreductase Reveal Features Controlling alpha-Substituent Stereochemistry. Acs Chem Biol. 2013;8:1964–1971. doi: 10.1021/cb400161g. [DOI] [PMC free article] [PubMed] [Google Scholar]
- 12.Anand S, Mohanty D. Modeling holo-ACP:DH and holo ACP:KR complexes of modular polyketide synthases: a docking and molecular dynamics study. BMC Structural Biology. 2012;12:10. doi: 10.1186/1472-6807-12-10. [DOI] [PMC free article] [PubMed] [Google Scholar]
- 13.Siskos AP, Baerga-Ortiz A, Bali S, Stein V, Mamdani H, Spiteller D, Popovic B, Spencer JB, Staunton J, Weissman KJ, Leadlay PF. Molecular Basis of Celmer’s Rules: Stereochemistry of Catalysis by Isolated Ketoreductase Domains from Modular Polyketide Synthases, Chem. Biol. 2005;12:1145–1153. doi: 10.1016/j.chembiol.2005.08.017. [DOI] [PubMed] [Google Scholar]
- 14.Piasecki SK, Taylor CA, Detelich JF, Liu J, Zheng J, Komsoukaniants A, Siegel DR, Keatinge-Clay AT. Employing Modular Polyketide Synthase Ketoreductases as Biocatalysts in the Preparative Chemoenzymatic Syntheses of Diketide Chiral Building Blocks. Chem Biol. 2011;18:1331–1340. doi: 10.1016/j.chembiol.2011.07.021. [DOI] [PubMed] [Google Scholar]
- 15.Jorgensen WL, Chandrasekhar J, Madura JD, Impey RW, Klein ML. Comparison of Simple Potential Functions for Simulating Liquid Water. J Chem Phys. 1983;79:926–935. [Google Scholar]
- 16.Ruymgaart AP, Cardenas AE, Elber R. MOIL opt: Energy-Conserving Molecular Dynamics on a GPU/CPU System. Journal of Chemical Theory and Computation. 2011;7:3072–3082. doi: 10.1021/ct200360f. [DOI] [PMC free article] [PubMed] [Google Scholar]
- 17.Essmann U, Perera L, Berkowitz ML, Darden T, Lee H, Pedersen LG. A Smooth Particle Mesh Ewald Method. J Chem Phys. 1995;103:8577–8593. [Google Scholar]
- 18.Ryckaert JP, Ciccotti G, Berendsen HJC. Numerical Integration of Cartesian Equations of Motion of a System with Constraints-Molecular-Dynamics of N-Alkanes. J Comput Phys. 1977;23:327–341. [Google Scholar]
- 19.Weinbach Y, Elber R. Revisiting and parallelizing SHAKE. J Comput Phys. 2005;209:193–206. [Google Scholar]
- 20.Ruymgaart AP, Elber R. Revisiting Molecular-Dynamics on a CPU/GPU System: Water Kernel and SHAKE Parallelization. Journal of Chemical Theory and Computation. 2012;8:4624–4636. doi: 10.1021/ct300324k. [DOI] [PMC free article] [PubMed] [Google Scholar]
- 21.Heyes DM. Molecular Dynamics at Constant Pressure and Temperature. Chem Phys. 1983;82:285–301. [Google Scholar]
- 22.Tuckerman M, Berne BJ, Martyna GJ. Reversible Multiple Time Scale Molecular-Dynamics. Journal of Chemical Physics. 1992;97:1990–2001. [Google Scholar]
- 23.Kaminski GA, Friesner RA, Tirado-Rives J, Jorgensen WL. Evaluation and reparametrization of the OPLS-AA force field for proteins via comparison with accurate quantum chemical calculations on peptides. J Phys Chem B. 2001;105:6474–6487. [Google Scholar]
- 24.Kabsch W. Solution for Best Rotation to Relate 2 Sets of Vectors. Acta Crystallogr A. 1976;32:922–923. [Google Scholar]
- 25.Warshel A. Electrostatic origin of the catalytic power of enzymes and the role of preorganized active sites. J Biol Chem. 1998;273:27035–27038. doi: 10.1074/jbc.273.42.27035. [DOI] [PubMed] [Google Scholar]
- 26.Görbitz CH. Hydrogen-bond Distances and Angles in the Structures of Amino Acids and Peptides. Acta Cryst. 1989;B45:390–395. [Google Scholar]
Associated Data
This section collects any data citations, data availability statements, or supplementary materials included in this article.