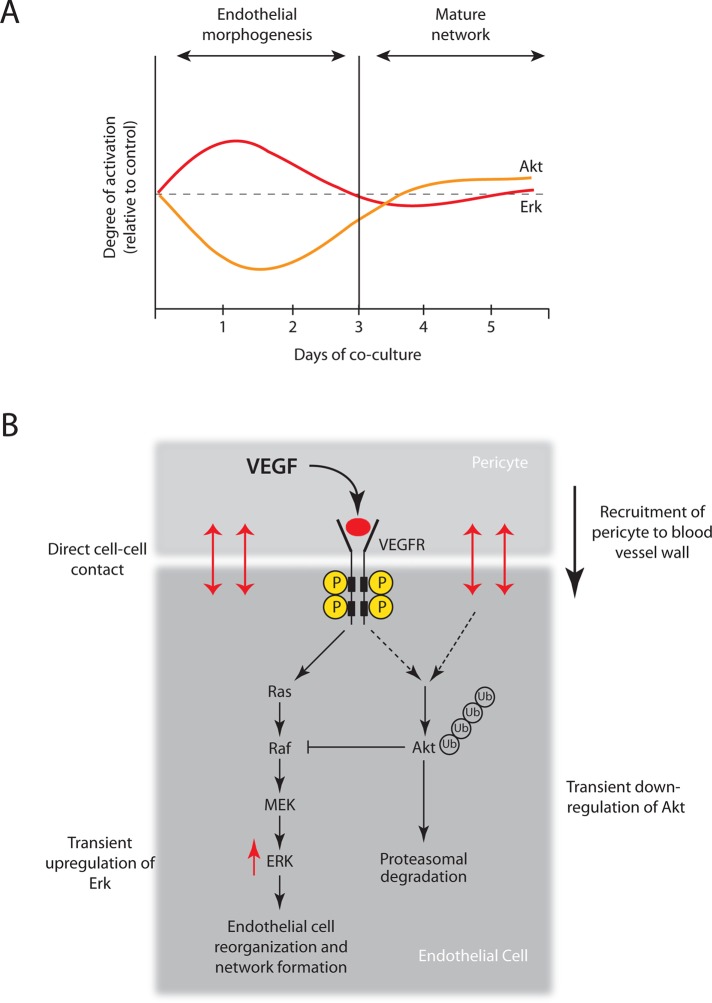
This study examines the temporal regulation of Akt in endothelial cells during formation of capillary-like networks induced by cell–cell contact with vascular smooth muscle cells (vSMCs) and vSMC-associated VEGF. Heterotypic cell–cell interaction between mural and endothelial cells alters Akt kinase protein dynamics, which regulates angiogenesis.
Abstract
The formation of new blood vessels by sprouting angiogenesis is tightly regulated by contextual cues that affect angiogeneic growth factor signaling. Both constitutive activation and loss of Akt kinase activity in endothelial cells impair angiogenesis, suggesting that Akt dynamics mediates contextual microenvironmental regulation. We explored the temporal regulation of Akt in endothelial cells during formation of capillary-like networks induced by cell–cell contact with vascular smooth muscle cells (vSMCs) and vSMC-associated VEGF. Expression of constitutively active Akt1 strongly inhibited network formation, whereas hemiphosphorylated Akt1 epi-alleles with reduced kinase activity had an intermediate inhibitory effect. Conversely, inhibition of Akt signaling did not affect endothelial cell migration or morphogenesis in vSMC cocultures that generate capillary-like structures. We found that endothelial Akt activity is transiently blocked by proteasomal degradation in the presence of SMCs during the initial phase of capillary-like structure formation. Suppressed Akt activity corresponded to the increased endothelial MAP kinase signaling that was required for angiogenic endothelial morphogenesis. These results reveal a regulatory principle by which cellular context regulates Akt protein dynamics, which determines MAP kinase signaling thresholds necessary drive a morphogenetic program during angiogenesis.
INTRODUCTION
Formation of new blood vessels from existing vasculature is a multistep process that is tightly controlled by growth factor signaling pathways and heterotypic cell–cell interactions with mural/pericyte cells (Lee et al., 2007). Sprouting angiogenesis is regulated by tissue oxygen demand via vascular endothelial growth factor (VEGF) secretion from cells in the hypoxic tissue (Tandara and Mustoe, 2004; Hickey and Simon, 2006). VEGF induces a morphogenic response in endothelial cells (ECs) lining the blood vessel wall, stimulating invasive sprout formation into the hypoxic tissue (Hoeben et al., 2004).
VEGF receptor (VEGFR) signaling in ECs activates the phosphoinositide 3-kinase (PI3K)–Akt pathway (Abid et al., 2004; Karar and Maity, 2011). Akt activation is closely associated with multiple VEGF-induced EC functions, including enhanced mitogenic, morphogenic, metabolic, and survival activity (Liao and Hung, 2010). Lack of endothelial Akt expression leads to reduced vascularization, impaired vessel maturation, and increased vascular permeability (Adini et al., 2003; Chen et al., 2005). Conversely, sustained endothelial Akt activation induces vascular malformations and pathological angiogenesis (Sun et al., 2005). This indicates that Akt activity in angiogenesis is dynamic and regulated by contextual cues.
The goal of this study is to examine the temporal regulation of Akt activity in endothelial cells during the migratory and morphogeneic phase of angiogenesis. We applied a VEGF-dependent coculture model of ECs and vascular smooth muscle cells (vSMCs; Evensen et al., 2009) and a phosphoflow cytometry approach to assess endothelial Akt protein dynamics regulated by heterotypic cell–cell interactions.
RESULTS
Constitutive activation of Akt in ECs inhibits capillary-like network formation
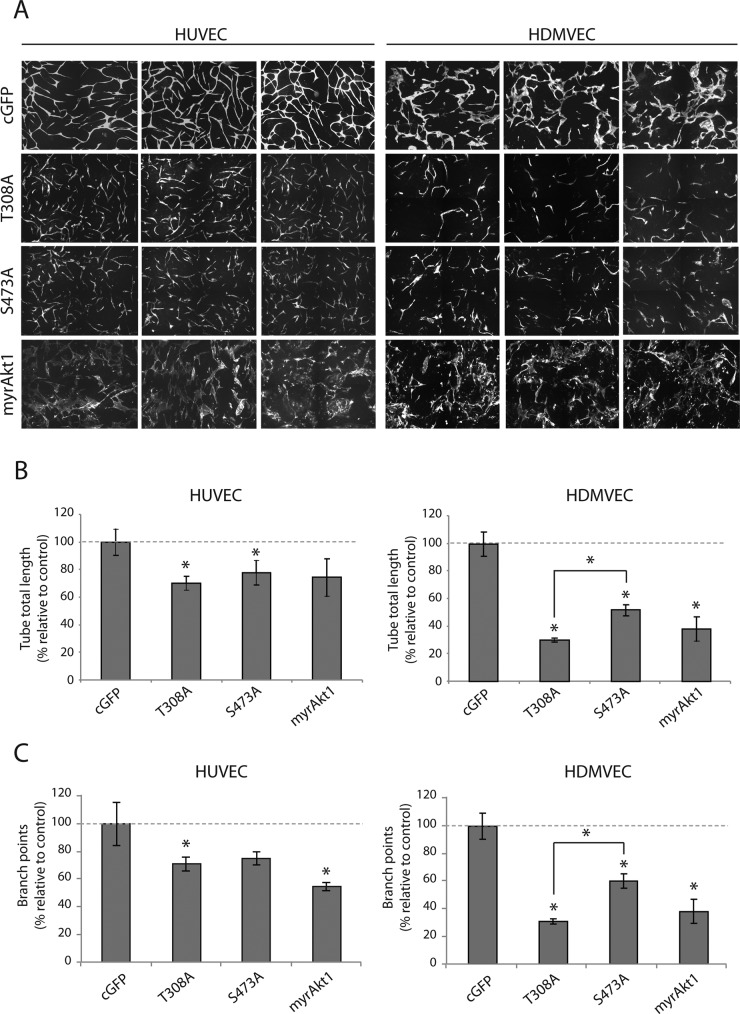
We considered that Akt activity dynamics could reflect changes in contextual EC signaling that are necessary for the various cell functions required during neovascular formation. Coculture of primary human ECs with vSMCs was previously shown to induce self-assembly of a network of capillary-like structures in vitro that recapitulates EC migration, morphogenesis, and lumen formation that is dependent on heterotypic EC:vSMC cell–cell contact, vSMC-derived VEGF164, and endothelial VEGFR2 signaling (Evensen et al., 2009, 2010, 2013a, b). We investigated the effect of graded, constitutive Akt1 kinase activation in ECs on the formation of capillary-like networks. We expressed constitutively active myristolated Akt1 (myrAkt1) and phosphorylation-site alanine-substitution mutants (myrAkt1(T308A), myrAkt1(S473A)) in primary human dermal microvascular endothelial cells (HDMVECs) and human umbilical vein endothelial cells (HUVECs). The phosphorylation profiles of the Akt1 mutant constructs have been described previously (Hellesoy et al., 2014). Internal ribosome entry site (IRES)–green fluorescent protein (GFP) retroviral vector–transduced endothelial cells served as control cells. HDMVECs and HUVECs were cocultured with human pulmonary artery smooth muscle cells (PaSMCs) for 5 d, and capillary-like network formation was quantified by live-cell fluorescence microscopy as previously described (Evensen et al., 2013a). Of interest, we found that constitutively active myrAkt1 expression in both HUVECs and HDMVECs blocked EC network formation (Figure 1A). Expression of hemiphosphorylated myrAkt1(T308A) and myrAkt1(S473A) resulted in intermediate inhibition, with significantly reduced tube total length (Figure 1B) and fewer branch points (Figure 1C) than in controls. We did not observe significant differences between the two phosphorylation-site mutants in HUVECs; however, in HDMVECs, the myrAkt1(T308A) mutant gave a significantly more disrupted phenotype (Figure 1, B and C, right). Western analysis confirmed the expected pAkt level in myrAkt1-expressing cells (Supplemental Figure S2). Collectively these results show that constitutive Akt1 activity inhibits EC network formation in an Akt kinase-dependent manner.
FIGURE 1:
Constitutive Akt1 activity blocks capillary-like network formation. HUVECs and HDMVECs expressing mutant myrAkt1 constructs were grown in coculture with PaSMCs. (A) Fluorescence microscopy images show that control cells of both cell types form interconnected branched capillary–like networks. Constitutive activation of Akt1 in ECs inhibited network formation in a grade-dependent manner. (B) Quantification of network formation confirmed that HUVECs and HDMVECs expressing hemiphosphorylated Akt1 mutants had a significantly shorter tube total length than control cells (set to 100%). (C) Networks formed by Akt1 mutant cells also had a significantly lower number of branch points than control cells. Asterisk indicates statistically significant difference from control (set to 100%). *p < 0.05, min n = 9, max n = 14.
Inhibition of Akt does not affect capillary-like network formation
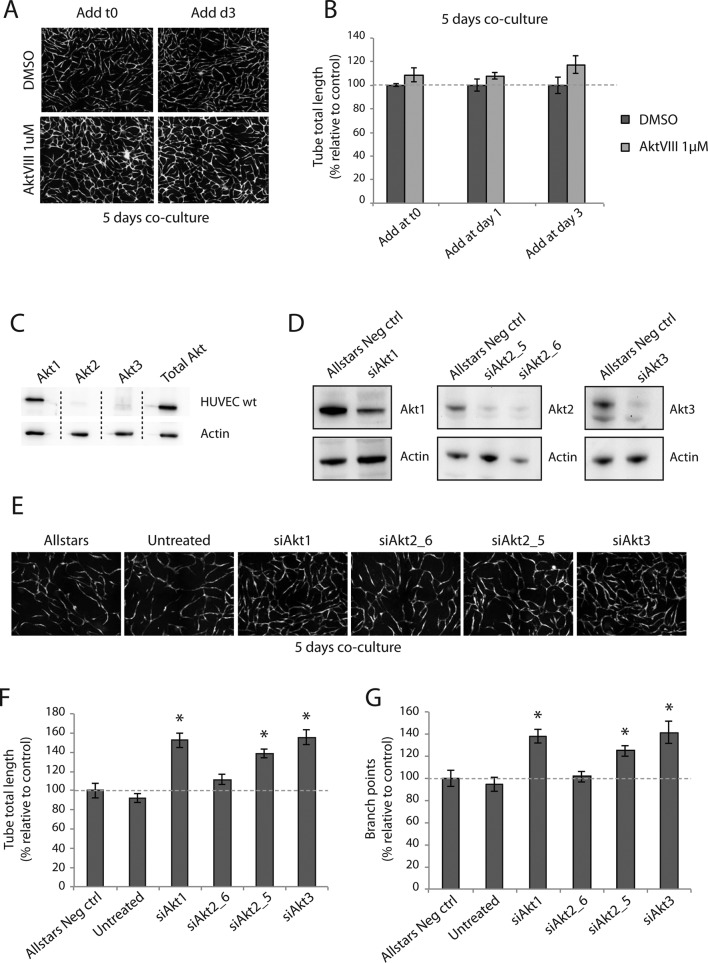
It was previously shown that EC morphogenesis and migration in coculture occurs during a 72-h period, followed by maturation of the capillary-like network (Evensen et al., 2009). To investigate the role of Akt1 in network formation, we treated cocultures with the selective small-molecule allosteric Akt inhibitor AktVIII (1 μM) at cell seeding day 1 or 3 and imaged at day 5, when a mature capillary-like network is formed. Surprisingly, treatment with AktVIII (1 μM) did not inhibit network formation at any time point. Indeed, cocultures treated with AktVIII appeared highly branched (Figure 2A). Quantification of networks confirmed that inhibition of Akt with AktVIII had no significant effects on network formation (Figure 2B). Western blot analysis of pAkt levels in AktVIII-treated HUVECs confirmed that pAkt levels were strongly reduced (Supplemental Figure S1). This suggests that activation of Akt is not necessary for capillary-like network formation in this in vitro model.
FIGURE 2:
Inhibition of Akt does not inhibit capillary-like network formation. Cocultures of HUVECs and PaSMCs were treated with the Akt inhibitor AktVIII at time zero and days 1 and 3 and imaged at day 5. Inhibitor-treated cocultures were morphologically similar to control cells (A), and the tube total length was not significantly different from controls (B). Akt isoform expression levels of HUVECs were examined by Western blot. Akt1 was the predominantly expressed isoform, whereas only small amounts of Akt2 and Akt3 were detected (C). All Akt isoforms were knocked down by siRNA (D) and grown in coculture with PaSMCs for 5 d. Western blot exposures were optimized to show relative differences from control. Cultures were imaged with fluorescence microscopy (E), and network formation was quantified. Tube total length (F) and number of branch points (G) were significantly higher in networks formed by Akt1, 2 (except siAkt2_6), and 3 knockouts than with control. Asterisk indicates statistically significant differences from control (set to 100%). *p < 0.05, min n = 9, max n = 10.
Akt1 is reported to be the predominantly expressed isoform in ECs (Chen et al., 2005). Analysis of the expression level of the three Akt isoforms in HUVECs confirmed that Akt1 was the predominantly expressed isoform, whereas low levels of Akt2 and Akt3 were also detected (Figure 2C). We assessed small interfering RNAs (siRNAs) against all three Akt isoforms in HUVECs (Figure 2D). To our surprise, we found that knockdown of Akt1, 2, and 3 in HUVECs led to the formation of more extensively branched networks (Figure 2E). Quantification of images confirmed that capillary-like networks formed by Akt1, 2, and 3–knockdown HUVECs had a significantly higher tube total length (Figure 2F) and significantly higher number of branch points (Figure 2G) than control HUVECs. These results indicate that knockdown of the individual Akt isoforms leads to enhanced EC branching.
Activated Akt is down-regulated in ECs cocultured with vSMCs
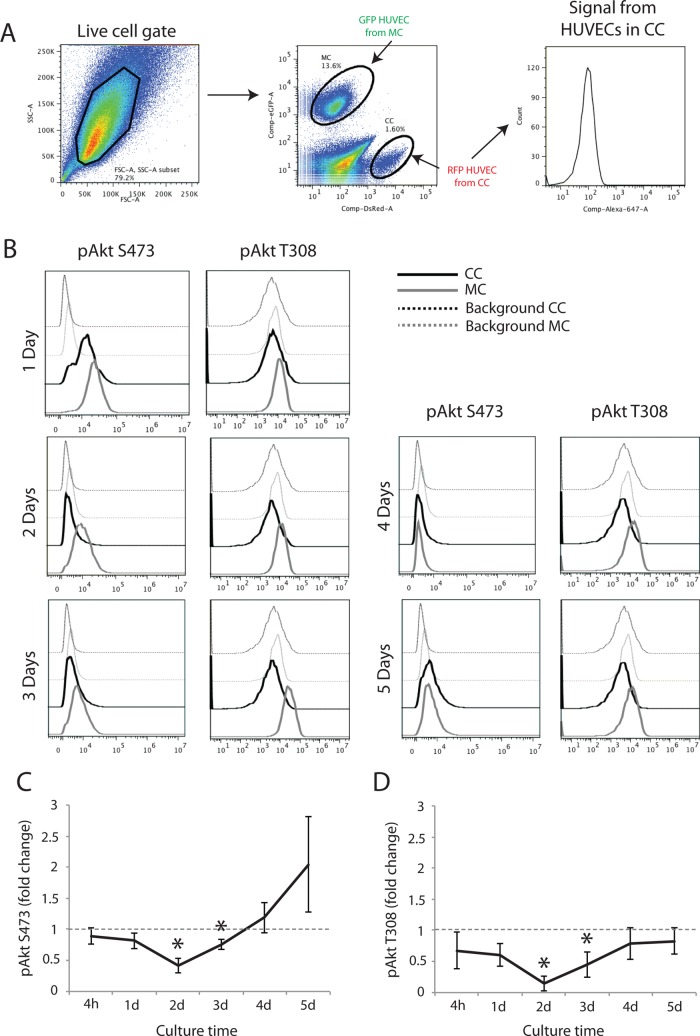
The foregoing results suggest that Akt activity may serve an important regulatory role during EC angiogeneic morphogenesis. To confirm this, we investigated the activity of endogenous Akt in HUVECs during coculture with wild-type PaSMCs. We cocultured RFP-expressing HUVECs with PaSMCs and GFP–expressing HUVECs in monoculture. Both cultures were split and fixed at different time points, from 4 h to 5 d postseeding. Fixed cells from monocultures and cocultures were mixed and stained with pAkt (S473 and T308) antibodies and analyzed by flow cytometry. By gating for red fluorescent protein (RFP)– or GFP-expressing cells, Akt activity in HUVECs from coculture (RFP) or monoculture (GFP) could be selectively analyzed (Figure 3A). Akt phosphorylation in cocultured RFP/HUVECs was compared with the activity in monocultured GFP/HUVECs at the different time points. We found that Akt phosphorylation at S473 and T308 was reduced in HUVECs cocultured with PaSMCs compared with monocultured HUVECs during the first 3 d of culture (Figure 3B). Quantification of the geometric mean of relative fluorescence intensity from three to six independent experiments confirmed down-regulation of phosphorylation of both S473 and T308 during the first 3 d of coculture as compared with monocultured HUVECs (control set to 1; Figure 3, C and D, respectively). Phosphorylation of the Akt S473 and T308 phosphorylation sites both similarly decrease over 72 h during the most active network formation phase. Of note, pS473 appears to increase at days 4 and 5, whereas pT308 remains unchanged. These results indicate that Akt1 is inactivated during capillary-like formation in coculture with PaSMCs, and thus Akt1 activity is not involved in regulating endothelial branching morphogenesis in this in vitro model.
FIGURE 3:
Activated Akt is down-regulated in ECs cocultured with vSMCs. To compare endogenous intracellular signaling in HUVECs from monocultures and cocultures, RFP- expressing HUVECs were cocultured, and GFP-expressing HUVECs were grown in monoculture. After fixation, monocultures and cocultures were mixed and stained for flow cytometric analysis. By gating for RFP- and GFP-expressing HUVECs, intracellular signaling in separate populations could be performed (A). Phosphorylation of both pS473 and pT308 of Akt1 was found to be reduced during the initial 3 d of cocultured compared with monocultured HUVECs (B), as confirmed by quantification of relative geometric mean of fluorescence from three to eight individual experiments (C and D, respectively). Asterisk indicates statistically significant differences from control (set to 1). *p < 0.05, min n = 3, max n = 8.
Akt is degraded by ubiquitin-dependent proteolysis in ECs cocultured with vSMCs
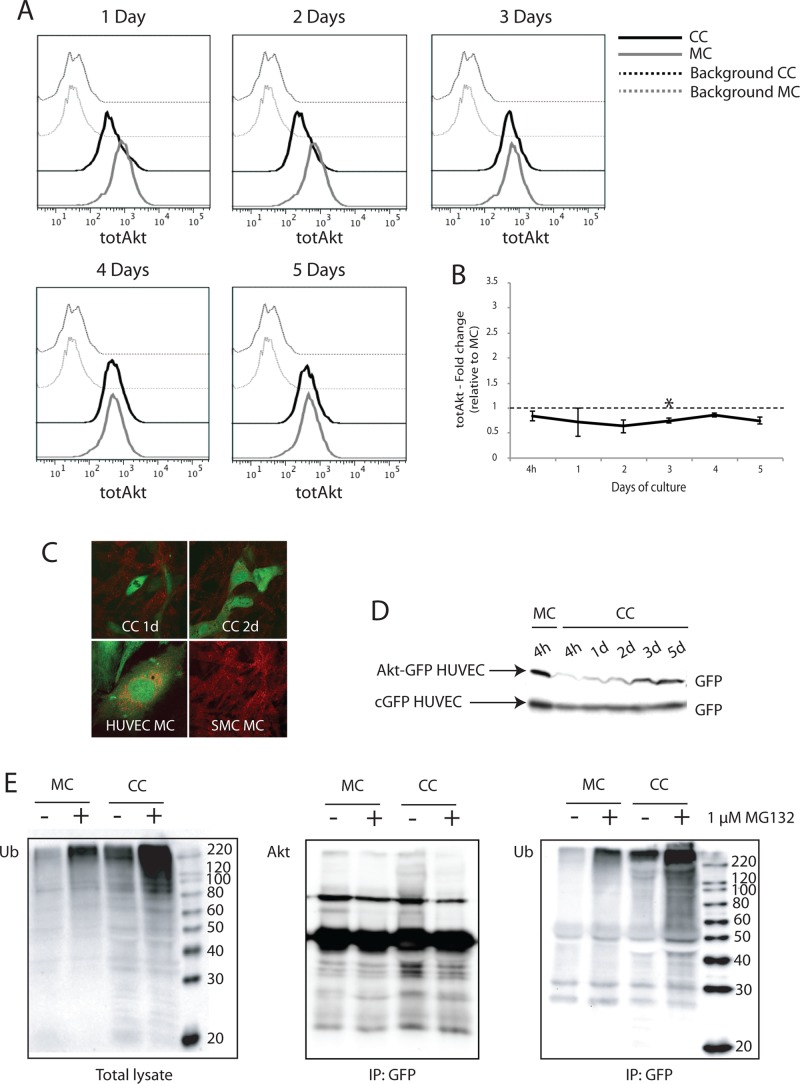
Because Akt phosphorylation was found to be down-regulated in HUVECs cocultured with PaSMCs, we investigated the total Akt protein level in HUVECs from monocultures and cocultures by flow cytometry. We found down-regulation of total Akt protein in cocultured HUVECs compared with monocultured HUVECs correlating with the time of pAkt down-regulation (Figure 4A). Quantification of relative geometric mean of fluorescence intensity from three independent experiments confirmed down-regulation of total Akt protein during the first 2–3 d of coculture (Figure 4B). Confocal microscopy images of cocultures with cyan-green fluorescent protein (cGFP)-expressing HUVEC and wild-type PaSMCs at 1 and 2 d showed that Akt (red stain) did not colocalize with cGFP HUVECs in coculture, although monocultured HUVECs and PaSMCs both stained positive for Akt (Figure 4C), demonstrating that endogenous Akt protein disappeared from cocultured HUVECs already at day 1. To examine the kinetics of total Akt levels in cocultured HUVECs by Western blot, we stably expressed an Akt-GFP fusion protein in HUVECs before seeding the cells in coculture. The Akt level in these cells was measured at 4 h and up to 5 d in total lysates by probing Western blots with an anti-GFP antibody. We found that the Akt-GFP protein was not detectable in cocultured HUVECs already after 4 h of culture and remained low until day 2, then recovering to monoculture-Akt levels. As a control, cGFP HUVECs were used, and we showed that HUVECs have a stable cGFP expression throughout the 5 d of coculture with PaSMCs (Figure 4D).
FIGURE 4:
Akt is degraded by ubiquitin-dependent proteolysis in ECs cocultured with vSMCs. Total endogenous Akt level in monocultured and cocultured HUVECs was investigated by two-color flow cytometry. (A) In cocultures, total Akt was reduced in HUVECs during the first 3 d of culture. (B) Quantification of geometric mean of fluorescence from two to four independent experiments confirmed that total Akt levels were reduced relative to monocultured HUVECs (set as 1). (C) Top, endogenous Akt expression in cocultured HUVECs was also examined by confocal microscopy. Bottom, Akt (red) did not colocalize with GFP-expressing HUVECs cocultured for 1 and 2 days with PaSMCs. Monocultured HUVECs and PaSMCs both stained positive for Akt. (D) Akt expression in cocultured HUVECs was also examined by Western blot. HUVECs were transduced with an Akt-GFP fusion protein and grown in coculture. The level of GFP expression was examined in total lysates from cocultures at 4 h up to 5 d. cGFP-expressing HUVECs were used as control. Whereas Akt-GFP expression level was reduced in cocultured HUVECs during the initial 2 d of culture, cGFP expression level remained stable. (E) To investigate proteasomal degradation, cocultures and monocultures of Akt-GFP–expressing HUVECs were treated with the proteasomal inhibitor MG132 for 24 h. Akt-GFP was immunoprecipitated from total lysates using a GFP antibody. (Left) Polyubiquitinated proteins accumulated in total lysates after MG132-treatment. Postimmunoprecipitation, blots were probed with antibodies for Akt (middle) and ubiquitin (right). Cocultured HUVECs displayed increased ubiquitination of Akt-GFP compared with monocultured HUVECs both in MG132-treated and untreated samples. Asterisk indicates statistically significant differences from control (set to 1). *p < 0.05, min n = 2, max n = 4.
We examined whether the loss of Akt protein within the first 4 h of coculture was due to proteasomal degradation. We treated cocultured and monocultured HUVECs expressing Akt-GFP fusion protein with the proteasomal inhibitor MG132 for 24 h. As expected, total ubiquitinated protein levels increased in both monocultures and cocultures treated with a proteasomal inhibitor (Figure 4E, left). Ubiquitinated Akt-GFP protein was detected in both untreated and treated cocultured HUVECs (Figure 4E, right). These results indicate that Akt-GFP is targeted by polyubiquitination for proteasomal degradation in endothelial cells when cocultured with vSMCs.
Mitogen-activated protein kinase signaling is required for capillary-like network formation
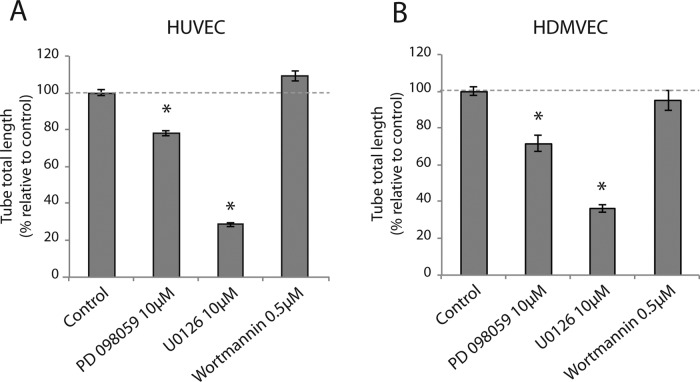
Our results indicated that the formation of VEGF-dependent endothelial cell networks in the presence of mural cells requires Akt down-regulation. Hence heterotypic HUVEC–PaSMC interaction could potentiate signaling via alternative pathways. VEGFR2 activates the mitogen-activated protein (MAP) kinase signaling pathway (Rousseau et al., 1997) and capillary sprouting by HUVECs in vitro and has been shown to be dependent on activation of extracellular regulated kinase (Erk1/2; Zhou et al., 2007). Furthermore, both the PI3K-Akt and MAP kinase pathways are activated during angiogenesis in vivo (Zhou et al., 2007; Wang et al., 2013). Therefore we investigated the effect of PI3K-Akt and MAP kinase pathway inhibitors on EC-SMV cocultures. We seeded cocultures of HUVECs and HDMVECs in the presence of inhibitors of PI3K (wortmannin) and MEK1/2 (PD-98059 and U0126). Cultures were grown for 3 d, and network formation was quantified. Congruent with our earlier results, we found that PI3K inhibition did not affect network formation (Figure 5, A and B, respectively). However, both PD-98059 and U0126 strongly inhibited network formation in HUVECs and HDMVECs. Inhibition of pAkt and pErk levels by the cognate inhibitors is shown in Supplemental Figure S1. These results indicate that the MAP kinase signaling pathway is essential for capillary-like network formation in the coculture setting.
FIGURE 5:
MAP kinase signaling, but not PI3K, is required for capillary-like network formation. Cocultures of HUVECs (A) and HDMVECs (B) with PaSMCs were treated with the PI3Kinase inhibitor wortmannin (0.5 μM), the MEK1 inhibitor PD-98059 (10 μM), and the MEK1/2 inhibitor U0126 (10 μM) for 3 d. Cultures were imaged by fluorescence microscopy, and tube total length was quantified. Results are represented as fold change relative to control. PD-98059 and U0126 inhibited network formation significantly in both cell types, whereas wortmannin showed no significant inhibitory effect. Asterisk indicates significant differences from control (set to 100%). *p < 0.05, n = 5.
Erk phosphorylation is up-regulated in ECs cocultured with vSMCs
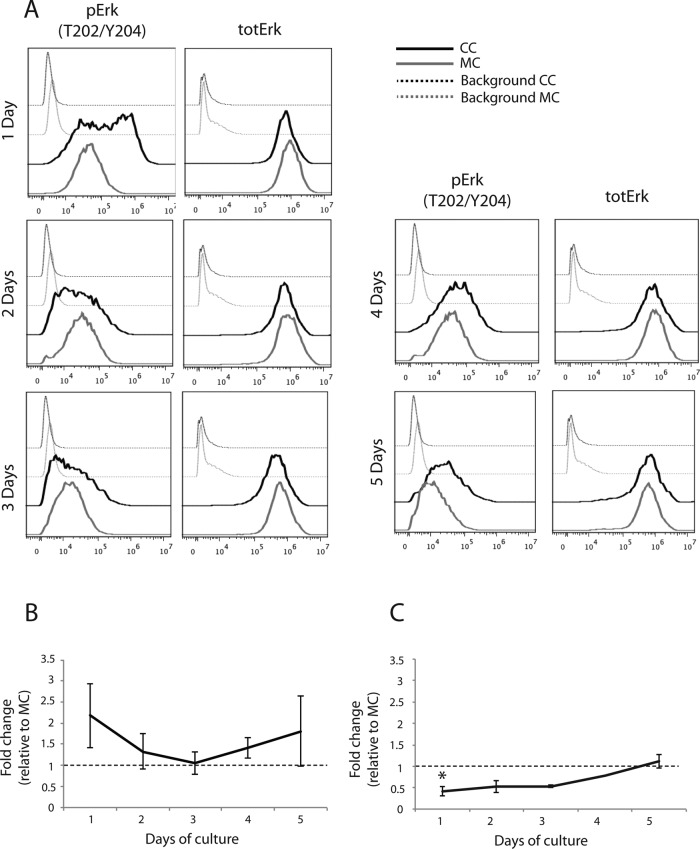
Because treatment of cocultures with small-molecule inhibitors will inhibit signaling in both ECs and vSMCs, we measured MAP kinase signaling in HUVECs during coculture with PaSMCs by flow cytometry. We found that Erk phosphorylation was strongly up-regulated (Figure 6A). Erk activation in HUVECs during the initial 2 d of coculture with vSMCs was higher than in monocultures but similar to monoculture levels at days 3 and 4, as shown by quantification of the relative geometric mean of fluorescence intensity (Figure 6B). Total Erk expression in cocultures was not significantly different from that in monocultured HUVECs after day 1. These results show that the strong increase in Erk phosphorylation mirrored Akt down-regulation in these cells and that Akt recovery coincided with pErk normalization. These results support the notion that the Akt and Erk pathways crosstalk during endothelial capillary-like network formation.
FIGURE 6:
Erk phosphorylation is up-regulated in ECs cocultured with vSMCs. We used three-color flow cytometry to investigate phosphorylation of Erk and total Erk expression in cocultured HUVECs. Erk phosphorylation was strongly up-regulated in the initial 2 d of coculture compared with monocultured HUVECs (A), as confirmed by quantification of relative geometric mean of fluorescence from two to four individual experiments (B). Total Erk was slightly reduced in cocultured HUVECs during the initial 3 d of coculture compared with monocultured HUVECs, although this reduction was only significant at 24 h (A, C). Asterisk indicates statistically significant differences from control (set to 1). *p < 0.05, min n = 2–4, except for C, 4 d, for which n = 1.
MAP kinase pathway activation is essential for capillary-like network formation
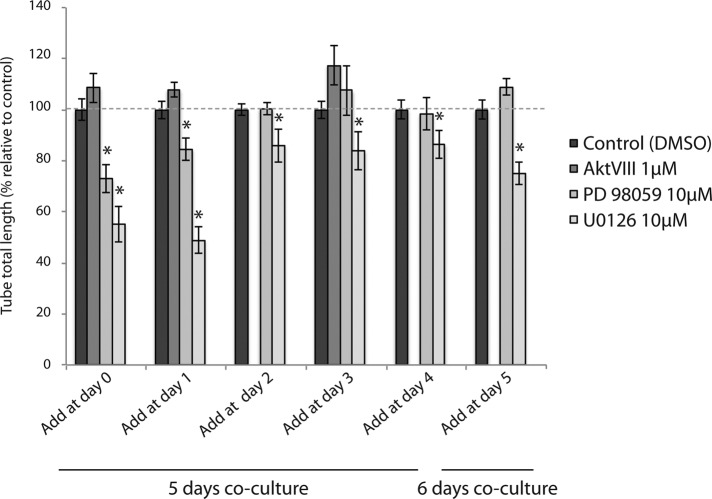
Our results indicated a dynamic reciprocity in endothelial Akt- and Erk-mediated signaling during capillary-like network formation. We therefore examined the effect of treatment of cocultures with inhibitors at different time points in order to map the requirement for Akt and Erk signaling at different stages of network formation. Cocultures of HUVECs and PaSMCs were treated with Akt inhibitor (AktVIII), MEK1 inhibitor (PD-98059), and MEK1/2 inhibitor (U0126) from time zero and up to 5 d. AktVIII treatment was only assessed at days 0, 1, and 3. We found that addition of the Akt inhibitor did not inhibit network formation at any of the time points assessed (Figure 7). Inhibition of MEK1 by PD-98059 had an inhibitory effect when added at days 0 and 1 but did not affect network formation when added at later time points, indicating that MEK1 is not required for maintaining an EC network once it is formed. However, the dual MEK1/MEK2 inhibitor U0126 had a significant inhibitory effect when added at all time points, although the degree of inhibition decreased dramatically after day 1. The inhibitory effect of U0126 when added at day 5 shows that this inhibitor acts as a vascular disruptive agent, indicating that the MAP kinase signaling pathway is also required for the persistence of a stable EC network.
FIGURE 7:
MAP kinase signaling is required for early capillary-like network formation. Cocultures of HUVECs with PaSMCs were treated with the MEK1 inhibitor PD-98059 (10 μM), the MEK1/2 inhibitor U0126 (10 μM), and the Akt inhibitor AktVIII (1 μM). Inhibitors were added at the indicated time points from days 0–5, and cultures were imaged for network quantification at day 5 or 6. PD 98059 and U0126 had a significant inhibitory effect when added at all time points. AktVIII addition was only assessed at days 0, 1, and 3. AktVIII did not affect network formation at any time point. Asterisk indicates significant differences from control (set to 100%). *p < 0.05, min n = 5, max n = 10.
Constitutive active PI3K, but not B-Raf, interferes with capillary-like network formation
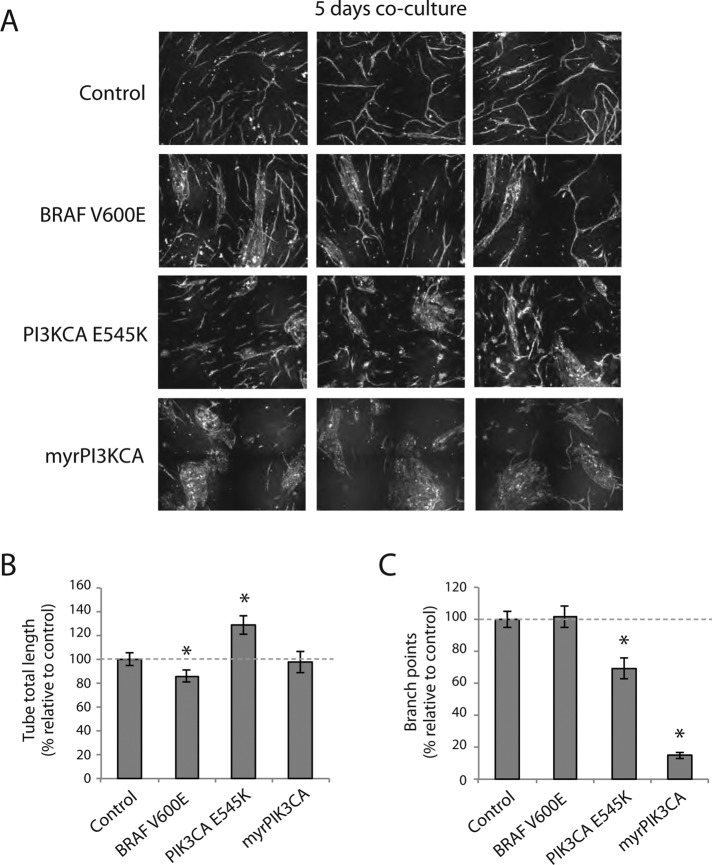
To further elucidate the reciprocal regulatory role of the PI3K-Akt and MAP kinase signaling pathways in capillary-like network formation, we expressed constitutively active PIK3CA (myrPIK3CA and PIK3CA E545K) and oncogenic B-Raf mutant (BRAF V600E). Constitutively active myrPI3KCA expression in HUVECs formed large aggregates, and we observed little or no indication of EC elongation (Figure 8A). Of note, PI3KCA E545K–expressing ECs displayed a different phenotype than unbranched, elongated ECs (Figure 8, B and C). BRAF V600E expression formed elongated, branched networks without significant changes in branch point number (Figure 8C). Hence constitutive activation of PI3K-Akt signaling blocks capillary-network formation.
FIGURE 8:
Constitutive activation of PI3K-Akt and MAP kinase signaling pathways interferes with capillary-like network formation. (A) HUVECs expressing B-Raf V600E, myrAkt2, myrAkt3, PI3CA E545K, and myrPI3CA were cocultured and imaged after 5 d with fluorescence microscopy. (B) Quantification of network formation showed that B-Raf V600E- and myrAkt2-expressing HUVECs formed networks with significantly shorter tube total length than control, whereas networks formed by PI3CA E545K–expressing HUVECs had a significantly higher tube total length than controls. (C) The relative number of branch points in networks formed by all mutants except B-Raf V600E–expressing HUVECs was significantly less than in networks formed by control cells. Asterisk indicates statistically significant difference from control (set to 100%). *p < 0.01, min n = 20, max n = 29.
DISCUSSION
Akt is a key intracellular signaling node integrating multiple vital cellular processes, including cell survival, proliferation, migration, metabolism, and translation (Whiteman et al., 2002; Altomare and Testa, 2005; Stambolic and Woodgett, 2006). Akt inhibition interferes with vascular growth and leads to abnormal vessel function (Adini et al., 2003; Chen et al., 2005), whereas constitutive Akt signaling in ECs induces severe vascular pathologies (Sun et al., 2005). Therefore temporospatial Akt regulation is considered essential for normal angiogenesis (Sun et al., 2005). However, the timing and nature of this regulation are not known. Our results reveal that endothelial Akt signaling dynamics during VEGF-dependent endothelial migration and branching morphogenesis is governed by heterotypic cell–cell contact with mural cells (Figure 9A). We propose a model in which EC–mural cell heterotypic contact activates an endothelial E3 ubiquitin ligase that targets Akt for proteasomal degradation, potentiating Erk activation necessary for endothelial migration and capillary-like network formation (Figure 9B).
FIGURE 9:
Cell-cell–mediated Akt dynamics regulates MAP kinase signaling thresholds necessary for capillary-like network formation. (A) Dynamic reciprocity of Akt and Erk activity in ECs cocultured with vSMCs correlates with endothelial migration and branching morphogenesis. (B) We propose that Akt down-regulation and concurrent Erk up-regulation are induced by direct cell–cell contact between endothelial and mural cells through a VEGFR2-dependent mechanism. Direct heterotypic cell–cell contact activates an unknown endothelial E3 ubiquitin ligase that targets Akt for proteasomal degradation. Mural cell–induced Akt degradation potentiates the Erk activation that is necessary for endothelial migration and capillary-like network formation.
VEGF receptor signaling regulates multiple endothelial functions, including EC survival, proliferation, migration, and vascular permeability (Zachary, 2003). VEGFR2 activates both the PI3K-Akt and MAP kinase pathways, and inhibition of either severely inhibits neovascularization in vivo (Yang et al., 2009b). Previous studies reported that Akt activation inhibits the Erk activity (Rommel et al., 1999; Reusch et al., 2001; Moelling et al., 2002; McCubrey et al., 2007; Huang et al., 2012). PI3K/Akt–MAP kinase signaling crosstalk is implicated in arterial vein specification (Hong et al., 2006). Akt regulates modulation of Raf signaling specificity through inhibitory phosphorylation of the kinase regulatory domain (Zimmermann and Moelling, 1999; Guan et al., 2000; Reusch et al., 2001). Conversely, the constitutively active BRAFV600E mutant has also been shown to be a strong negative regulator of the Akt pathway (Chen et al., 2012). Ren et al. (2010) found that arteriogenesis in mice and zebrafish was stimulated by down-regulation of PI3K activity, suppression of Akt1 (but not Akt2), or expression of a constitutively active Erk1/2 construct in ECs. They propose a model in which VEGF stimulation leads to partial inhibition of PI3K signaling, which activates the MAP kinase signaling pathway and suppresses Akt1 activity, thereby promoting arteriogenesis (Ren et al., 2010). Congruently, Akt1 and Erk exhibited dynamic reciprocity during capillary-like network formation in vitro (Figure 9A). Enhanced endothelial Erk activation in response to coculture with mural cells coincided with both reduced Akt phosphorylation and total Akt protein levels and was required for capillary-like network formation. Subsequent recovery of Akt protein levels correlated with normalized MAP kinase signaling and stabilization of branched endothelial cells.
Strikingly, our results reveal that constitutively active Akt1 mutant expression profoundly inhibited capillary-like formation. This shows that Akt1 is not an unconditionally proangiogenic molecule and that Akt activity dynamics is critical to normal multistep branching capillary formation. Our results indicate that constitutively active Akt1 disrupts the normal network formation not by increased, uncontrolled angiogenesis (Sun et al., 2005) but instead by affecting capillary branching. Indeed, increased vascular branching was previously observed in tumor-bearing mice after genetic and pharmacological inhibition of the p110α subunit of PI3K (Soler et al., 2013) and was also observed in tumors implanted into Akt1-knockout mice (Chen et al., 2005). A recent study also showed that endothelial myrAkt1 expression drives hemangioma formation in vivo (Phung et al., 2015).
We demonstrate that Akt signaling dynamics is accomplished by targeted protein degradation. Many proangiogenic and antiangiogenic signaling molecules are regulated by ubiquitin-dependent proteolysis (Rahimi, 2012). To our knowledge, ubiquitin-mediated degradation of Akt has not been reported in the regulation of angiogenic sprouting. However, lysine 63 chain (K63)–linked nonproteolytic ubiquitination (Yang et al., 2009a; Chan et al., 2012; Lin, 2013) and lysine 48 chain (K-48)–linked ubiquitination and subsequent proteasomal degradation of Akt (Dickey et al., 2008; Xiang et al., 2008; Santi and Lee, 2010) are evident in other systems. K-63-linked ubiquitination of Akt has emerged as an important mechanism of fine-tuning of Akt activation (Lin, 2013). We found a complete loss of Akt1 protein coinciding with K-48-linked ubiquitination. There are several E3 ubiquitin ligase candidates whose activities lead to Akt degradation, including the tetratricopeptide repeat domain 3 (TTC3), which specifically interacts with activated Akt (Suizu et al., 2009; Kim et al., 2011), the proapoptotic mitochondrial ubiquitin ligase activator of NF-κB (MULAN) E3 ligase (Bae et al., 2012), the breast cancer susceptibility gene 1 (BRCA1 gene), which acts as an E3 ligase interacting with only phosphorylated Akt (Xiang et al., 2008), and the Hsc-70–interacting protein (CHIP) E3 ligase, which causes Akt ubiquitination and degradation as a response to cellular stress (Dickey et al., 2008). However, the identity of the E3 ligase responsible for proteasomal degradation of endothelial Akt in coculture with vSMC remains unknown.
Akt1 knockdown in growth factor–stimulated epithelial cells enhanced Erk activation and increased cell migration (Irie et al., 2005), in agreement with our observations in EC-vSMC coculture. However, Irie et al. (2005) also found that Akt2 knockdown inhibited cell migration. In contrast, we found that silencing of all three Akt isoforms facilitated capillary-like network formation. Thus, although Akt1 is the main Akt isoform expressed in ECs, Akt3 and possibly also Akt2 may influence angiogenesis. Indeed, a recent report highlighted regulatory interactions between different Akt isoforms in endothelial cell neoplasms (Phung et al., 2015). Endothelial Akt3 up-regulation was shown to be PI3K and MAP kinase dependent but Akt1 independent (Fieber et al., 2006) and is an important regulator of VEGF-stimulated mitochondrial biogenesis (Wright et al., 2008).
In summary, our results support a new regulatory principle according to which endothelial cellular context determines Akt protein dynamics and MAP kinase signaling thresholds to drive a morphogenetic program during angiogenesis. Further studies are needed to define the molecular mechanisms that lead to Akt1 degradation and pathway crosstalk.
MATERIALS AND METHODS
Vectors
The myrAkt1 construct has been previously described (Barthel et al., 1997; Lorens et al., 2000). The Akt1-GFP fusion construct was prepared by cloning the open reading frame of the Akt1 cDNA in-frame with the GFP sequence of the cGFP retroviral vector. The myrAkt3 construct was generated by substituting Akt1 for Akt3 (generously provided by Johanna Ivaska, University of Turku, Finland) in a retroviral myrAkt1-IRES-GFP vector. The myrAkt1(T308A) and myrAkt1(S473A) constructs were generated by introducing point mutations in the phosphorylation sites, substituting threonine and serine for alanine, respectively. Point mutations were introduced using a QuikChange XL Site Directed Mutagenesis Kit (Stratagene/Agilent Technologies, Santa Clara, CA), following the manufacturer's instructions. Primers used were as follows: T308Akt, 5′-GGTGCCACCA TGAAGGCCTT TTGCGGCACA CCTG-3′; and S473Akt, 5′-CCCACTT CCCCCAGTTC GCCTACTCGG CCAGCGGC-3′.
Cells
HUVECs (single-donor lot; Lonza, Basel, Switzerland) were grown in EGM-2 medium (Lonza). PaSMCs (single-donor lot; Lonza) were grown in SmGm medium (Lonza). Phoenix A retroviral packaging cells (Gary Nolan, Stanford University, Stanford, CA) were grown in DMEM, 4500 mg/ml glucose (Sigma-Aldrich, St. Louis, MO), supplemented with 10% fetal bovine serum (FBS; Euro Clone/PAA), 5% penicillin–streptomycin (Sigma-Aldrich), and 5% l-glutamine (Sigma-Aldrich).
Retroviral transduction
Phoenix A retroviral packaging cells were transfected according to Swift et al. (1999). Briefly, subconfluent Phoenix A cells were transfected by CaCl2 precipitation in the presence of chloroquine (Sigma-Aldrich). Virus was harvested in EGM-2 medium 48 h posttransfection, filtered through 0.45-μm-pore-size polysulfonic filters, and added to subconfluent HUVECs with 5 μg/ml protamine sulfate (Sigma-Aldrich). HUVECs were incubated with virus for 16 h. Transduced HUVECs were purified based on IRES-GFP marker expression by flow cytometry sorting on a FACSAria Cell Sorter (BD Biosciences, Franklin Lakes, NJ) or by puromycin selection (1 μM; Sigma-Aldrich) for ∼24 h.
siRNAs and transfection of HUVECs
Plasmid 9018: 1271 pBabe puroL Myr HA Akt2, Plasmid 12523: pBabe puro Myr HA PIK3CA, Plasmid 12525: pBabe puro HA PIK3CA E545K, and Plasmid 15269: pBabe-Puro-BRAF-V600E were purchased from Addgene (Cambridge, MA). Transfection of HUVECs was done in six-well plates. Transfection reagents were mixed, vortexed, and incubated at room temperature for 30 min. Reagents (per six-well) were 95 μl of Opti-MEM Reduced Serum Medium with GlutaMAX (#51985-034; Invitrogen, Waltham, MA), 2 μl of siRNA (60 nM final concentration), and 4 μl of HiPerFect Transfection Reagent (#301705; Qiagen, Venlo, Netherlands). Cells were split and seeded at a density of 30–40% confluency in 650 μl of complete EGM-2 medium. Transfection reagents were added dropwise, and the cells were incubated overnight. The next day, 700 μl of EGM-2 was added (transfection reagents were not removed), and cells were incubated for additional 48 h. Transfected HUVECs were then split and seeded out in coculture with PaSMCs, as described in the following section.
In vitro coculture assay
ECs and PaSMCs were mixed and seeded in culture plates in a 1:5 ratio in EGM-2 medium (Lonza). We used 10,000 HUVECs and 50,000 PaSMCs in 96-well plates and adjusted the cell number accordingly in larger culture vessels. HDMVECs formed less-dense networks, and 12,000 cells were therefore used when coculturing these cells. Cocultures were grown from 4 h up to 6 d. Nonfluorescent cells were stained with UEA-Lectin-FITC (L9006; Sigma-Aldrich) 1:1000 diluted in culture medium for 45 min at 37°C and thereafter washed three times in phosphate-buffered saline (PBS) before imaging. For imaging and quantitative analysis of network formation, the BD Pathway 855 bioimaging system (BD Biosciences) was used. Images were acquired in 2 × 2 or 3 × 3 montage at 100× magnification, and background subtraction, noise reduction (rolling ball, 25 × 25 pixels) and image thresholding were performed using AttoVision v1.6.1 software (BD Biosciences). Minimum scrap size was set to 3000 pixels to filter out debris and exclude single cells. Network formation was quantified using the parameters tube total length and branch points. All graphs are represented as mean ± SEM. Assessment of statistical significance was done using a two-tailed, two-sample Student's t test assuming unequal variance in Excel v.14.1.0 (Microsoft, Albuquerque, NM).
Inhibitor treatment of cocultures
Cocultures were seeded as described earlier in relation to EGM-2 medium containing inhibitors. The following inhibitors were added at the indicated concentrations (determined by dose–response experiments in HUVECs): 10 μM PD98059 (#9900S; Cell Signaling Technology, Danvers, MA), 10 μM U0126 (#9903; Cell Signaling Technology), 1 μM AktVIII (#124018; Merck Millipore, Darmstadt, Germany), and 0.5 μM wortmannin (#9951; Cell Signaling Technology). Stock solutions of all inhibitors were dissolved in dimethyl sulfoxide (DMSO; Sigma-Aldrich), and control cultures were treated with corresponding amounts of DMSO. Cocultures were imaged and analyzed as described earlier. Assessment of statistical significance was done using a one-tailed, two-sample Student's t test assuming unequal variance in Excel v.14.1.0.
Flow cytometry
Cells were incubated with 10× trypsin (Sigma-Aldrich) on ice until detachment (∼20–30 min). Cells were fixed with 2% paraformaldehyde (PFA; Electron Microscopy Sciences, Hatfield, PA) for 10 min at 37°C. PFA was added directly into the trypsin solution. Cells were incubated on ice for 1 min before methanol was added slowly to a final concentration of 90%. Samples were incubated on ice for additional 30 min and stored at −20°C (up to 2 wk) or −80°C (long-term storage) until staining.
For intracellular staining, cells were incubated in blocking buffer (BB; PBS + 0.5% bovine serum albumin [BSA]) for 15 min at room temperature. Primary antibody was added in BB: p-p44/42 MAP kinase mouse monoclonal antibody (mAb; #9106S; Cell Signaling Technology) 1:2000, pAkt (S473) rabbit mAb (#4058L; Cell Signaling Technology) 1:400, pAkt (T308) rabbit Ab (#9275; Cell Signaling Technology) 1:250, or Akt (pan) mouse Ab (#9272; Cell Signaling Technology) 1:50. Samples were incubated for 40 min at room temperature and washed once in BB. Subsequently, samples were incubated with secondary Ab Alexa 647 goat anti-rabbit (#A21244; Invitrogen) 1:2000 or Pacific Blue goat anti-mouse (#P31582; Invitrogen) 1:2000 in BB for 30 min at room temperature. Samples were then washed once, resuspended in PBS, and analyzed using a LSR Fortessa (BD Biosciences), FACS Accuri C6 (BD Biosciences), or FACS Aria (BD Biosciences) flow cytometer and processed using the FlowJo7.6 software.
Microscopy
Cocultures or monocultures of HUVECs and PaSMCs were cultured for 1–2 d. Cells were fixed in 4% PFA/PBS at room temperature for 25 min, washed in PBS, and blocked in PBS/0.3%Triton X-100 (Sigma-Aldrich)/5% goat serum (Sigma-Aldrich) for 1 h at room temperature. Primary Ab Akt (pan) mouse Ab (#9272; Cell Signaling Technology) was added in PBS/0.3% Triton X-100/2% FBS at 1:200 and incubated for 24 h at 4°C. Cells were washed three times in PBS and incubated in secondary Ab Alexa Fluor 647 goat anti-mouse immunoglobulin G (IgG; #A-21236; Invitrogen) at 1:3000 in PBS/0.3%Triton X-100/2%FBS at room temperature for 2 h. Cells were washed three times in PBS, and confocal images were acquired using a Zeiss LSM 510 Meta confocal microscope.
Western blotting and immunoprecipitation
For Western blot analysis, cells were lysed with a cell scraper on ice using NP-40 lysis buffer with Complete Mini Protease Inhibitor Cocktail (Roche, Basel, Switzerland) and phosSTOP Phosphatase Inhibitor Cocktail (Roche). Total protein concentration in lysates was measured using a Pierce BCA protein assay kit (Thermo Scientific, Waltham, MA) following the manufacturer's instructions. We loaded 10% NuPAGE Bis-Tris precast gels (Invitrogen) with 30 μg of protein in each well in Laemmli Sample Buffer. A 1:1 mix of MagicMark XP Western Protein Standard (Invitrogen) and SeeBlue Plus 2 Pre-Stained Standard (Invitrogen) was used as protein standard. Gels were run at 50 V for 20 min and then at 100 V for 1h, 30 min. Blotting was done on ice for 1 h, 30 min at 100 V onto polyvinylidene fluoride membranes (Hybond-P; GE Healthcare, Little Chalfont, United Kingdom). Membranes were washed in TBS–0.1% Tween-20 (TBS-T) and blocked in TBS-T 5% BSA for 1 h at room temperature. Primary antibodies were as follows: Akt1 rabbit mAb (#2938; Cell Signaling Technology), Akt2 rabbit mAb (#3063; Cell Signaling Technology), Akt3 rabbit polyclonal antibody (pAb; #07-383; Millipore), Akt (pan) mouse Ab (#9272; Cell Signaling Technology), ubiquitin rabbit pAb (#3933; Cell Signaling Technology), and anti-GPF rabbit pAb (#ab290, Abcam, Cambridge, United Kingdom) were added at 1:1000; rabbit anti-actin Ab (#A5060; Sigma-Aldrich) was added at 1:5000 in TBS-T 5% BSA; and membranes were incubated over night at 4°C. Membranes were then washed three times in TBS-T and incubated in secondary Ab goat anti-mouse IgG (H+L) horseradish peroxidase (HRP) conjugate (#172-1011; BioRad, Hercules, CA) or goat anti-rabbit IgG-HRP (#65-6120; Invitrogen) 1:5000 in TBS-T 5% milk for 45 min at room temperature. Membranes were developed for 1 min using enhanced chemiluminescence reagents and imaged with chemiluminescence using a Molecular Imager ChemiDoc XRS (Bio-Rad).
For immunoprecipitation, cells were lysed in ice-cold NP-40 lysis buffer with Complete Mini Protease Inhibitor Cocktail (Roche). Lysates were precleared by incubation with Protein A Sepharose 4B beads (#10-1041; Zymed/Thermo Fischer Scientific, Waltham, MA) coupled to rabbit serum (Sigma-Aldrich) for 1 h at 4°C. Precleared lysates were incubated with anti-GPF rabbit pAb (#ab290; Abcam) at 4°C overnight, and the immunocomplex was precipitated using Protein A beads for 1 h at 4°C. All incubation steps were performed with rotation. Samples were further subjected to Western blotting as previously described.
Supplementary Material
Acknowledgments
We thank Paula Ruurs, Sissel Vik Berge, Ingrid Strand, and Marianne Enger for expert technical assistance. We also thank the reviewers for helpful comments.
Abbreviations used:
- EC
endothelial cell
- HDMVEC
human dermal microvascular endothelial cell
- HUVEC
human umbilical vein endothelial cell
- MAPK
mitogen-activated protein kinase
- Myr
myristolated
- PaSMC
pulmonary artery smooth muscle cell
- PI3K
phophoinositide-3-kinase
- VEGF
vascular endothelial growth factor
- VEGFR
vascular endothelial growth factor receptor
- vSMC
vascular smooth muscle cell.
Footnotes
This article was published online ahead of print in MBoC in Press (http://www.molbiolcell.org/cgi/doi/10.1091/mbc.E14-09-1378) on May 28, 2015.
REFERENCES
- Abid MR, Guo S, Minami T, Spokes KC, Ueki K, Skurk C, Walsh K, Aird WC. Vascular endothelial growth factor activates PI3K/Akt/forkhead signaling in endothelial cells. Arterioscler Thromb Vasc Biol. 2004;24:294–300. doi: 10.1161/01.ATV.0000110502.10593.06. [DOI] [PubMed] [Google Scholar]
- Adini I, Rabinovitz I, Sun JF, Prendergast GC, Benjamin LE. RhoB controls Akt trafficking and stage-specific survival of endothelial cells during vascular development. Genes Dev. 2003;17:2721–2732. doi: 10.1101/gad.1134603. [DOI] [PMC free article] [PubMed] [Google Scholar]
- Altomare DA, Testa JR. Perturbations of the AKT signaling pathway in human cancer. Oncogene. 2005;24:7455–7464. doi: 10.1038/sj.onc.1209085. [DOI] [PubMed] [Google Scholar]
- Bae S, Kim SY, Jung JH, Yoon Y, Cha HJ, Lee H, Kim K, Kim J, An IS, Kim J, et al. Akt is negatively regulated by the MULAN E3 ligase. Cell Res. 2012;22:873–885. doi: 10.1038/cr.2012.38. [DOI] [PMC free article] [PubMed] [Google Scholar]
- Barthel A, Kohn AD, Luo Y, Roth RA. A constitutively active version of the Ser/Thr kinase Akt induces production of the ob gene product, leptin, in 3T3-L1 adipocytes. Endocrinology. 1997;138:3559–3562. doi: 10.1210/endo.138.8.5263. [DOI] [PubMed] [Google Scholar]
- Chan CH, Li CF, Yang WL, Gao Y, Lee SW, Feng Z, Huang HY, Tsai KK, Flores LG, Shao Y, et al. The Skp2-SCF E3 ligase regulates Akt ubiquitination, glycolysis, herceptin sensitivity, and tumorigenesis. Cell. 2012;149:1098–1111. doi: 10.1016/j.cell.2012.02.065. [DOI] [PMC free article] [PubMed] [Google Scholar]
- Chen B, Tardell C, Higgins B, Packman K, Boylan JF, Niu H. BRAFV600E negatively regulates the AKT pathway in melanoma cell lines. PLoS One. 2012;7:e42598. doi: 10.1371/journal.pone.0042598. [DOI] [PMC free article] [PubMed] [Google Scholar]
- Chen J, Somanath PR, Razorenova O, Chen WS, Hay N, Bornstein P, Byzova TV. Akt1 regulates pathological angiogenesis, vascular maturation and permeability in vivo. Nat Med. 2005;11:1188–1196. doi: 10.1038/nm1307. [DOI] [PMC free article] [PubMed] [Google Scholar]
- Dickey CA, Koren J, Zhang YJ, Xu YF, Jinwal UK, Birnbaum MJ, Monks B, Sun M, Cheng JQ, Patterson C, et al. Akt and CHIP coregulate tau degradation through coordinated interactions. Proc Natl Acad Sci USA. 2008;105:3622–3627. doi: 10.1073/pnas.0709180105. [DOI] [PMC free article] [PubMed] [Google Scholar]
- Evensen L, Link W, Lorens JB. Image-based high-throughput screening for inhibitors of angiogenesis. Methods Mol Biol. 2013a;931:139–151. doi: 10.1007/978-1-62703-056-4_8. [DOI] [PubMed] [Google Scholar]
- Evensen L, Micklem DR, Blois A, Berge SV, Aarsaether N, Littlewood-Evans A, Wood J, Lorens JB. Mural cell associated VEGF is required for organotypic vessel formation. PLoS One. 2009;4:e5798. doi: 10.1371/journal.pone.0005798. [DOI] [PMC free article] [PubMed] [Google Scholar]
- Evensen L, Micklem DR, Link W, Lorens JB. A novel imaging-based high-throughput screening approach to anti-angiogenic drug discovery. Cytometry A. 2010;77:41–51. doi: 10.1002/cyto.a.20808. [DOI] [PubMed] [Google Scholar]
- Evensen L, Odlo K, Micklem DR, Littlewood-Evans A, Wood J, Kuzniewski C, Altmann KH, Hansen TV, Lorens JB. Contextual compound screening for improved therapeutic discovery. Chembiochem. 2013b;14:2512–2518. doi: 10.1002/cbic.201300409. [DOI] [PubMed] [Google Scholar]
- Fieber CB, Eldridge J, Taha TA, Obeid LM, Muise-Helmericks RC. Modulation of total Akt kinase by increased expression of a single isoform: requirement of the sphingosine-1-phosphate receptor, Edg3/S1P3, for the VEGF-dependent expression of Akt3 in primary endothelial cells. Exp Cell Res. 2006;312:1164–1173. doi: 10.1016/j.yexcr.2006.01.022. [DOI] [PubMed] [Google Scholar]
- Guan KL, Figueroa C, Brtva TR, Zhu T, Taylor J, Barber TD, Vojtek AB. Negative regulation of the serine/threonine kinase B-Raf by Akt. J Biol Chem. 2000;275:27354–27359. doi: 10.1074/jbc.M004371200. [DOI] [PubMed] [Google Scholar]
- Hellesoy M, Blois AL, Tiron CE, Mannelqvist M, Akslen LA, Lorens JB. Akt1 activity regulates vessel maturation in a tissue engineering model of angiogenesis. Tissue Eng Part A. 2014;20:2590–2603. doi: 10.1089/ten.TEA.2013.0399. [DOI] [PubMed] [Google Scholar]
- Hickey MM, Simon MC. Regulation of angiogenesis by hypoxia and hypoxia-inducible factors. Curr Top Dev Biol. 2006;76:217–257. doi: 10.1016/S0070-2153(06)76007-0. [DOI] [PubMed] [Google Scholar]
- Hoeben A, Landuyt B, Highley MS, Wildiers H, Van Oosterom AT, De Bruijn EA. Vascular endothelial growth factor and angiogenesis. Pharmacol Rev. 2004;56:549–580. doi: 10.1124/pr.56.4.3. [DOI] [PubMed] [Google Scholar]
- Hong CC, Peterson QP, Hong JY, Peterson RT. Artery/vein specification is governed by opposing phosphatidylinositol-3 kinase and MAP kinase/ERK signaling. Curr Biol. 2006;16:1366–1372. doi: 10.1016/j.cub.2006.05.046. [DOI] [PMC free article] [PubMed] [Google Scholar]
- Huang W, Zhao Y, Zhu X, Cai Z, Wang S, Yao S, Qi Z, Xie P. Fluoxetine upregulates phosphorylated-AKT and phosphorylated-ERK1/2 proteins in neural stem cells: evidence for a crosstalk between AKT and ERK1/2 pathways. J Mol Neurosci. 2012;49:244–249. doi: 10.1007/s12031-012-9822-5. [DOI] [PubMed] [Google Scholar]
- Irie HY, Pearline RV, Grueneberg D, Hsia M, Ravichandran P, Kothari N, Natesan S, Brugge JS. Distinct roles of Akt1 and Akt2 in regulating cell migration and epithelial-mesenchymal transition. J Cell Biol. 2005;171:1023–1034. doi: 10.1083/jcb.200505087. [DOI] [PMC free article] [PubMed] [Google Scholar]
- Karar J, Maity A. PI3K/AKT/mTOR pathway in angiogenesis. Front Mol Neurosci. 2011;4:51. doi: 10.3389/fnmol.2011.00051. [DOI] [PMC free article] [PubMed] [Google Scholar]
- Kim SY, Lee JH, Huh JW, Ro JY, Oh YM, Lee SD, An S, Lee YS. Cigarette smoke induces Akt protein degradation by the ubiquitin-proteasome system. J Biol Chem. 2011;286:31932–31943. doi: 10.1074/jbc.M111.267633. [DOI] [PMC free article] [PubMed] [Google Scholar]
- Lee S, Chen TT, Barber CL, Jordan MC, Murdock J, Desai S, Ferrara N, Nagy A, Roos KP, Iruela-Arispe ML. Autocrine VEGF signaling is required for vascular homeostasis. Cell. 2007;130:691–703. doi: 10.1016/j.cell.2007.06.054. [DOI] [PMC free article] [PubMed] [Google Scholar]
- Liao Y, Hung MC. Physiological regulation of Akt activity and stability. Am J Transl Res. 2010;2:19–42. [PMC free article] [PubMed] [Google Scholar]
- Lin K. The Akt DUBbed InAktive. Sci Signal. 2013;6:pe1. doi: 10.1126/scisignal.2003864. [DOI] [PubMed] [Google Scholar]
- Lorens JB, Jang Y, Rossi AB, Payan DG, Bogenberger JM. Optimization of regulated LTR-mediated expression. Virology. 2000;272:7–15. doi: 10.1006/viro.2000.0353. [DOI] [PubMed] [Google Scholar]
- McCubrey JA, Steelman LS, Chappell WH, Abrams SL, Wong EW, Chang F, Lehmann B, Terrian DM, Milella M, Tafuri A, et al. Roles of the Raf/MEK/ERK pathway in cell growth, malignant transformation and drug resistance. Biochim Biophys Acta. 2007;1773:1263–1284. doi: 10.1016/j.bbamcr.2006.10.001. [DOI] [PMC free article] [PubMed] [Google Scholar]
- Moelling K, Schad K, Bosse M, Zimmermann S, Schweneker M. Regulation of Raf-Akt cross-talk. J Biol Chem. 2002;277:31099–31106. doi: 10.1074/jbc.M111974200. [DOI] [PubMed] [Google Scholar]
- Phung TL, Du W, Xue Q, Ayyaswamy S, Gerald D, Antonello Z, Nhek S, Perruzzi CA, Acevedo I, Ramanna-Valmiki R, et al. Akt1 and akt3 exert opposing roles in the regulation of vascular tumor growth. Cancer Res. 2015;75:40–50. doi: 10.1158/0008-5472.CAN-13-2961. [DOI] [PubMed] [Google Scholar]
- Rahimi N. The ubiquitin-proteasome system meets angiogenesis. Mol Cancer Ther. 2012;11:538–548. doi: 10.1158/1535-7163.MCT-11-0555. [DOI] [PMC free article] [PubMed] [Google Scholar]
- Ren B, Deng Y, Mukhopadhyay A, Lanahan AA, Zhuang ZW, Moodie KL, Mulligan-Kehoe MJ, Byzova TV, Peterson RT, Simons M. ERK1/2-Akt1 crosstalk regulates arteriogenesis in mice and zebrafish. J Clin Invest. 2010;120:1217–1228. doi: 10.1172/JCI39837. [DOI] [PMC free article] [PubMed] [Google Scholar]
- Reusch HP, Zimmermann S, Schaefer M, Paul M, Moelling K. Regulation of Raf by Akt controls growth and differentiation in vascular smooth muscle cells. J Biol Chem. 2001;276:33630–33637. doi: 10.1074/jbc.M105322200. [DOI] [PubMed] [Google Scholar]
- Rommel C, Clarke BA, Zimmermann S, Nunez L, Rossman R, Reid K, Moelling K, Yancopoulos GD, Glass DJ. Differentiation stage-specific inhibition of the Raf-MEK-ERK pathway by Akt. Science. 1999;286:1738–1741. doi: 10.1126/science.286.5445.1738. [DOI] [PubMed] [Google Scholar]
- Rousseau S, Houle F, Landry J, Huot J. p38 MAP kinase activation by vascular endothelial growth factor mediates actin reorganization and cell migration in human endothelial cells. Oncogene. 1997;15:2169–2177. doi: 10.1038/sj.onc.1201380. [DOI] [PubMed] [Google Scholar]
- Santi SA, Lee H. The Akt isoforms are present at distinct subcellular locations. Am J Physiol Cell Physiol. 2010;298:C580–C591. doi: 10.1152/ajpcell.00375.2009. [DOI] [PubMed] [Google Scholar]
- Soler A, Serra H, Pearce W, Angulo A, Guillermet-Guibert J, Friedman LS, Vinals F, Gerhardt H, Casanovas O, Graupera M, Vanhaesebroeck B. Inhibition of the p110alpha isoform of PI 3-kinase stimulates nonfunctional tumor angiogenesis. J Exp Med. 2013;210:1937–1945. doi: 10.1084/jem.20121571. [DOI] [PMC free article] [PubMed] [Google Scholar]
- Stambolic V, Woodgett JR. Functional distinctions of protein kinase B/Akt isoforms defined by their influence on cell migration. Trends Cell Biol. 2006;16:461–466. doi: 10.1016/j.tcb.2006.07.001. [DOI] [PubMed] [Google Scholar]
- Suizu F, Hiramuki Y, Okumura F, Matsuda M, Okumura AJ, Hirata N, Narita M, Kohno T, Yokota J, Bohgaki M, et al. The E3 ligase TTC3 facilitates ubiquitination and degradation of phosphorylated Akt. Dev Cell. 2009;17:800–810. doi: 10.1016/j.devcel.2009.09.007. [DOI] [PubMed] [Google Scholar]
- Sun JF, Phung T, Shiojima I, Felske T, Upalakalin JN, Feng D, Kornaga T, Dor T, Dvorak AM, Walsh K, Benjamin LE. Microvascular patterning is controlled by fine-tuning the Akt signal. Proc Natl Acad Sci USA. 2005;102:128–133. doi: 10.1073/pnas.0403198102. [DOI] [PMC free article] [PubMed] [Google Scholar]
- Swift S, Lorens J, Achacoso P, Nolan GP. Rapid production of retroviruses for efficient gene delivery to mammalian cells using 293T cell-based systems. Curr Protoc Immunol. 1999 doi: 10.1002/0471142735.im1017cs31. [DOI] [PubMed] [Google Scholar]
- Tandara AA, Mustoe TA. Oxygen in wound healing—more than a nutrient. World J Surg. 2004;28:294–300. doi: 10.1007/s00268-003-7400-2. [DOI] [PubMed] [Google Scholar]
- Wang C, Lin K, Chang J, Sun J. Osteogenesis and angiogenesis induced by porous beta-CaSiO(3)/PDLGA composite scaffold via activation of AMPK/ERK1/2 and PI3K/Akt pathways. Biomaterials. 2013;34:64–77. doi: 10.1016/j.biomaterials.2012.09.021. [DOI] [PubMed] [Google Scholar]
- Whiteman EL, Cho H, Birnbaum MJ. Role of Akt/protein kinase B in metabolism. Trends Endocrinol Metab. 2002;13:444–451. doi: 10.1016/s1043-2760(02)00662-8. [DOI] [PubMed] [Google Scholar]
- Wright GL, Maroulakou IG, Eldridge J, Liby TL, Sridharan V, Tsichlis PN, Muise-Helmericks RC. VEGF stimulation of mitochondrial biogenesis: requirement of AKT3 kinase. FASEB J. 2008;22:3264–3275. doi: 10.1096/fj.08-106468. [DOI] [PMC free article] [PubMed] [Google Scholar]
- Xiang T, Ohashi A, Huang Y, Pandita TK, Ludwig T, Powell SN, Yang Q. Negative regulation of AKT activation by BRCA1. Cancer Res. 2008;68:10040–10044. doi: 10.1158/0008-5472.CAN-08-3009. [DOI] [PMC free article] [PubMed] [Google Scholar]
- Yang WL, Wang J, Chan CH, Lee SW, Campos AD, Lamothe B, Hur L, Grabiner BC, Lin X, Darnay BG, Lin HK. The E3 ligase TRAF6 regulates Akt ubiquitination and activation. Science. 2009a;325:1134–1138. doi: 10.1126/science.1175065. [DOI] [PMC free article] [PubMed] [Google Scholar]
- Yang XM, Wang YS, Zhang J, Li Y, Xu JF, Zhu J, Zhao W, Chu DK, Wiedemann P. Role of PI3K/Akt and MEK/ERK in mediating hypoxia-induced expression of HIF-1alpha and VEGF in laser-induced rat choroidal neovascularization. Invest Ophthalmol Vis Sci. 2009b;50:1873–1879. doi: 10.1167/iovs.08-2591. [DOI] [PubMed] [Google Scholar]
- Zachary I. VEGF signalling: integration and multi-tasking in endothelial cell biology. Biochem Soc Trans. 2003;31:1171–1177. doi: 10.1042/bst0311171. [DOI] [PubMed] [Google Scholar]
- Zhou Q, Heinke J, Vargas A, Winnik S, Krauss T, Bode C, Patterson C, Moser M. ERK signaling is a central regulator for BMP-4 dependent capillary sprouting. Cardiovasc Res. 2007;76:390–399. doi: 10.1016/j.cardiores.2007.08.003. [DOI] [PubMed] [Google Scholar]
- Zimmermann S, Moelling K. Phosphorylation and regulation of Raf by Akt (protein kinase B) Science. 1999;286:1741–1744. doi: 10.1126/science.286.5445.1741. [DOI] [PubMed] [Google Scholar]
Associated Data
This section collects any data citations, data availability statements, or supplementary materials included in this article.


