Abstract
A new ion mobility spectrometer (IMS) platform was developed to improve upon the sensitivity and reproducibility of our previous platforms, and further enhance IMS-MS utility for broad ‘pan-omics’ measurements. The new platform incorporated an improved electrospray ionization source and interface for enhanced sensitivity, and providing the basis for further benefits based upon implementation of multiplexed IMS. The ion optics included electrodynamic ion funnels at both the entrance and exit of the IMS, an ion funnel trap for ion injection, and a design in which nearly all ion optics (e.g. drift rings, ion funnels) were fabricated using printed circuit board technology. The IMS resolving power achieved was ~73 for singly-charged ions, very close to the predicted diffusion-limited resolving power (~75). The platform’s performance evaluation (e.g. for proteomics measurements) include LC-IMS-TOF MS datasets for 30 technical replicates for a trypsin digested human serum, and included platform performance in each dimension (LC, IMS and MS) separately.
Introduction
Interest in utilizing ion mobility spectrometry (IMS) measurements with mass spectrometry is growing increasingly, with applications in a multitude of fields.1 Although IMS-MS was known in the 1970s, its widespread use was limited to fundamental studies of ion-neutral interactions for small molecules2. Interest in applying IMS to biomolecule studies increased dramatically during the 1990s.3 Such application of MS also spurred research in IMS instrumentation in an effort to improve sensitivity and robustness of IMS-MS measurements. Improvements encompassed all aspects of the IMS-MS platform including new ion sources (such as ESI and MALDI), trapping, multiplexing and integrating with different mass spectrometers. More detailed descriptions of advances in IMS has been presented in multiple reviews as well as books for interested readers.4 In traditional IMS experiments, a packet of ions is pulsed into a cell filled with inert gas (usually He or N2) and a weak and uniform electric field is applied through the drift cell to move ions through the buffer gas.5 The electric field is generally applied to a stack of ring-shaped electrodes using a resistor chain or to a tube coated with resistive material6. Entrance and exit orifices help contain the buffer gas and enable integration of the IMS with other ion-optics that typically operate at pressures orders of magnitudes lower than the drift cell. Despite all of these efforts IMS sensitivity has been a bottleneck to applications, and is an issue that can be largely attributed to poor (input) ion utilization efficiency and ion losses at the IMS exit orifice due to diffusional expansion of the ion packet. Approaches to minimize ion losses at the exit of the cell included utilizing periodic focusing electric fields and RF confinement to reduce the radial spread of the ion packet. In periodic focusing IMS the ratio of the drift ring thickness to the spacing between the rings was close to one-to-one and when combined with rings of small inner diameters periodic focusing (non-uniform) fields were produced that countered the ion diffusion, thus enabling relatively high sensitivity compared to conventional drift cell operations.7 RF confinement was utilized in segmented quadrupole collision cells8, stacked-ring electrodes9 and electrodynamic ion funnels10 to decrease the radial dispersion of ion packet. Arguably, ion losses at the exit of the IMS were most effectively relieved by utilization of the electrodynamic ion funnel. Instead of losing ions to the exit orifice, the ion funnel with large acceptance orifice was able to focus the ion cloud into a 2.5 mm i.d. orifice suitable for transfer to the following lower-pressure stages of ion optics. Utilizing ion funnels also allowed drift rings of large inner diameters which make the electric field homogenous as well as accommodate large ion currents that otherwise cannot be handled effectively by other RF guides. Further, the ion funnel enabled high IMS resolving power (i.e. with no loss of resolution due to focusing in the ion funnel) as well as with essentially no ion losses at the exit of the drift cell10, and was adapted by Clemmer and Bowers to enable high sensitivity in IMS instruments,11 as well as recent implementation in a commercial platform from Agilent Technologies.12 Ion funnels were also utilized at the source of IMS platforms to focus ions from the ESI source inlet capillary as well as allow for ion trapping prior to injection into the drift cell.13 Large improvements in sensitivity were observed due to the increase in trapping efficiency as well as the multiplexed introduction of ions into the drift cell14. In this manuscript we describe further improvements on the design of the drift cell based IMS in an effort to improve its sensitivity and robustness for broad omics measurements.
Experimental Arrangement
Experiments were performed on a home-built ion mobility spectrometer coupled to either a commercial time-of-flight (TOF) mass spectrometer or a quadrupole time-of-flight (QTOF) mass spectrometer, both from Agilent Technologies (6224 TOF and 6538 QTOF, Agilent Technologies, Santa Clara CA, USA). Details of the IMS components are presented below.
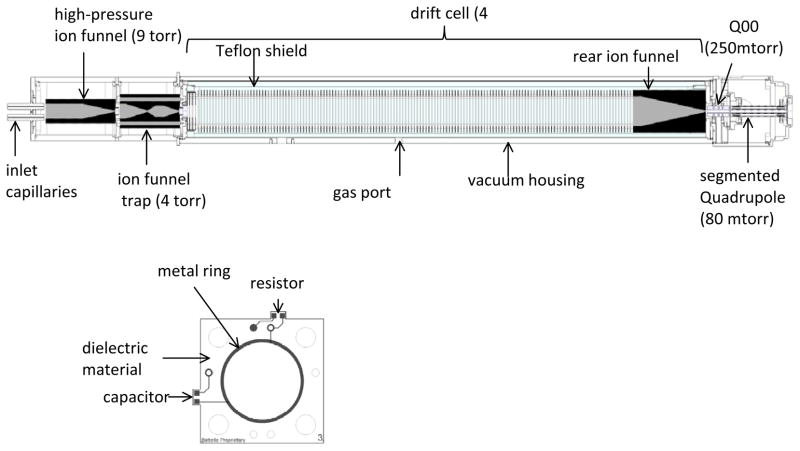
Samples were infused directly from a syringe pump or from a liquid chromatography (LC) column into a 20 μm i.d. fused-silica emitter to an electrospray ionization (ESI) source. Ions were then transferred through a Stainless Steel capillary heated to 120°C into the first vacuum chamber hosting a high-pressure ion funnel (HPIF). As shown in Figure 1, the electrospray ion source was equipped with two heated inlet capillaries of 1.0 and 0.5 mm i.d., respectively. The two capillaries were offset from the center axis of the high pressure ion funnel by ~6 mm. In one mode of operation the sample was directed into the 1 mm inlet while the 0.5 mm i.d. inlet was utilized for calibrant to help improve the mass measurement accuracy by calibrating the m/z before and after every LC run. In the other mode of operation, the two capillaries were used to infuse two different samples that were either difficult to ionize in a mixture or eluting from two different LC columns and then combine inside the high-pressure ion funnel.
Figure 1.
Top: Schematic of the ion mobility spectrometer. Bottom: schematic of an ion funnel PCB lens.
The first vacuum housing of the instrument hosts a high pressure ion funnel and is pumped by an Edward E2M30 that bring the pressure to 9 torr when the 1.0 and 0.5 mm i.d. capillaries are utilized. The high pressure ion funnel is a low capacitance (~350 pF) ion funnel fabricated using printed-circuit board (PCB) technology. The individual ion funnel lenses (Figure 1) are fabricated by depositing a thin layer (~65 μm) of gold-coated copper on a thin dielectric material (a woven fiberglass with an epoxy resin binder). The metal layer forms a 2 mm-wide ring that also cover the inner edge of each lens so ions are only exposed to conductive surfaces. The resistors as well as capacitors needed for supplying the DC voltage and RF waveform are mounted on each lens and connections between ion funnel lenses are made using miniature spring-loaded connectors (pogo pins). Two chains of resistors are used to supply the DC voltage to ion funnel lenses such that each chain is connected to lenses of the same RF phase, which significantly reduces resistive heating of the ion funnel. The DC gradient through the high pressure funnel was maintained at ~20V/cm while RF was maintained at 1 MHz and 150 Vp-p. Ions exit the high pressure ion funnel through a DC-only (i.e. no RF applied) exit lens of 2.5 mm i.d. into the ion funnel trap housing, and ion funnel trap center axis is offset by ~6 mm from the central axis of the high pressure ion funnel. The double offset in the ion source (inlet capillary/HPIF and HPIF/IFT) minimizes contamination of the drift cell and effectively eliminates perturbations to the trapping of ions in ion funnel trap (IFT) due to gas dynamic effects. The IFT design is similar to that published previously13, 15 but fabricated using PCB technology, similar to the HPIF described above, with the exception that the width of the metalized ring was increased to 5 mm in the trapping region. We found that wider rings in the trapping region reduced field penetration from the surrounding ground potential which otherwise affected performance of the trap. The IFT was operated at 900 KHz and 150 Vp-p. The pressure in the IFT vacuum housing was maintained at 4 torr by controlling the pumping of an Edwards E2M30 vacuum pump using a valve. The IFT can be operated in transmission or trapping modes. In the transmission mode all voltages on the trap are adjusted for continuous transmission of ions. In trapping mode ions are trapped for specific period of time by adjusting the voltages on the entrance, trap and exit grids13. Ions exit the IFT through a 2.5 mm i.d. orifice into the drift cell.
The drift cell is 79 cm long (excluding the rear ion funnel) and is filled with pure N2 to a pressure of ~4.0 torr. Nitrogen gas flows through moisture and hydrocarbon traps before flowing into the drift cell. Pressure in the drift cell is slightly higher (~40 mtorr) than the IFT region to keep neutrals from the source from entering and contaminating the drift cell, or for otherwise changing the gas composition. The drift rings have a 50 mm i.d., 70 mm o.d., 0.56 mm thick and are spaced 5 mm apart using ceramic spacers. The last DC-only orifice in the IFT and the first IMS ring are designed as nested tube lenses to screen the dielectric material between the source and the drift cell regions. The drift rings are also fabricated from PCB materials similar to the HPIF and IFT, but unlike the HPIF and IFT the deposited metal covers the entire drift rings to ensure a homogenous field throughout the drift cell. Following the drift cell is rear ion funnel that has an acceptance ring electrode of 50 mm i.d. and is fabricated similar to the HPIF. The inner diameter of the rear funnel electrodes linearly decrease to a 2.5 mm exit lens over a length of 12.6 cm. All drift rings as well as the rear funnel electrodes are mounted on 4 long ceramic rods that ensure precise alignment of the drift cell. The whole drift cell is enclosed inside a Teflon tube to screen the high voltage (up to 2300 V) applied to the first IMS drift ring from the ground potential applied to the outer aluminum enclosure. The Teflon tube is completely sealed for electrical-current leakage except for a window opening at the rear funnel region. We found that the manner by which the buffer gas is introduced into the drift cell is quite important for optimum sensitivity. The drift cell (including the rear ion funnel) typically operates at a DC gradient of ~17 V/cm. In this arrangement the outer vacuum housing of drift tube is kept at ground potential while only the source (the dual funnel) housing is biased relative to the IMS entrance voltage (1800 V).
To efficiently integrate the drift cell with the time-of-flight MS, which operates at lower pressure, a dual quadrupole interface was utilized to replace the Agilent capillary/skimmer source interface. The first quadrupole (Q00) consisted of four rods that were 38.10 mm long, 6.35 mm diameter and arranged on an inscribed radius of 2.79 mm. The pressure in the first quadrupole was maintained at 250 mtorr. A 2.5 mm conductance limiting orifice separates Q00 from the second quadrupole (Q0) which is a segmented one.16 The segmented quadruple (Q0) has a similar inscribed radius and rod diameter as Q00. However, each rod is segmented into eight segments that are 11.8 mm long-each and separated by 0.25 mm PEEK spacers nested between the segments. The segmented quadrupole is further partitioned into two sections where the first section contains 5 segments while the second section contains 3 segments. Two resistive chains supply the DC gradient to each section of the segmented quadrupole. Creating a potential difference between the DC gradient of the two sections results in an acceleration field to induce collision-induced dissociation.16 The pressure in the segmented quadrupole was maintained at 80 mtorr. A 2.5 mm conductance-limiting orifice separates the segmented quadrupole from the octopole which is the first ion guide in the Agilent TOF interface. The RF waveform on the first quadrupole and the segmented quadrupole was maintained at 1 MHz and 130 Vp-p.
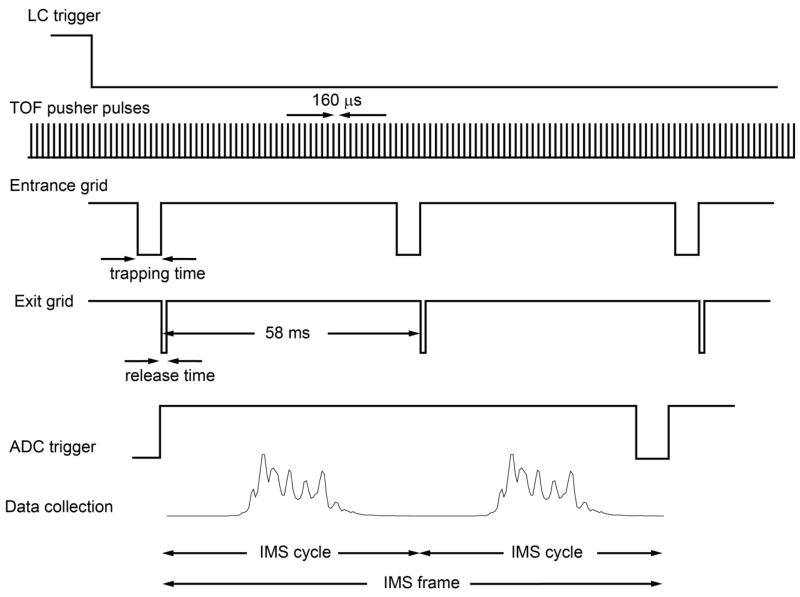
The signal from the TOF detector is routed to 8-bit Analog-to-Digital converter (ADC) (AP240, Agilent Technologies, Switzerland) and processed using a custom control-software written in C#. The software monitors the pressures, source temperature and allows user-control of all voltages in the platform as well as ion funnel trap timing. The software saves all experimental parameters as well as data into a Unified Ion Mobility Format (UIMF) file.17 The software also allows alternating between signal average and multiplexed mode of operating the ion funnel trap. The timing sequence for the signal averaging mode is shown in Figure 2. After receiving a trigger signal from the LC for the start of the gradient, the software acquires data by first monitoring the train of TTL pulses from the TOF pusher, which have a period of ~160 μs, and then starts the sequence of trapping operations. The trap release time (exit grid) is considered the zero time for the IMS separation and it triggers the ADC to start collecting data. The ADC collects sequential TOF scans for a user controlled number of scan which is typically 360 TOF scans covering ~58 ms long IMS separations. Multiple IMS cycles are summed, forming an “IMS frame”, to improve the signal-to-noise ratio. In signal averaging mode, the trap release only one ion packet every 58 ms IMS cycle, while in the multiplexed mode multiple ion packets are released per 58 ms IMS cycle. The number of packets released in the multiplexed mode depends on the multiplexing sequence.18 For example in the 4-bit multiplexing sequence eight ion packets are released into the trap per 58 ms IMS cycle. Multiplexing significantly improves the duty cycle as well as the signal-to-noise ratio.19 To improve the mass measurement accuracy, the software interrupts the sample introduction and enables the calibrant inlet for 200 ms at the beginning and end of every LC run. The timing is chosen where no ions of interest are eluting from the LC column. The mass spectra calibration parameters of a nine peptide calibrant are then applied to all IMS frame collected during the LC experiment. This procedure is done automatically and corrects for any possible instrumental drift during the LC run.
Figure 2.
Timing sequence of the LC-IMS-TOF in the signal averaging mode.
Data presented in this manuscript have been processed using bioinformatics tools (Decon2ls, Multialign and Feature Finder) that were developed at Pacific Northwest National Laboratory (PNNL) and are all available online on http://omics.pnl.gov/software.
Results and Discussion
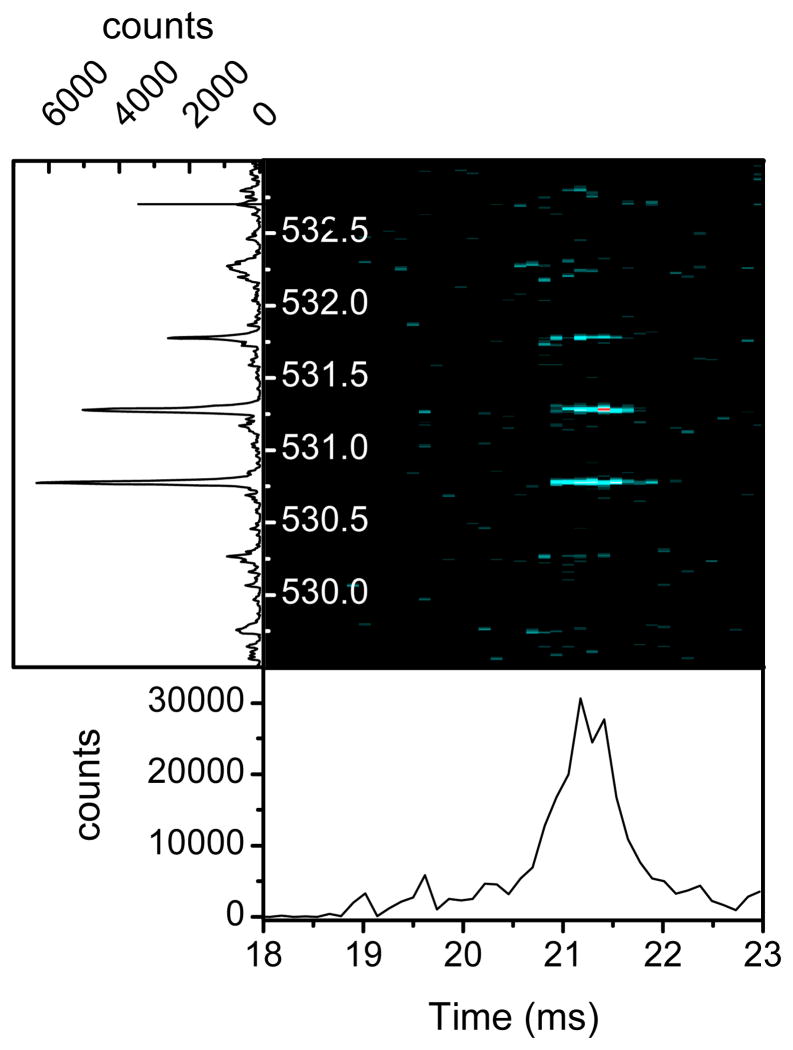
The performance of the new IMS platform was evaluated in terms of resolving power (R), sensitivity and reproducibility. The ability of the rear ion funnel to capture the diffused ion packets was investigated by monitoring the signal intensity at different drift fields. For cross section measurements a low drift field is desirable. However, at very low drift field ion packets diffuse significantly and can expand beyond the capturing orifice of the rear funnel (50 mm) and thus reduce the sensitivity. Ion packet expansion can also happen at high charge density due to columbic repulsion, thus, a balance is usually struck between sensitivity and field strength. Figure 3 illustrates the intensity of two peptide ions (Angiotensin I 3+ at m/z 432.9 and Melittin 3+ at m/z 949.3) as a function of drift fields. As indicated in Figure 3 the funnel can capture ions effectively at drift field >11–12 V/cm (8.8–9.5 Townsends or Td) which is suitable for cross section measurements. At a drift field of 6 V/cm the percentage of ions captured by the rear drops to ~50% for the more diffused, lower mobility ion at m/z 949.3. The sensitivity of the platform is greatly improved as compared to our previous IMS instrument by more efficient sampling of the ESI ions in the inlet capillary as the sampling area of the capillary is 5 times larger than previously used (i.d. of 1 mm vs. 0.43 mm10). An example of the enhanced sensitivity of the platform is shown in Figure 4 for 0.5 nM Bradykinin at m/z 530.78 (2+ ion) utilizing 30 ms trapping time. The data presented in Figure 4 was acquired in 2.0 seconds while the sample was infused at flow rate of 100 nL/min which correspond to ~2 attomoles of analyte. The signal-to-noise ratio for the data shown in Figure 4 is clearly ≫ 3 indicating an LOD < 2 attomoles. For comparison the LOD for Bradykinin measured in our previous platform was 41 attomoles (Figure S1, Supplementary Materials). The limit-of-detection for spiked peptides in human serum utilizing the current LC-IMS-TOF platform and its comparison to the commercially available Orbitrap Velos has been published recently which indicate a better LOD for the LC-IMS-TOF platform.20
Figure 3.
Normalized intensity for two peptides as a function of drift field. The plot indicates the ability of rear ion funnel to capture the diffused plume.
Figure 4.
IMS-TOF data for 2 attomoles of Bradkinin at m/z 530.78 (2+).
The resolving power of the new platform was measured by infusing a mixture of fluoro phophazine compounds (ESI tune mixture, Agilent Technologies) which form singly-charged ions. The maximum IMS resolving power is limited by the diffusion-limited resolving power of IMS and is defined as21
| (1) |
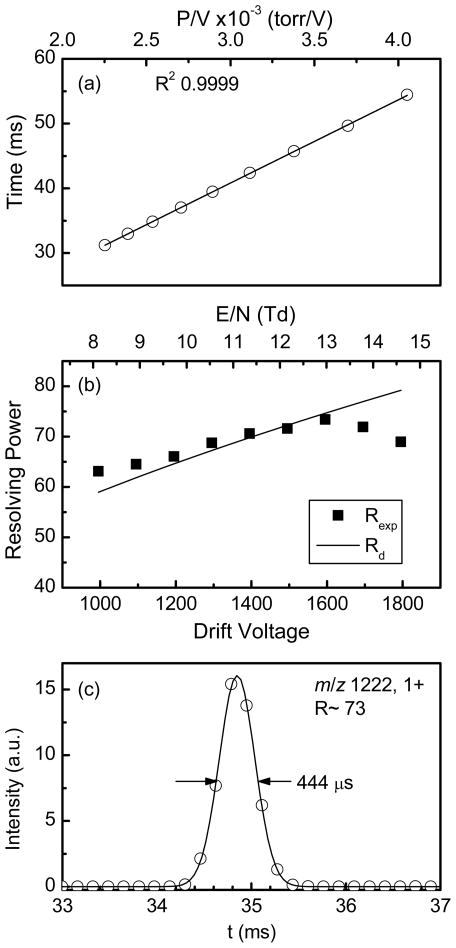
q is the ion charge, V is drift voltage, kb is Boltzmann’s constant and T is temperature. Equation 1 assumes no ion gate effect (i.e. minimal ion gate time), no columbic repulsion and homogenous drift field. Since the rear ion funnel length is significant (~13 %) relative to the total drift length the DC field in the rear ion funnel was also matched to that in the drift cell to ensure optimum resolving power.22 In addition, we found that heating the drift cell to 80°C for at least eight hours after it was first assembled helped to minimize any effect from impurities adsorbed to the surface of all IMS components and to outgas any volatile compounds from the Teflon tube or the PCB lenses. The arrival-time distribution for singly-charged ions of m/z 1222 was collected at different drift field strengths. Figure 5a shows excellent linearity of drift time relative to p/V (R2 ~0.9999) for the range of drift fields 8–15 Td, indicating that the platform operates in the low-field limit. Since the conditions for the low-field limit are lower for higher charge state ions than for singly charged ones we also tested the dependence of mobility on field for multiply-charged ions. The results shown in Supplementary Materials Figure S2 indicate no dependency of the arrival time (which is proportional to ion mobility) on field for multiply charged species further showing the IMS operate in the low field limit. At low drift-fields, however, the IMS resolving-power drops (equation 1). Shown in Figure 5b is the measured resolving power for the singly-charged ions of m/z 1222 at different drift fields along with the predicted diffusion limited resolving power (equation 1) and utilizing a gate opening time of 160 μs. Figure 5c show the arrival-time distribution for the 1600 V data point along with Gaussian fit to the data. Resolving power R was calculated as Rexp=td/tfwhm where td and tfwhm (peak width at half maximum) obtained by fitting the arrival-time distribution to a Gaussian function (as shown in Figure 5c). The measured resolving power nicely matches the calculated diffusion-limited one (Rd) and reached a maximum Rexp of ~73 at 13 Td. The slight drop in resolving power at high field can be attributed to the increased contribution of the gate opening time at high field and shorter drift time as can be explained using equation 2.23
Figure 5.
(a) Plot of the mean arrival-time as function of P/V for singly-charged ions of m/z 1222 (b) Plot of the measured resolving power Rexp (solid squares) and calculated diffusion-limited resolving power Rd (solid line) as a function of the drift voltage for singly-charged ions of m/z 1222. (c) Arrival-time distribution at drift voltage of 1600 V (open circle) and Gaussian fit (solid line).
| (2) |
tg is gate opening time and td is the drift time. It is worth noting that achieving maximum resolving power becomes challenging for high mobility and/or low m/z ions due mainly to the fact that these ions have a short drift time and due to the finite size of the TOF period (~160 μs), thus, the number of points across the peak becomes insufficient (3–5 points for td~20 ms) to define the peak with the desired accuracy. A possible solution to this problem is to shorten the TOF scan width but this is usually done at the expense of maximum detectable m/z or, alternatively, interleaving TOF spectra to increase the number of points across the IMS peak.24 The results shown in Figure 5 indicate that the new platform performs very well in terms of resolving power with no adverse effect due to the use of non-metallic components in the construction of the drift cell or due to the inclusion of the large-acceptance rear ion funnel.
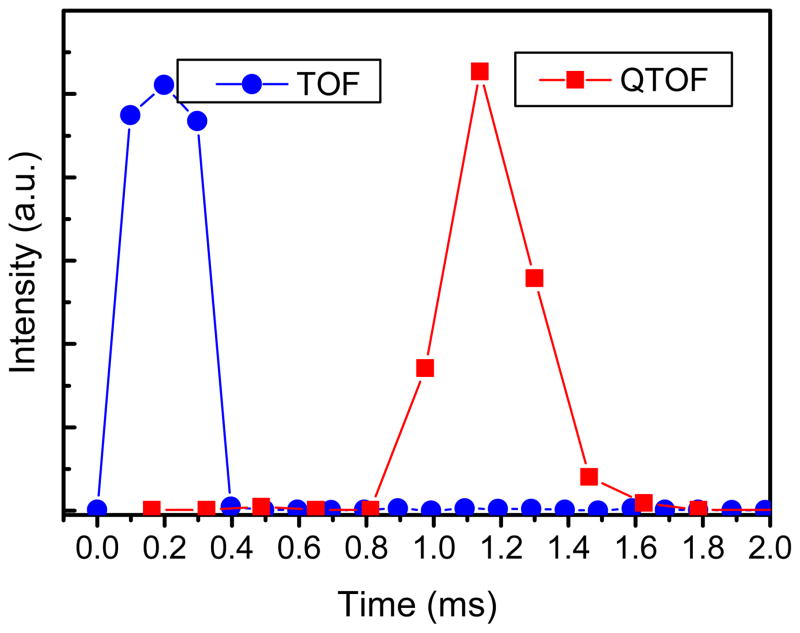
Collision cross section measurements were performed by varying the drift voltage and collecting arrival-time distributions. To account for ions which drift inside the rear funnel the DC field inside the funnel was matched to the field in the rest of the drift cell. Plotting the apex of the ions’ arrival-time distribution (td) versus p/V yield a straight line the slope of which correspond to (L2 273.15)/(760 T K0) where L is drift cell length including the rear ion funnel, T is temperature and K0 is reduced mobility. The intercept of p/V versus td correspond to the time ion spend outside the drift cell (i.e. from exit of rear ion funnel to detector). We found that the time ions spend outside the cell depends on both the mass spectrometer attached to IMS and on the m/z. For instance, the measured flight time for 3+ ions of Angiotensin I (m/z 432.9) differs through the TOF and QTOF interface. By pulsing a continuous ion beam exiting the segmented quadrupole and measuring the arrival-time of the ion packets we found that ions spend an extra ~1 ms in the QTOF interface than in the TOF interface (Figure 6). This additional time is due to the fact that the ions spend extra time in the nitrogen filled collision cell. Despite the longer ion residence times in the QTOF which slightly decreases the IMS resolving power, the absence of the axial DC field inside the collision cell would have made the peak much broader.
Figure 6.
Flight time of (Angiotensin I)3+ ions through the TOF and QTOF interfaces. An ion packet width of 300 μs was injected into both interfaces.
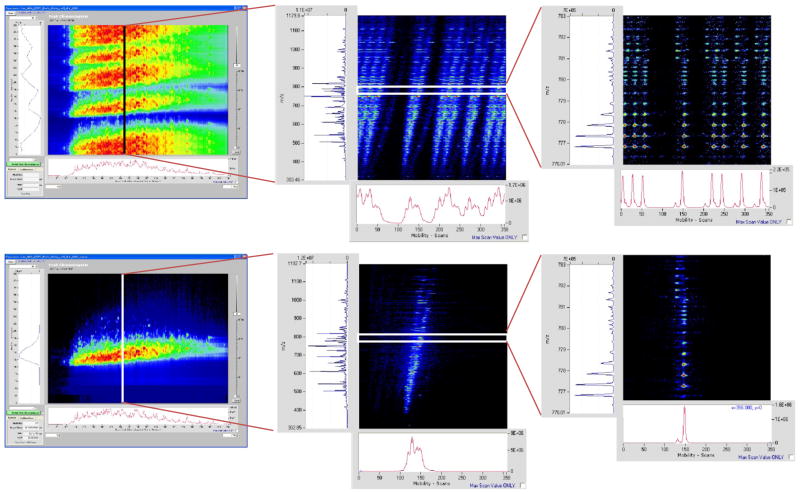
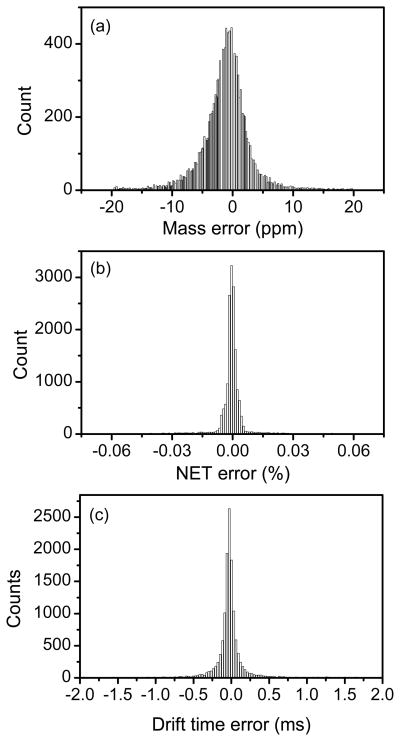
The reproducibility and the performance of the IMS platform were also evaluated by analyzing thirty technical replicates of human plasma samples with 60-min LC-IMS-TOF runs. For all samples, the human plasma was depleted of the 14 most abundant proteins and then tryptically-digested.25 The IMS was operated in the multiplexing mode using the 4-bit pseudorandom sequence. After acquisition, data was initially demultiplexed using custom software to generate the corresponding decoded LC-IMS-QTOF data as depicted in Figure 7.26 In the 4-bit multiplexed mode, eight packets of ions were released from the trap where each packet was trapped for 4 ms. Figure 7a–c show the multiplexed LC-IMS-MS data where data in presented in multiple different 2-dimensional views for clarity. Figure 7a shows the multiplexed LC-IMS data (by collapsing the MS dimension), then the LC time of 24-minutes is extracted in 7b to show the multiplexed IMS-MS data, and finally 7c zooms into a specific m/z window to illustrate the isotope patterns observed in the multiplexed IMS-MS data between 776 and 783 m/z in b. Figure 7d–f represent the data in Figure 7a–c after applying the demultiplexing algorithm to recover the IMS data. The demultiplexing algorithm applies an inverse Hadamard matrix to recover the true signal as well as remove the artifacts that arise due to the imperfections in the acquired data, reflected as ghost peaks after the demultiplexing.26 Multiplexing IMS improves the signal-to-noise ratio of the data as compared to the signal averaging mode which relies on a single packet release. The data were then processed to identify all features in every run. The process to find features involves de-isotoping all peaks (using Decon2ls27) in every mass spectrum to find the monoisotopic mass and charge state of every peak. The Feature Finder algorithm identifies features based on their monoisotopic mass, charge state, drift time as well as LC elution time.28 Features identified from all 30 LC runs were clustered and aligned using MultiAlign.29 Run5 was chosen to be a reference-run to which all other 29 runs were aligned. Data are aligned according to their LC elution time, mass and drift time. As shown in Figure 8 the mass error histogram has a full width half maximum (fwhm) of 4.9 ppm while the normalized elution time (NET) histogram has a fwhm of 0.003 %. The reproducibility of drift time was found to be <0.11 ms. This is further illustrated in Figure 8 for run #8, which has a fwhm of 96 μs while the average fwhm for all 29 runs was 107 μs. The tight histograms of monoisotopic mass, NET and drift time are an indication of the instrument excellent performance.
Figure 7.
LC-IMS-TOF data for a tryptically digested human serum sample. (a) LC-multiplexed IMS data, (b) multiplexed IMS-TOF data at elution time of 24 min. (c) expanded view of the multiplexed IMS-TOF data for m/z range of 776–783. Panels d–f are the same data presented in panels a–c after applying the demultiplexing algorithm to recover the IMS data.
Figure 8.
Reproducibility of the LC-IMS-TOF MS platform. a) Mass measurement accuracy (MMA) histogram of features in run 30. b) Normalized elution time (NET) histogram for run 6. d) Drift time error histogram for run 8.
Conclusion
A new ion mobility spectrometer-mass spectrometer platform was developed for broad proteomic measurements. The ion optics in the platform including the ion funnels as well as the drift cell were fabricated using printed circuit board technology. The new platform exhibits a resolving power of ~73 (for 1+ ions, 1222 m/z) for the 94 cm long drift cell which matches that calculated for the diffusion-limited resolving power. We did not observe issues due to the usage of PCB and Teflon materials in the construction of the drift cell. Contrary to some claims,4a the inclusion of the ion funnel on the rear of the IMS cell has no adverse effect on the maximum obtained resolving power. The new platform with its large inlet capillary (1 mm i.d.), large drift rings and wide acceptance ion funnel maximized ion utilization resulting in a sensitive platform. During high ion current experiments, the platform maximizes ion utilization by multiplexing the packets introduced into the IMS thus improving instrument duty cycle, while at low ion currents the platform utilizes maximum trapping time in the signal averaging mode. The reproducibility of the platform was evaluated using 30 LC runs for human serum. Results showed excellent reproducibility of the platform as observed by tight histograms for mass error, normalized elution time and drift time. There is still room for further improvement to the performance of the IMS. In particular, we speculate that utilizing a higher dynamic range ADC should improve the measurement dynamic range at the high end. At the low end of dynamic range a trap with larger capacity is expected to improve the detection of low abundance species, as well as further expand the achievable high end. Finally, developments that increase the resolving power will extend applications as well as reduce the needs for conventional separations (e.g. LC) prior to IMS.
Supplementary Material
Acknowledgments
Portions of this research were supported by grants from the National Institute of General Medical Sciences (2 P41 GM 103493-11, 8 P41 GM103493-10 and R21 GM103497), NIH National Center for Research Resources (NCRR) under ARRA award 3P41RR018522-07S1, National Cancer Institute (R21-CA12619-01, U24-CA-160019-01, and Interagency Agreement Y01-CN-05013-29), National Institute of Environmental Health Sciences of the NIH (R01ES022190), the Laboratory Directed Research and Development Program at Pacific Northwest National Laboratory, American Reinvestment and Recovery Act of 2009 and by the U.S. Department of Energy Office of Biological and Environmental Research Genome Sciences Program under the Pan-omics project. Work was performed in the W. R. Wiley Environmental Molecular Sciences Laboratory (EMSL), a DOE national scientific user facility at the Pacific Northwest National Laboratory (PNNL). PNNL is operated by Battelle for the DOE under contract DE-AC05-76RL0 1830.
References
- 1.(a) Johnson PV, Beegle LW, Kim HI, Eiceman GA, Kanik I. Ion mobility spectrometry in space exploration. Int J Mass Spectrom. 2007;262(1–2):1–15. [Google Scholar]; (b) Kanu AB, Dwivedi P, Tam M, Matz L, Hill HH., Jr Ion mobility-mass spectrometry. Journal of Mass Spectrometry. 2008;43(1):1–22. doi: 10.1002/jms.1383. [DOI] [PubMed] [Google Scholar]; (c) Armenta S, Alcala M, Blanco M. A review of recent, unconventional applications of ion mobility spectrometry (IMS) Analytica Chimica Acta. 2011;703(2):114–123. doi: 10.1016/j.aca.2011.07.021. [DOI] [PubMed] [Google Scholar]; (d) Buryakov IA. Detection of explosives by ion mobility spectrometry. Journal of Analytical Chemistry. 2011;66(8):674–694. [Google Scholar]; (e) Zhong Y, Hyung S-J, Ruotolo BT. Ion mobility-mass spectrometry for structural proteomics. Expert Review of Proteomics. 2012;9(1):47–58. doi: 10.1586/epr.11.75. [DOI] [PMC free article] [PubMed] [Google Scholar]
- 2.McDaniel EW, Mason EA. The Mobility and Diffusion of Ions in Gases. Wiley; New York: 1973. [Google Scholar]
- 3.(a) Kemper P, Bowers M. A hybrid double-focusing mass spectrometer—High-pressure drift reaction cell to study thermal energy reactions of mass-selected ions. J Am Soc Mass Spectrom. 1990;1(3):197–207. [Google Scholar]; (b) Dugourd P, Hudgins RR, Clemmer DE, Jarrold MF. High-resolution ion mobility measurements. Rev Sci Instrum. 1997;68(2):1122–1129. [Google Scholar]; (c) Hudgins RR, Woenckhaus J, Jarrold MF. High resolution ion mobility measurements for gas phase proteins: correlation between solution phase and gas phase conformations. Int J Mass Spectrom. 1997;165:497–507. [Google Scholar]; (d) Liu YS, Valentine SJ, Counterman AE, Hoaglund CS, Clemmer DE. Injected-ion mobility analysis of biomolecules. Anal Chem. 1997;69(23):A728–A735. [Google Scholar]
- 4.(a) Eiceman GA, Karpas Z, Hill HH., Jr . Ion Mobility Spectrometry. 3. CRC Press; Boca Raton: 2013. p. 444. [Google Scholar]; (b) Ion Mobility Spectrometry - Mass Spectrometry: Theory and Applications. CRC Press; Boca Raton: 2010. p. 374. [Google Scholar]; (c) Karpas Z. Applications of ion mobility spectrometry (IMS) in the field of foodomics. Food Res Int. 2013;54(1):1146–1151. [Google Scholar]
- 5.Mason E, McDaniel E. Transport Properites of Ions in Gases. Wiley; New York: 1988. [Google Scholar]
- 6.(a) Kwasnik M, Fuhrer K, Gonin M, Barbeau K, Fernandez FM. Performance, resolving power, and radial ion distributions of a prototype nanoelectrospray ionization resistive glass atmospheric pressure ion mobility spectrometer. Anal Chem. 2007;79(20):7782–7791. doi: 10.1021/ac071226o. [DOI] [PubMed] [Google Scholar]; (b) Kwasnik M, Fernandez FM. Theoretical and experimental study of the achievable separation power in resistive-glass atmospheric pressure ion mobility spectrometry. Rapid Commun Mass Spectrom. 2010;24(13):1911–1918. doi: 10.1002/rcm.4592. [DOI] [PubMed] [Google Scholar]
- 7.Blase RC, Silveira JA, Gillig KJ, Gamage CM, Russell DH. Increased ion transmission in IMS: A high resolution, periodic-focusing DC ion guide ion mobility spectrometer. Int J Mass Spectrom. 2011;301(1–3):166–173. [Google Scholar]
- 8.(a) Loboda A. Novel ion mobility setup combined with collision cell and time-of-flight mass spectrometer. J Am Soc Mass Spectrom. 2006;17(5):691–699. doi: 10.1016/j.jasms.2006.01.013. [DOI] [PubMed] [Google Scholar]; (b) Guo YZ, Wang JX, Javahery G, Thomson BA, Siu KWM. Ion mobility spectrometer with radial collisional focusing. Anal Chem. 2005;77(1):266–275. doi: 10.1021/ac048974n. [DOI] [PubMed] [Google Scholar]
- 9.(a) Thalassinos K, Slade SE, Jennings KR, Scrivens JH, Giles K, Wildgoose J, Hoyes J, Bateman RH, Bowers MT. Ion mobility mass spectrometry of proteins in a modified commercial mass spectrometer. Int J Mass Spectrom. 2004;236(1–3):55–63. [Google Scholar]; (b) Bush MF, Campuzano IDG, Robinson CV. Ion Mobility Mass Spectrometry of Peptide Ions: Effects of Drift Gas and Calibration Strategies. Anal Chem. 2012;84(16):7124–7130. doi: 10.1021/ac3014498. [DOI] [PubMed] [Google Scholar]
- 10.Tang K, Shvartsburg AA, Lee HN, Prior DC, Buschbach MA, Li FM, Tolmachev AV, Anderson GA, Smith RD. High-sensitivity ion mobility spectrometry/mass spectrometry using electrodynamic ion funnel interfaces. Anal Chem. 2005;77(10):3330–3339. doi: 10.1021/ac048315a. [DOI] [PMC free article] [PubMed] [Google Scholar]
- 11.(a) Kemper PR, Dupuis NF, Bowers MT. A new, higher resolution, ion mobility mass spectrometer. Int J Mass Spectrom. 2009;287(1–3):46–57. [Google Scholar]; (b) Koeniger SL, Merenbloom SI, Valentine SJ, Jarrold MF, Udseth HR, Smith RD, Clemmer DE. An IMS-IMS analogue of MS-MS. Anal Chem. 2006;78(12):4161–74. doi: 10.1021/ac051060w. [DOI] [PubMed] [Google Scholar]
- 12.May JC, Goodwin CR, Lareau NM, Leaptrot KL, Morris CB, Kurulugama RT, Mordehai A, Klein C, Barry W, Darland E, Overney G, Imatani K, Stafford GC, Fjeldsted JC, McLean JA. Conformational Ordering of Biomolecules in the Gas Phase: Nitrogen Collision Cross Sections Measured on a Prototype High Resolution Drift Tube Ion Mobility-Mass Spectrometer. Anal Chem. 2014;86(4):2107–2116. doi: 10.1021/ac4038448. [DOI] [PMC free article] [PubMed] [Google Scholar]
- 13.Clowers BH, Ibrahim YM, Prior DC, Danielson WF, 3rd, Belov ME, Smith RD. Enhanced ion utilization efficiency using an electrodynamic ion funnel trap as an injection mechanism for ion mobility spectrometry. Anal Chem. 2008;80(3):612–23. doi: 10.1021/ac701648p. [DOI] [PMC free article] [PubMed] [Google Scholar]
- 14.(a) Belov ME, Buschbach MA, Prior DC, Tang KQ, Smith RD. Multiplexed ion mobility spectrometry-orthogonal time-of-flight mass spectrometry. Anal Chem. 2007;79(6):2451–2462. doi: 10.1021/ac0617316. [DOI] [PMC free article] [PubMed] [Google Scholar]; (b) Belov ME, Clowers BH, Prior DC, Danielson WF, 3rd, Liyu AV, Petritis BO, Smith RD. Dynamically multiplexed ion mobility time-of-flight mass spectrometry. Anal Chem. 2008;80(15):5873–83. doi: 10.1021/ac8003665. [DOI] [PMC free article] [PubMed] [Google Scholar]
- 15.Ibrahim YM, Belov ME, Tolmachev AV, Smith RD. Higher-Pressure Ion Funnel Trap Interface for Orthogonal Time-of-Flight Mass Spectrometry. Anal Chem. 2007;79:7845–7852. doi: 10.1021/ac071091m. [DOI] [PMC free article] [PubMed] [Google Scholar]
- 16.Ibrahim YM, Prior DC, Baker ES, Smith RD, Belov ME. Characterization of an Ion Mobility-Multiplexed Collision Induced Dissociation-Tandem Time-of-Flight Mass Spectrometry Approach. Int J Mass Spectrom. 2010;293(1–3):34–44. doi: 10.1016/j.ijms.2010.03.009. [DOI] [PMC free article] [PubMed] [Google Scholar]
- 17.Shah AR, Davidson J, Monroe ME, Mayampurath AM, Danielson WF, Shi Y, Robinson AC, Clowers BH, Belov ME, Anderson GA, Smith RD. An Efficient Data Format for Mass Spectrometry-Based Proteomics. J Am Soc Mass Spectrom. 2010;21(10):1784–1788. doi: 10.1016/j.jasms.2010.06.014. [DOI] [PubMed] [Google Scholar]
- 18.Belov ME, Buschbach MA, Prior DC, Tang K, Smith RD. Multiplexed ion mobility spectrometry-orthogonal time-of-flight mass spectrometry. Anal Chem. 2007;79(6):2451–62. doi: 10.1021/ac0617316. [DOI] [PMC free article] [PubMed] [Google Scholar]
- 19.Clowers BH, Belov ME, Prior DC, Danielson WF, 3rd, Ibrahim YM, Smith RD. Pseudorandom sequence modifications for ion mobility orthogonal time-of-flight mass spectrometry. Anal Chem. 2008;80(7):2464–73. doi: 10.1021/ac7022712. [DOI] [PMC free article] [PubMed] [Google Scholar]
- 20.Baker ES, Burnum-Johnson KE, Jacobs JM, Diamond DL, Brown RN, Ibrahim YM, Orton DJ, Piehowski PD, Purdy DE, Moore RJ, Danielson WF, Monroe ME, Crowell KL, Slysz GW, Gritsenko MA, Sandoval JD, LaMarche BL, Matzke MM, Webb-Robertson B-JM, Simmons BC, McMahon BJ, Bhattacharya R, Perkins JD, Carithers RL, Strom S, Self SG, Katze MG, Anderson GA, Smith RD. Advancing the High Throughput Identification of Disease Specific Protein Signatures Using Multiplexed Ion Mobility Spectrometry. Molecular & Cellular Proteomics. 2014;13(4):1119–1127. doi: 10.1074/mcp.M113.034595. [DOI] [PMC free article] [PubMed] [Google Scholar]
- 21.Revercomb HE, Mason EA. THEORY OF PLASMA CHROMATOGRAPHY GASEOUS ELECTROPHORESIS - REVIEW. Anal Chem. 1975;47(7):970–983. [Google Scholar]
- 22.Baker ES, Clowers BH, Li F, Tang K, Tolmachev AV, Prior DC, Belov ME, Smith RD. Ion Mobility Spectrometry-Mass Spectrometry Performance Using Electrodynamic Ion Funnels and Elevated Drift Gas Pressures. J Am Soc Mass Spectrom. 2007 doi: 10.1016/j.jasms.2007.03.031. [DOI] [PMC free article] [PubMed] [Google Scholar]
- 23.Siems WF, Wu C, Tarver EE, Hill HH, Jr, Larsen PR, McMinn DG. Measuring the Resolving Power of Ion Mobility Spectrometers. Anal Chem. 1994;66(23):4195–4201. [Google Scholar]
- 24.(a) McLean JA, Ruotolo BT, Gillig KJ, Russell DH. Ion mobility-mass spectrometry: a new paradigm for proteomics. Int J Mass Spectrom. 2005;240(3):301–315. [Google Scholar]; (b) Fuhrer K, Gonin M, Gillig KJ, Egan T, Mccully MI, Schultz JA. Time-of-flight mass spectrometer for monitoring of fast processes. 6683299. US. 2004
- 25.(a) Shi TJ, Zhou JY, Gritsenko MA, Hossain M, Camp DG, Smith RD, Qian WJ. IgY14 and Super Mix immunoaffinity separations coupled with liquid chromatography-mass spectrometry for human plasma proteomics biomarker discovery. Methods. 2012;56(2):246–253. doi: 10.1016/j.ymeth.2011.09.001. [DOI] [PMC free article] [PubMed] [Google Scholar]; (b) Qian WJ, Kaleta DT, Petritis BO, Jiang HL, Liu T, Zhang X, Mottaz HM, Varnum SM, Camp DG, Huang L, Fang XM, Zhang WW, Smith RD. Enhanced Detection of Low Abundance Human Plasma Proteins Using a Tandem IgY12-SuperMix Immunoaffinity Separation Strategy. Molecular & Cellular Proteomics. 2008;7(10):1963–1973. doi: 10.1074/mcp.M800008-MCP200. [DOI] [PMC free article] [PubMed] [Google Scholar]; (c) Zhou JY, Petritis BO, Petritis K, Norbeck AD, Weitz KK, Moore RJ, Camp DG, Kulkarni RN, Smith RD, Qian WJ. Mouse-Specific Tandem IgY7-SuperMix Immunoaffinity Separations for Improved LC-MS/MS Coverage of the Plasma Proteome. J Proteome Res. 2009;8(11):5387–5395. doi: 10.1021/pr900564f. [DOI] [PMC free article] [PubMed] [Google Scholar]
- 26.Prost SA, Crowell KL, Baker ES, Ibrahim YM, Clowers BH, Monroe ME, Anderson GA, Smith RD. Detecting and Removing Data Artifacts in Hadamard Transform Ion Mobility-Mass Spectrometry Measurements. J Am Soc Mass Spectrom. 2014 doi: 10.1007/s13361-014-0895-y. [DOI] [PMC free article] [PubMed] [Google Scholar]
- 27.Jaitly N, Mayampurath A, Littlefield K, Adkins JN, Anderson GA, Smith RD. Decon2LS: An open-source software package for automated processing and visualization of high resolution mass spectrometry data. Bmc Bioinformatics. 2009;10 doi: 10.1186/1471-2105-10-87. [DOI] [PMC free article] [PubMed] [Google Scholar]
- 28.Crowell KL, Slysz GW, Baker ES, LaMarche BL, Monroe ME, Ibrahim YM, Payne SH, Anderson GA, Smith RD. LC-IMS-MS Feature Finder: detecting multidimensional liquid chromatography, ion mobility and mass spectrometry features in complex datasets. Bioinformatics. 2013;29(21):2804–2805. doi: 10.1093/bioinformatics/btt465. [DOI] [PMC free article] [PubMed] [Google Scholar]
- 29.LaMarche BL, Crowell KL, Jaitly N, Petyuk VA, Shah AR, Polpitiya AD, Sandoval JD, Kiebel GR, Monroe ME, Callister SJ, Metz TO, Anderson GA, Smith RD. MultiAlign: a multiple LC-MS analysis tool for targeted omics analysis. Bmc Bioinformatics. 2013;14 doi: 10.1186/1471-2105-14-49. [DOI] [PMC free article] [PubMed] [Google Scholar]
Associated Data
This section collects any data citations, data availability statements, or supplementary materials included in this article.


