

Abstract
IMPORTANCE
Small clinical trials have shown that noninvasive ventilation (NIV) is efficacious in reducing the need for intubation and improving short-term survival among patients with severe exacerbations of chronic obstructive pulmonary disease (COPD). Little is known, however, about the effectiveness of NIV in routine clinical practice.
OBJECTIVE
To compare the outcomes of patients with COPD treated with NIV to those treated with invasive mechanical ventilation (IMV).
DESIGN, SETTING, AND PARTICIPANTS
This was a retrospective cohort study of 25 628 patients hospitalized for exacerbation of COPD who received mechanical ventilation on the first or second hospital day at 420 US hospitals participating in the Premier Inpatient Database.
EXPOSURES
Initial ventilation strategy.
MAIN OUTCOMES AND MEASURES
In-hospital mortality, hospital-acquired pneumonia, hospital length of stay and cost, and 30-day readmission.
RESULTS
In the study population, a total of 17 978 (70%) were initially treated with NIV on hospital day 1 or 2. When compared with those initially treated with IMV, NIV-treated patients were older, had less comorbidity, and were less likely to have concomitant pneumonia present on admission. In a propensity-adjusted analysis, NIV was associated with lower risk of mortality than IMV (odds ratio [OR] 0.54; [95% CI, 0.48–0.61]). Treatment with NIV was associated with lower risk of hospital-acquired pneumonia (OR, 0.53 [95% CI, 0.44–0.64]), lower costs (ratio, 0.68 [95% CI, 0.67–0.69]), and a shorter length of stay (ratio, 0.81 [95% CI, 0.79–0.82]), but no difference in 30-day all-cause readmission (OR, 1.04 [95% CI, 0.94–1.15]) or COPD-specific readmission (OR, 1.05 [95% CI, 0.91–1.22]). Propensity matching attenuated these associations. The benefits of NIV were similar in a sample restricted to patients younger than 85 years and were attenuated among patients with higher levels of comorbidity and concomitant pneumonia. Using the hospital as an instrumental variable, the strength of association between NIV and mortality was modestly attenuated (OR, 0.66 [95% CI, 0.47–0.91]). In sensitivity analyses, the benefit of NIV was robust in the face of a strong hypothetical unmeasured confounder.
CONCLUSIONS AND RELEVANCE
In a large retrospective cohort study, patients with COPD treated with NIV at the time of hospitalization had lower inpatient mortality, shorter length of stay, and lower costs compared with those treated with IMV.
Chronic obstructive pulmonary disease (COPD) affects 4% to 7% of US adults, results in more than 800 000 hospitalizations annually, and is the nation’s third leading cause of death.1–3 Treatment for patients hospitalized with exacerbation include supplemental oxygen, short-acting bronchodilators, systemic corticosteroids, and, in most instances, antibiotics.4–6 Meta-analyses of randomized clinical trials suggest that when administered to carefully selected patients, noninvasive ventilation (NIV) can reduce the risk of death by up to 55%,5,7 the only hospital-based intervention known to improve mortality. This benefit is thought to be mediated through the prevention of complications associated with invasive mechanical ventilation (IMV), including ventilator-associated pneumonia and barotrauma.8–10
Although NIV receives strong endorsement in clinical guidelines, surveys of pulmonologists and respiratory therapists in the United States and Canada have suggested that many eligible patients are not treated.11–15 More recently, an analysis of the Nationwide Inpatient Sample found that rates of NIV among patients with COPD had increased 4.5 fold between 1998 and 2008.16 However, whether the benefits observed in the highly controlled setting of a clinical trial are being achieved in routine clinical practice is less well known.17,18
Using data from a large network of US hospitals, we sought to compare the outcomes of patients with COPD who were treated with NIV with those treated with IMV. In addition, given the possibility of treatment effect heterogeneity suggested by earlier studies, we examined the association between ventilation strategy and outcome in clinical subgroups defined by age, comorbidity burden, and the presence of comorbid pneumonia.19
Methods
Design, Settings, and Patients
We conducted a retrospective cohort study of patients hospitalized from January 2008 through June 2011 at 420 structurally and geographically diverse US hospitals that participate in a voluntary, fee-supported database developed to support quality improvement (Premier Healthcare Informatics). The institutional review board at Baystate Medical Center approved the study. In addition to the information contained in the standard hospital discharge abstract (ie, UB-04), the database contains a date-indexed log of all items and services charged to the patient or their insurer, including medications, laboratory and radiologic tests, and therapeutic services. Data are collected electronically from participating sites, audited regularly to ensure data validity, and have been used extensively for outcomes research.20–22
We included patients 40 years or older who received a principal discharge diagnosis (International Classification of Disease, Ninth Revision, Clinical Modification code [ICD-9-CM]) consistent with an exacerbation of COPD (codes 491.21, 492.22, 491.8, 491.9, 492.8, 496) or a secondary diagnosis of COPD when accompanied by a principal diagnosis of acute respiratory failure (codes 518.81, 518.82, 518.84) and who were treated with mechanical ventilation within the first 2 hospital days (Figure 1).23 Patients were excluded if they were not treated with short-acting bronchodilators and systemic corticosteroids within the first 2 days of the hospital stay (to reduce the possibility that ICD-9-CM codes had misidentified patients) or if they had a contraindication to NIV (ie, respiratory arrest [code 799.1] acute myocardial infarction [410.x0], hypotension [785.5], arrhythmia [42.41–2], altered mental status [249.82, 572.2, 250.3, 348.3, 780.0], or facial trauma [802.x]) because they would not have been equally eligible to receive the treatment options being compared. On similar grounds, we excluded patients receiving palliative (code v66.7) or hospice care (from the database field source of admission) because they are preferentially treated with NIV and have a high risk of death. We excluded patients with sleep apnea because it is not possible to differentiate treatment of acute respiratory failure from continuation of home continuous or bilevel positive airway pressure devices. We also excluded patients who were transferred from or to another acute care facility, those with an attending physician from a specialty that would not be expected to treat COPD (eg, neurosurgery), and those with an Medicare Severity Diagnosis-Related Group inconsistent with COPD or its sequelae. For patients with multiple admissions during the study period, we selected a random admission to reduce the potential for survival bias associated with admission frequency.
Figure 1. Study Selection Criteria/Recruitment Table.
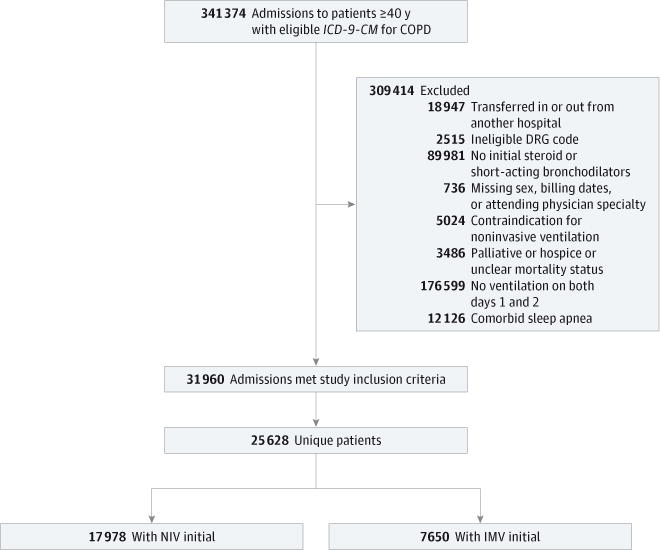
DRG indicates diagnosis-related group; ICD-9-CM, International Classification of Diseases, Ninth Revision, Clinical Modification; IMV, invasive mechanical ventilation; NIV, noninvasive ventilation.
Patient and Hospital Information
In addition to patient age, sex, race/ethnicity, marital status, and primary insurance, we recorded the presence of comorbidities using software provided by the Agency for Healthcare Research and Quality.24 Comorbidities were summarized into a score using methods described by Gagne et al.25 To assess COPD severity, we determined whether the patient had been hospitalized for COPD in the year prior to the index admission at the same hospital, had received invasive or non-invasive forms of mechanical ventilation, or had a diagnosis of cor pulmonale. Using the present-on-admission indicator, we also recorded whether pneumonia was diagnosed at the time of hospitalization. Since 2007 the present-on-admission indicators have been applied to principal and secondary diagnoses. Patients were considered to have pneumonia if the present-on-admission indicator was marked “yes.” Along with these patient factors, we recorded the specialty of the admitting and attending physician; for each hospital, we recorded the number of beds, teaching status, geographic region, whether it served an urban or rural population, and staffing ratios.
Receipt of Mechanical Ventilation and Other Treatments
In addition to using procedure codes to identify NIV (ICD-9-CM code 93.90) and IMV (ICD-9-CM codes 96.04, 96.70–96.72), we took advantage of the daily professional charges recorded by hospital respiratory therapists to assess whether patients were treated with NIV or IMV. We validated the NIV procedure codes and respiratory therapy charge codes by retrospective medical chart review of 200 patients who had been admitted to Baystate Medical Center with an ICD-9-CM code for respiratory failure from 2010 through 2011. Using ICD-9-CM codes alone yielded a sensitivity of 86% (95% CI, 81%–92%) and specificity of 92% (95% CI, 84%–98%). The approach of using ICD-9-CM procedure codes and/or respiratory therapist charges increased sensitivity to 99% (95% CI, 98%–100%) without reducing specificity (92% [95% CI, 84%–99%]).
On the basis of this analysis, we considered a patient to have received mechanical ventilation if there was a procedure code or respiratory therapist charge indicating treatment. The first 2 hospital days were chosen to assess exposure because in administrative data sets the duration of the first hospital day includes partial days that can vary in length. We defined the primary method of ventilation as the first method by date, and we noted any changes in ventilation that occurred throughout the hospitalization. In cases in which NIV and IMV were first recorded on the same day, we used billing charges on subsequent days to infer the initial therapy. For example, if subsequent days included only charges for IMV, we considered the initial therapy to be NIV. We excluded a small number of admissions (952) in which we were unable to determine the sequence of ventilation. We assessed the number of days each patient received assisted ventilation and whether the ventilator strategy changed during the course of the hospitalization. In addition to the type of mechanical ventilation, we evaluated exposure to medications administered within the first 2 days of the hospitalization that could serve as potential confounders.
Outcomes
The primary study outcome was in-hospital mortality. Secondary outcomes included length of stay, costs, and readmission within 1 month of discharge. We also assessed whether pneumonia developed after admission. For patients initially treated with NIV, we computed the incidence of NIV failure, defined as treatment with IMV after initial exposure to NIV.
Statistical Analysis
We calculated summary statistics using frequencies and proportions for categorical data and means, medians, and interquartile ranges for continuous variables. We compared the characteristics of patients who received NIV during the first 2 hospital days with those who underwent IMV using χ2 or Kruskal-Wallis tests.
We developed a nonparsimonious logistic regression model to estimate a patient’s propensity for treatment with NIV that included all patient and hospital characteristics and treatments for COPD, in which receipt of NIV by day 2 was considered the outcome. We assessed the propensity model by evaluating the balance of covariates in the matched cohort as well as the model C statistic (0.82 [95% CI, 0.82–0.83]). We then developed a series of hierarchical generalized linear models using PROC GLIMMIX (SAS Institute Inc) to assess the independent effect of NIV on the study outcomes, including a random hospital effect. Models were adjusted for patient, physician, and hospital characteristics, including the hospital proportion of ventilator starts that were noninvasive, other treatments, and the propensity for treatment with NIV. Logit link models were used for mortality, readmission, and hospital-acquired pneumonia. Identity link models were used for log-transformed length of stay and cost, producing length of stay and cost ratios for NIV to IMV treated. In addition, we applied 2 weighting methods: stabilized inverse-probability-of-treatment weighting, which estimates the treatment effect in a population with a risk factor distribution similar to the full study population, and standardized mortality ratio weighting, which estimates the effect in a population with a risk factor distribution similar to those actually treated with NIV.26,27 Finally, using a Greedy Match algorithm, each IMV-treated patient was matched with a patient with similar propensity who was treated with NIV.28 Conditional logistic regression was used to assess the association between exposure and outcome while adjusting for any remaining differences between groups (P < .05).
Instrumental Variable Analysis
To address concerns about residual unmeasured confounding, in which more severe cases of respiratory failure might preferentially be treated with IMV, we also performed a grouped-treatment analysis, an adaption of the instrumental variable method, by using the hospital as the instrument.29 We developed hierarchical models for mortality, hospital-acquired pneumonia, and readmission, substituting the hospital percentage of ventilator starts that were NIV in place of individual ventilation mode. This analysis was restricted to hospitals with at least 25 patients treated with ventilation.
Secondary and Sensitivity Analyses
We carried out several secondary analyses. First, we examined the association between type of ventilation and outcomes among patients within strata defined by tertiles of comorbidity burden. Second, we assessed for heterogeneity of effects when pneumonia was present at the time of admission. Finally, we analyzed the association between mode of ventilation and outcomes among patients younger than 85 years because the use of IMV was rare in those 85 years or older.
In a sensitivity analysis, we explored how the presence of a hypothetical unmeasured confounder might influence the effect estimate of NIV. Given the range of values we observed among the confounders in our study, we estimated that an influential unmeasured confounder would increase the odds of mortality by 1.5 to 3 times. Varying the prevalence of the confounder, we then quantified its effect using methods described by Lin et al.30 All analyses were carried out using the Statistical Analysis System (version 9.3; SAS Institute Inc).
Results
Among the 192 349 admissions that met our enrollment criteria, a total of 31 960 (16.6%) received ventilatory support on the first or second hospital day, including 25 628 unique patients. Among these patients, 17 978 (70.1%) were initially treated with NIV (Figure 1). When compared with those treated with IMV, patients treated with NIV were older, more likely to have had an admission for COPD in the year prior to the index admission (30.1% vs 23.9%; P < .001), and had a lower comorbidity score (Table 1 and Table 2). Patients spent a median (interquartile range) of 2 (1–4) days on NIV and 3 (2–5) on IMV. The incidence of NIV failure was 15.3%. In-hospital mortality rates were 4.8%, 8.6%, and 13.8% among those initially treated with NIV, IMV, and those who failed treatment with NIV, respectively.
Table 1.
Characteristics and Outcomes of the Patients Included in the Studya
| Patient Characteristic | All Ventilated Patients | Ventilation | P Value | |
|---|---|---|---|---|
| Noninvasive | Invasive | |||
| Age, mean, y | 68.5 | 69.0 | 67.4 | <.001 |
| Median (IQR) | 69 (61–77) | 69 (61–78) | 67 (60–75) | |
| Female | 14 513 (56.6) | 10 213 (56.8) | 4300 (56.2) | .38 |
| Race/ethnicity | ||||
| White | 18 246 (71.2) | 12 956 (72.1) | 5290 (69.2) | <.001 |
| Black | 2903 (11.3) | 1913 (10.6) | 990 (12.9) | |
| Hispanic | 814 (3.2) | 590 (3.3) | 224 (2.9) | |
| Other | 3665 (14.3) | 2519 (14.0) | 1146 (15.0) | |
| Marital status | ||||
| Married | 8866 (34.6) | 6282 (34.9) | 2584 (33.8) | .001 |
| Single | 14 026 (54.7) | 9858 (54.8) | 4168 (54.5) | |
| Other/missing | 2736 (10.7) | 1838 (10.2) | 898 (11.7) | |
| Insurance payer | ||||
| Medicare | 18 188 (71.0) | 13 052 (72.6) | 5136 (67.1) | <.001 |
| Medicaid | 2723 (10.6) | 1825 (10.2) | 898 (11.7) | |
| Private | 3167 (12.4) | 2158 (12.0) | 1009 (13.2) | |
| Uninsured | 900 (3.5) | 574 (3.2) | 326 (4.3) | |
| Other/unknown | 650 (2.5) | 369 (2.1) | 281 (3.7) | |
| Indicators of COPD severity | ||||
| Admission for COPD in past year | 7243 (28.3) | 5416 (30.1) | 1827 (23.9) | <.001 |
| Noninvasive ventilation in past year | 2844 (11.1) | 2249 (12.5) | 595 (7.8) | <.001 |
| Invasive mechanical ventilation in past year | 1566 (6.1) | 902 (5.0) | 664 (8.7) | <.001 |
| Pulmonary heart disease | 3165 (12.4) | 2309 (12.8) | 856 (11.2) | <.001 |
| Pneumonia present on admission | 6129 (23.9) | 3800 (21.1) | 2329 (30.4) | <.001 |
| Comorbiditiesb | ||||
| Congestive heart failure | 9070 (35.39) | 6142 (34.2) | 2928 (38.3) | <.001 |
| Diabetes mellitus | 8091 (31.6) | 5625 (31.3) | 2466 (32.2) | .14 |
| Deficiency anemias | 5716 (22.3) | 3725 (20.7) | 1991 (26.0) | <.001 |
| Depression | 4215 (16.5) | 3026 (16.8) | 1189 (15.5) | .12 |
| Renal failure | 3319 (13.0) | 2263 (12.6) | 1056 (13.8) | .01 |
| Hypothyroidism | 3053 (11.9) | 2194 (12.2) | 859 (11.2) | .03 |
| Obesity | 2990 (11.7) | 2125 (11.8) | 865 (11.3) | .24 |
| Other neurological disorders | 2435 (9.5) | 1610 (9.0) | 825 (10.8) | <.001 |
| Disease | ||||
| Pulmonary circulation | 2277 (8.9) | 1431 (8.0) | 846 (11.1) | <.001 |
| Peripheral vascular | 2316 (9.0) | 1595 (8.9) | 721 (9.4) | .16 |
| Valvular | 2007 (7.8) | 1319 (7.3) | 688 (9.0) | <.001 |
| Weight loss | 1966 (7.7) | 1190 (6.6) | 776 (10.1) | <.001 |
| Psychoses | 1808 (7.1) | 1247 (6.9) | 561 (7.3) | .26 |
| Alcohol abuse | 1374 (5.36) | 838 (4.7) | 536 (7.0) | <.001 |
| Comorbidity score | ||||
| ≤1 | 7457 (29.1) | 5576 (31.0) | 1881 (24.6) | <.001 |
| 2–3 | 8561 (33.4) | 6053 (33.7) | 2508 (32.8) | |
| ≥4 | 9610 (37.5) | 6349 (35.3) | 3261 (42.6) | |
| COPD therapies | ||||
| Short-acting β agonist | 25 388 (99.06) | 17 803 (99.0) | 7585 (99.2) | .35 |
| Short-acting anticholinergic agents | 23 657 (92.31) | 16 566 (92.1) | 7091 (92.7) | .13 |
| Methylxanthine bronchodilator | 2691 (10.5) | 2017 (11.2) | 674 (8.8) | <.001 |
| Mucolytic agents | 434 (1.69) | 315 (1.8) | 119 (1.6) | .26 |
| Antibiotics | ||||
| Quinolone | 14 480 (56.5) | 10 150 (56.5) | 4330 (56.6) | .83 |
| Cephalosporin (third or fourth generation) | 9153 (35.72) | 6266 (34.9) | 2887 (37.7) | <.001 |
| Macrolide | 8379 (32.7) | 5903 (32.8) | 2476 (32.4) | <.001 |
| Antipseudomonal penicillin | 3699 (14.4) | 2075 (11.5) | 1624 (21.2) | <.001 |
| Vancomycin | 3378 (13.2) | 1862 (10.4) | 1516 (19.8) | <.001 |
| Admitting physician specialty | ||||
| Family practice | 3778 (14.7) | 2765 (15.4) | 1013 (13.2) | <.001 |
| Hospital medicine | 4849 (18.9) | 3593 (20.0) | 1256 (16.4) | |
| Internal medicine | 10 717 (41.8) | 7778 (43.3) | 2939 (38.4) | |
| Pulmonary diseases or critical care medicine | 3527 (13.8) | 1987 (11.1) | 1540 (20.1) | |
| Other specialty | 2757 (10.8) | 1855 (10.3) | 902 (11.8) | |
| Outcomes | ||||
| Hospital acquired pneumonia | 679 (2.7) | 399 (2.2) | 280 (3.7) | <.001 |
| In-hospital mortality | 1518 (5.9) | 857 (4.8) | 661 (8.6) | <.001 |
| LOS, d | 7.1 | 6.4 | 8.9 | <.001 |
| Median (IQR) | 6 (3–9) | 5 (3–8) | 7 (4–11) | |
| Costs, US $ | 15 188 | 12 690 | 21 057 | <.001 |
| Median (IQR) | 10 586 (6396–17 761) | 8992 (5711–14 572) | 15 556 (9688–25 350) | |
| Readmission | ||||
| COPD-specific | 1344 (5.6) | 972 (5.7) | 372 (5.3) | .28 |
| All-cause | 3013 (12.5) | 2118 (12.4) | 895 (12.8) | .35 |
Abbreviations: COPD, chronic obstructive pulmonary disease; IQR, interquartile range; LOS, length of stay.
Data are given as number (percentage) except where indicated.
Additional comorbidities present in less than 5% of the sample: drug abuse, solid tumor without metastasis, rheumatoid arthritis/collagen vascular disease, liver disease, metastatic cancer, paralysis, chronic blood loss anemia, lymphoma, AIDS, and peptic ulcer disease with bleeding.
Table 2.
Hospital Characteristics and Outcomes of the Patients Included in the Studya
| Hospital Characteristic | All Ventilated Patients | Ventilation | P Value | |
|---|---|---|---|---|
| Noninvasive | Invasive | |||
| Rural/urban status | ||||
| Rural | 3910 (15.3) | 2954 (16.4) | 956 (12.5) | <.001 |
| Urban | 21 718 (84.7) | 15 024 (83.6) | 6694 (87.5) | |
| Bed size | ||||
| ≤200 | 4840 (18.9) | 3528 (19.6) | 1312 (17.2) | |
| 201–400 | 10 827 (42.3) | 7664 (42.6) | 3163 (41.3) | <.001 |
| >400 | 9961 (38.9) | 6786 (37.7) | 3175 (41.5) | |
| Teaching status | ||||
| Teaching | 8562 (33.4) | 5893 (32.8) | 2669 (34.9) | .001 |
| Nonteaching | 17 066 (66.6) | 12 085 (67.2) | 4981 (65.1) | |
| Region | ||||
| Midwest | 4032 (15.7) | 2737 (15.2) | 1295 (16.9) | |
| Northeast | 4658 (18.2) | 3122 (17.4) | 1536 (20.1) | <.001 |
| South | 12 083 (47.2) | 8737 (48.6) | 3346 (43.7) | |
| West | 4855 (18.9) | 3382 (18.8) | 1473 (19.3) | |
| Staffing ratiosb | ||||
| Hospitalist | ||||
| <1.4 | 5014 (19.6) | 3278 (18.2) | 1736 (22.7) | |
| 1.4–3.6 | 6768 (26.4) | 4952 (27.5) | 1816 (23.7) | <.001 |
| >3.6 | 6567 (25.6) | 4909 (27.3) | 1658 (21.7) | |
| Unknown | 7279 (28.4) | 4839 (26.9) | 2440 (31.9) | |
| Respiratory therapist | ||||
| <5.4 | 5307 (20.7) | 3654 (20.3) | 1653 (21.6) | |
| 5.4–8.5 | 7281 (28.4) | 5123 (28.5) | 2158 (28.2) | <.001 |
| >8.5 | 7450 (29.1) | 5440 (30.3) | 2010 (26.3) | |
| Unknown | 5590 (21.8) | 3761 (20.9) | 1829 (23.9) | |
| Nurse | ||||
| <107.7 | 4188 (16.3) | 3061 (17.0) | 1127 (14.7) | |
| 107.7–150.5 | 5833 (22.8) | 4313 (24.0) | 1520 (19.9) | <.001 |
| >150.5 | 8249 (32.2) | 5603 (31.2) | 2646 (34.6) | |
| Unknown | 7358 (28.7) | 5001 (27.8) | 2357 (30.8) | |
| Intensivist | ||||
| 0 | 6987 (27.3) | 5220 (29.0) | 1767 (23.1) | |
| >0–1.9 | 5621 (21.9) | 3856 (21.4) | 1765 (23.1) | <.001 |
| >1.9 | 4777 (18.6) | 3609 (20.1) | 1168 (15.3) | |
| Unknown | 8243 (32.2) | 5293 (29.4) | 2950 (38.6) | |
| Outcomes | ||||
| Hospital-acquired pneumonia | 679 (2.7) | 399 (2.2) | 280 (3.7) | <.001 |
| In-hospital mortality | 1518 (5.9) | 857 (4.8) | 661 (8.6) | <.001 |
| LOS, d | 7.1 | 6.4 | 8.9 | <.001 |
| Median (IQR) | 6 (3–9) | 5 (3–8) | 7 (4–11) | |
| Costs, US $ | 15 188 | 12 690 | 21 057 | <.001 |
| Median (IQR) | 10 586 (6396–17 761) | 8992 (5711–14 572) | 15 556 (9688–25 350) | |
| Readmission | ||||
| COPD-specific | 1344 (5.6) | 972 (5.7) | 372 (5.3) | .28 |
| All-cause | 3013 (12.5) | 2118 (12.4) | 895 (12.8) | .35 |
Abbreviations: COPD, chronic obstructive pulmonary disease; IQR, interquartile range; LOS, length of stay.
Data are given as number (percentage) except where indicated.
Each staff member ratio is full-time equivalent to 100 beds.
Results of Propensity-Adjusted, Propensity-Matched, and Instrumental Variable Analyses
In models that adjusted for patient, hospital, and physician characteristics, including the propensity for treatment with NIV and receipt of other treatments, the odds of in-hospital mortality among patients treated with NIV was significantly lower than among those who received IMV (odds ratio [OR], 0.54 [95% CI, 0.48–0.61]) (Figure 2). Treatment with NIV was associated with a lower risk of hospital-acquired pneumonia (OR, 0.53 [95% CI, 0.44–0.64]), a 19% shorter length of stay (ratio, 0.81 [95% CI, 0.79–0.82], an average absolute reduction of 1.6 days), and 32% lower costs (ratio 0.68 [95% CI, 0.67–0.69], an average absolute reduction of $5673). There was no association between mode of ventilation and the risk of COPD-specific or all-cause readmission within 1 month of discharge. Estimates based on stabilized inverse-probability and standardized mortality ratio weighting were similar (Figure 2).
Figure 2. Association Between Noninvasion Ventilation and Outcomes.
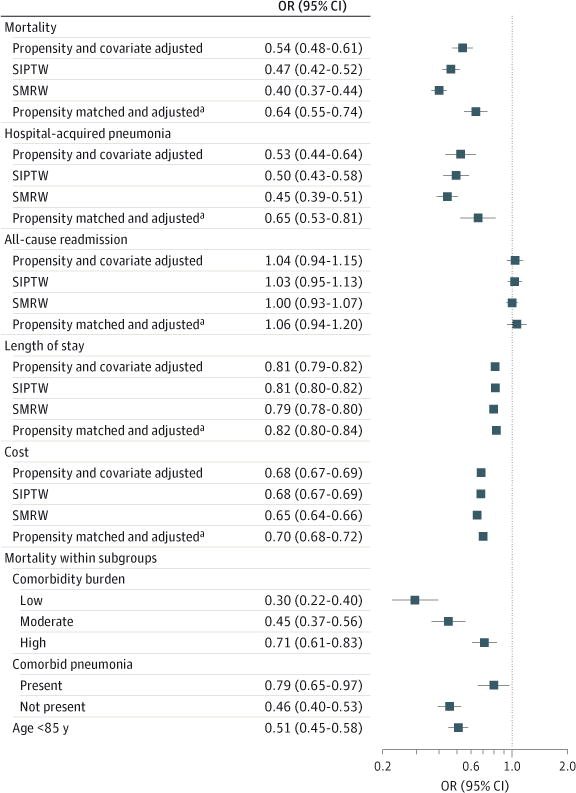
Association between noninvasive ventilation and mortality, hospital-acquired pneumonia, readmission, length of stay, and costs, overall and inpatient stratified comorbidity burden, comorbid pneumonia, and among those younger than 85 years. Subgroup analyses are covariate adjusted. COPD indicates chronic obstructive pulmonary disease; DRG, diagnosis-related group; ICD-9-CM, International Classification of Diseases, Ninth Revision, Clinical Modification; IMV, invasive mechanical ventilation; NIV, noninvasive ventilation; SIPTW, stabilized inverse-probability-of-treatment weighting; SMRW, standardized mortality ratio weighting.
aAdjusted for unbalanced covariates.
Overall, 72% of patients treated with IMV were matched with a patient of similar propensity who was treated with NIV (eFigure 1 in the Supplement). The matched sample was balanced for most factors (Table 3 and Table 4). Conditional logistic regression models adjusting for unbalanced covariates on the matched sample yielded modestly attenuated associations (OR for mortality, 0.64 [95% CI, 0.55–0.74]) (Figure 2).
Table 3.
Characteristics and Outcomes of Patients in the Propensity-Matched Sample
| Patient Characteristic | Ventilationa | P Value | |
|---|---|---|---|
| Noninvasive (n = 5225) | Invasive (n = 5225) | ||
| Age, mean, y | 67.8 | 67.7 | .99 |
| Median (IQR) | 68 (60–76) | 68 (60–76) | |
| Female | 3033 (54.9) | 3091 (55.9) | .27 |
| Race/ethnicity | |||
| White | 3824 (69.2) | 3846 (69.6) | .93 |
| Black | 714 (12.9) | 717 (13.0) | |
| Hispanic | 161 (2.9) | 161 (2.9) | |
| Other | 826 (15.0) | 801 (14.5) | |
| Marital status | |||
| Married | 1936 (35.0) | 1914 (34.6) | .53 |
| Single | 2990 (54.1) | 2975 (53.8) | |
| Other/missing | 599 (10.8) | 636 (11.5) | |
| Insurance payer | |||
| Medicare | 3794 (68.7) | 3782 (68.5) | .97 |
| Medicaid | 619 (11.2) | 628 (11.4) | |
| Private | 753 (13.6) | 740 (13.4) | |
| Uninsured | 219 (4.0) | 229 (4.1) | |
| Other/unknown | 140 (2.5) | 146 (2.6) | |
| Indicator of COPD severity | |||
| Admission for COPD in past year | 1381 (25.0) | 1368 (24.8) | .77 |
| Noninvasive ventilation in past year | 479 (8.7) | 477 (8.6) | .95 |
| Invasive mechanical ventilation in past year | 403 (7.3) | 388 (7.0) | .58 |
| Pulmonary heart disease | 593 (10.7) | 603 (10.9) | .76 |
| Pneumonia present on admission | 1638 (29.6) | 1579 (28.6) | .22 |
| Comorbiditiesb | |||
| Congestive heart failure | 2131 (38.6) | 2115 (38.3) | .75 |
| Diabetes mellitus | 1780 (32.2) | 1775 (32.1) | .92 |
| Deficiency anemias | 1404 (25.4) | 1365 (24.7) | .39 |
| Depression | 943 (17.1) | 875 (15.8) | .08 |
| Renal failure | 774 (14.0) | 780 (14.1) | .87 |
| Hypothyroidism | 676 (12.2) | 597 (10.8) | .02 |
| Obesity | 635 (11.5) | 621 (11.2) | .67 |
| Other neurological disorders | 593 (10.7) | 570 (10.3) | .48 |
| Pulmonary circulation disease | 574 (10.4) | 561 (10.2) | .68 |
| Weight loss | 542 (9.8) | 500 (9.0) | .17 |
| Peripheral vascular disease | 503 (9.1) | 527 (9.5) | .43 |
| Valvular disease | 457 (8.3) | 460 (8.3) | .92 |
| Psychoses | 427 (7.7) | 389 (7.0) | .17 |
| Alcohol abuse | 354 (6.4) | 350 (6.3) | .88 |
| Comorbidity score | |||
| ≤1 | 1504 (27.2) | 1396 (25.3) | .07 |
| 2–3 | 1749 (31.7) | 1797 (32.5) | |
| ≥4 | 2272 (41.1) | 2332 (42.2) | |
| COPD therapies | |||
| Short-acting β-agonist | 5453 (98.7) | 5471 (99.0) | .11 |
| Short-acting anticholinergic agents | 5112 (92.5) | 5110 (92.5) | .94 |
| Methylxanthine bronchodilator | 489 (8.9) | 519 (9.4) | .32 |
| Mucolytic agents | 87 (1.6) | 97 (1.8) | .46 |
| Antibiotics | |||
| Quinolone | 3083 (55.8) | 3150 (57.0) | .20 |
| Cephalosporin (third or fourth generation) | 2090 (37.8) | 2065 (37.4) | .62 |
| Macrolide | 1836 (33.2) | 1758 (31.8) | .11 |
| Antipseudomonal penicillin | 1141 (20.7) | 1068 (19.3) | .08 |
| Vancomycin | 1022 (18.5) | 977 (17.7) | .27 |
| Admitting physician specialty | |||
| Family practice | 741 (13.4) | 759 (13.7) | .90 |
| Hospital medicine | 982 (17.8) | 979 (17.7) | |
| Internal medicine | 2219 (40.2) | 2230 (40.4) | |
| Pulmonary diseases or critical care medicine | 981 (17.8) | 944 (17.1) | |
| Other specialty | 602 (10.9) | 613 (11.1) | |
| Outcomes | |||
| Hospital-acquired pneumonia | 139 (2.5) | 210 (3.8) | <.001 |
| In-hospital mortality | 334 (6.0) | 506 (9.2) | <.001 |
| LOS, d | 7.2 | 8.9 | <.001 |
| Median (IQR) | 6 (4–9) | 7 (4–11) | |
| Costs, US $ | 14 812 | 21 202 | <.001 |
| Median (IQR) | 10 408 (6460–16702) | 15 677 (9882–25362) | |
| Readmission | |||
| COPD-specific | 288 (5.5) | 272 (5.4) | .78 |
| All-cause | 689 (13.3) | 635 (12.7) | .35 |
Abbreviations: COPD, chronic obstructive pulmonary disease; IQR, interquartile range; LOS, length of stay.
Data are given as number (percentage) except where indicated.
Additional comorbidities present in less than 5% of the sample, drug abuse, solid tumor without metastasis, rheumatoid arthritis/collagen vascular disease, liver disease, metastatic cancer, paralysis, chronic blood loss anemia, lymphoma, AIDS, and peptic ulcer disease with bleeding.
Table 4.
Hospital Characteristics and Outcomes of Patients in the Propensity-Matched Sample
| Hospital Characteristic | Ventilationa | P Value | |
|---|---|---|---|
| Noninvasive (n = 5225) | Invasive (n = 5225) | ||
| Rural or urban status | |||
| Rural | 715 (12.9) | 732 (13.2) | .63 |
| Urban | 4810 (87.1) | 4793 (86.8) | |
| Bed size | |||
| ≤200 | 1038 (18.8) | 1020 (18.5) | .77 |
| 201–400 | 2351 (42.6) | 2333 (42.2) | |
| >400 | 2136 (38.7) | 2172 (39.3) | |
| Teaching status | |||
| Teaching | 1922 (34.4) | 1917 (34.7) | .92 |
| Nonteaching | 3603 (65.2) | 3608 (65.3) | |
| Region | |||
| Midwest | 884 (16.0) | 868 (15.7) | .92 |
| Northeast | 1133 (20.5) | 1114 (20.2) | |
| South | 2535 (45.9) | 2553 (46.2) | |
| West | 973 (17.6) | 990 (17.9) | |
| Staffing ratiosb | |||
| Hospitalist | |||
| <1.4 | 1101 (19.9) | 1070 (19.4) | .89 |
| 1.4–3.6 | 1443 (26.1) | 1460 (26.4) | |
| >3.6 | 1299 (23.5) | 1298 (23.5) | |
| Unknown | 1682 (30.4) | 1697 (30.7) | |
| Respiratory therapist | |||
| <5.4 | 1119 (20.3) | 1107 (20.0) | .94 |
| 5.4–8.5 | 1557 (28.2) | 1535 (27.8) | |
| >8.5 | 1609 (29.1) | 1627 (29.4) | |
| Unknown | 1240 (22.4) | 1256 (22.7) | |
| Nurse | |||
| <107.7 | 832 (15.1) | 833 (15.1) | .99 |
| 107.7–150.5 | 1237 (22.4) | 1221 (22.1) | |
| >150.5 | 1769 (32.0) | 1776 (32.1) | |
| Unknown | 1687 (30.5) | 1695 (30.7) | |
| Intensivist | |||
| 0 | 1471 (26.6) | 1470 (26.6) | .98 |
| >0–1.9 | 1294 (23.4) | 1296 (23.5) | |
| >1.9 | 827 (15.0) | 841 (15.2) | |
| Unknown | 1933 (35.0) | 1918 (34.7) | |
| Outcomes | |||
| Hospital-acquired pneumonia | 139 (2.5) | 210 (3.8) | <.001 |
| In-hospital mortality | 334 (6.0) | 506 (9.2) | <.001 |
| LOS, d | 7.2 | 8.9 | <.001 |
| Median (IQR) | 6 (4–9) | 7 (4–11) | |
| Costs, US $ | 14 812 | 21 202 | <.001 |
| Median (IQR) | 10 408 (6460–16702) | 15 677 (9882–25362) | |
| Readmission | |||
| COPD-specific | 288 (5.5) | 272 (5.4) | .78 |
| All-cause | 689 (13.3) | 635 (12.7) | .35 |
Abbreviations: COPD, chronic obstructive pulmonary disease; IQR, interquartile range; LOS, length of stay.
Data are given as number (percentage) except where indicated.
Each staff member ratio is full-time equivalent to 100 beds.
Across the 286 hospitals that contributed at least 25 cases requiring ventilatory assistance, the percentage of ventilated patients who were treated with NIV by the second hospital day ranged from 34% at the 10th percentile to 87% at the 90th (eFigure 2 in the Supplement). Using the hospital as an instrumental variable and adjusting for other potential confounders, the mortality benefit of NIV was modestly attenuated (OR, 0.66 [95% CI, 0.47–0.91]).
Analyses Stratified by Comorbidity Score, Pneumonia, and Restricted to Patients Younger Than 85 Years
The relative advantage of NIV was attenuated in the face of higher comorbidity burden and among those with pneumonia present on admission (Figure 2). Finally, the association between receipt of NIV and mortality was similar in an analysis restricted to patients younger than 85 years.
Sensitivity Analysis
Sensitivity analysis demonstrates the extent to which our estimates of the association between NIV and mortality might be influenced by residual confounding (Figure 3). If the OR for mortality associated with a hypothetical unmeasured confounder was 2, a difference in prevalence between patients treated with IMV and NIV of greater than 70% would be necessary to result in a nonsignificant effect for NIV on mortality.
Figure 3. Sensitivity Analysis to Estimate the Potential Impact of Unmeasured Confounding.
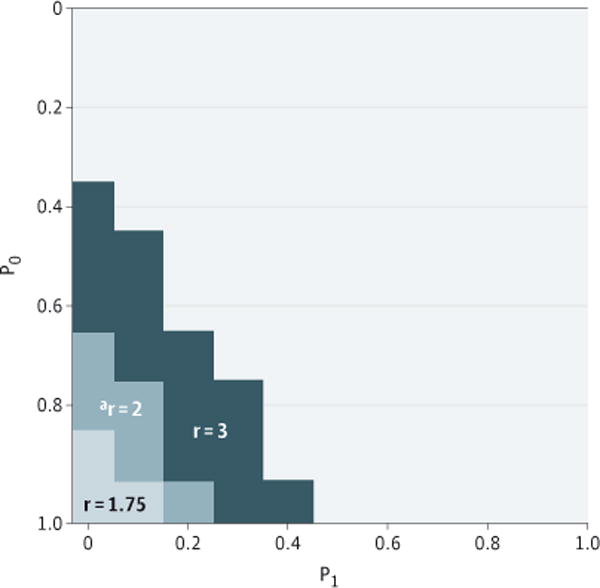
The odds of outcome related to unmeasured confounder are indicated by r; P0, proportion of invasively ventilated patients with the confounder; P1, proportion of noninvasively ventilated patients with the confounder. For example, an unmeasured confounder, “a” with r = 2 times the odds for mortality would have to be present in P0 ≅ 80% of the invasively ventilated patients, and less than P1 ≅ 15%of the noninvasively ventilated patients to render the mortality impact for invasive ventilation nonsignificant.
Discussion
In this study of more than 25 000 patients with COPD who received mechanical ventilation at over 400 US hospitals between 2008 and 2011, we found that those initially treated with NIV had a lower risk of death or of developing pneumonia during the hospitalization, a shorter length of stay, and lower costs compared with those who initially underwent invasive ventilation. The relative advantage of NIV was attenuated among patients with higher comorbidity burden and in the subgroup of patients who had pneumonia present at the time of hospital admission. These findings were robust in the presence of a strong hypothetical unmeasured confounder and were corroborated in an instrumental variable analysis intended to address the threat of residual confounding owing to unmeasured factors.
While randomized clinical trials and meta-analyses have demonstrated that, under ideal circumstances, NIV can reduce the risk of complications and improve short-term survival when compared with IMV, fewer than 1000 patients have been enrolled in all of the randomized clinical trials to date, and strict inclusion and exclusion criteria reduce generalizability to broader patient populations. Using a prospective cohort design at 42 intensive care units in France, Carlucci et al17 found a reduced incidence of nosocomial pneumonia and an odds of mortality of 0.16 associated with receipt of NIV instead of IMV. More recently, using data from the 2006–2008 Nationwide Emergency Department Sample, Tsai et al18 compared the effectiveness of invasive and noninvasive forms of ventilation in patients with a diagnosis of COPD and respiratory failure. They also reported that NIV was associated with odds of mortality of 0.54 as well as a shorter length of stay and lower hospital charges.
Our results confirm and extend these findings, using a richer data set that allowed us to overcome prior limitations, including concerns about the validity of ICD-9-CM codes to identify patients with COPD, to identify exposure to NIV with greater accuracy, and to adjust for additional potential confounders, including important markers of disease severity and other medications and treatments. Furthermore, using present-on-admission indicators that were not available in earlier data sets, we were able to examine the association between NIV and hospital-acquired pneumonia, one of the pathways through which NIV is thought to lower mortality. Our unique data set also enabled us to report on readmission outcomes. Our findings have a number of implications. Most important, although our estimate of the effect of NIV on mortality was more modest than estimates in some previous reports, our study suggests that the benefits observed in clinical trials are largely being achieved in the community settings represented by hospitals in our data set. Potential explanations for the smaller effect include differences in patient selection and ventilator management practices between protocol-guided clinical trials and contemporary practice sites. Another possibility is that the risks associated with conventional IMV have lessened over time, thereby mitigating some of the relative advantage of NIV.31 The interaction we observed with higher levels of comorbidity and pneumonia is another finding that could have substantial clinical significance because nearly 1 in 5 patients included in the study had pneumonia. This corroborates the finding of an earlier study that identified pneumonia as a risk factor for NIV failure19 and supports the results of some trials that have suggested that NIV may not be superior to IMV in pneumonia.32,33 Unlike the case in acute exacerbation of COPD, patients with pneumonia are less likely to have rapid reversal of respiratory failure that best lends itself to NIV treatment. Finally, the high mortality associated with NIV failure (13.8%) was also observed by Chandra et al16 and may reflect use of NIV in patients with pneumonia or other comorbidities that increase the risk of NIV failure. This also raises the possibility that NIV may have been used inappropriately in some patients who should have been intubated initially and highlights the need for careful patient selection.
Despite these striking results, our study should be interpreted in light of several limitations. First, as with all observational comparative effectiveness research, it is possible that the association we found between NIV and lower mortality reflects residual confounding by indication. While we adjusted for numerous patient, physician, and hospital factors, we did not have physiologic measurements, such as vital signs or arterial blood gas analysis, that could have differed between patients in the 2 groups. We attempted to reduce this concern by using a rich data set and by applying state-of-the-art analytic methods. Our findings proved to be robust to a grouped treatment analysis, an adaptation of the instrumental variable approach, and in the face of a strong hypothetical unmeasured confounder. The validity of the grouped treatment analysis requires an assumption that the hospital preference for NIV was not associated with other unmeasured aspects of care that could influence outcomes. While it is possible that hospitals that frequently use NIV may also be more likely to adapt other evidence-based therapies, the effects estimates produced by this analysis were closer to the null than any of the propensity-based approaches. Second, we did not have information about the do-not-resuscitate status of patients or preferences for end-of-life care. To the extent that NIV may be preferred among patients with the highest risk for mortality, our results may have underestimated the benefit of treatment.34 Finally, we studied inpatient outcomes only and did not have access to information about the longer-term effects of the choice of ventilation besides readmission. Past clinical trials, however, have also largely confined themselves to short-term outcomes.
Conclusions
Among patients hospitalized for exacerbation of COPD who are treated with mechanical ventilation, receipt of NIV is associated with better outcomes than IMV. Additional research is needed to evaluate the impact of chronic comorbidity and concomitant pneumonia on patient outcomes and to compare the long-term outcomes of patients treated with invasive and noninvasive ventilation.
Supplementary Material
Acknowledgments
Funding/Support: This work was supported by grant 1R18HL108810-01 from the National Heart, Lung, and Blood Institute of the National Institutes of Health (NIH).
Role of the Funder/Sponsor: The NIH had no role in the design and conduct of the study; collection, management, analysis, and interpretation of the data; preparation, review, or approval of the manuscript; and decision to submit the manuscript for publication.
Footnotes
Author Contributions: Dr Lindenauer had full access to all of the data in the study and takes responsibility for the integrity of the data and the accuracy of the data analysis.
Study concept and design: Lindenauer, Stefan, Pekow, Rothberg, Hill.
Acquisition, analysis, or interpretation of data: Lindenauer, Stefan, Shieh, Pekow, Hill.
Drafting of the manuscript: Lindenauer, Stefan, Hill. Critical revision of the manuscript for important intellectual content: Lindenauer, Shieh, Pekow, Rothberg, Hill.
Statistical analysis: Stefan, Shieh, Pekow, Hill.
Obtained funding: Lindenauer, Hill.
Study supervision: Lindenauer, Pekow.
Conflict of Interest Disclosures: None reported.
Supplemental content at jamainternalmedicine.com
References
- 1.Centers for Disease Control and Prevention. FASTSTATS: chronic obstructive pulmonary disease (COPD): chronic bronchitis and emphysema. http://www.cdc.gov/nchs/fastats/copd.htm. Accessed December 9, 2013.
- 2.National Heart, Lung, and Blood Institute. Morbidity and Mortality: 2012 Chart Book on Cardiovascular, Lung, and Blood Diseases. Bethesda, MD: National Institutes of Health; 2012. http://www.nhlbi.nih.gov/research/reports/2012-mortality-chart-book.htm. Accessed December 9, 2013. [Google Scholar]
- 3.Wier LM, Elixhauser A, Pfuntner A, Au DH. Healthcare Cost and Utilization Project (HCUP) Statistical Briefs. Rockville, MD: Agency for Health Care Policy and Research; 2006. Overview of Hospitalizations among Patients with COPD, 2008: Statistical Brief No. 106. http://www.ncbi.nlm.nih.gov/books/NBK53969/. Accessed November 27, 2013. [PubMed] [Google Scholar]
- 4.Global Initiative for Chronic Obstructive Lung Disease. GOLD: the Global Initiative for Chronic Obstructive Lung Disease. http://www.goldcopd.com/. Accessed December 10, 2013.
- 5.Quon BS, Gan WQ, Sin DD. Contemporary management of acute exacerbations of COPD: a systematic review and metaanalysis. Chest. 2008;133(3):756–766. doi: 10.1378/chest.07-1207. [DOI] [PubMed] [Google Scholar]
- 6.National Institute for Health and Care Excellence. Chronic obstructive pulmonary disease (NICE clinical guideline 101): management of chronic obstructive pulmonary disease in adults in primary and secondary care (partial update) 2010 Jun; http://guidance.nice.org.uk/cg101. Accessed December 17, 2013.
- 7.Lightowler JV, Wedzicha JA, Elliott MW, Ram FSF. Non-invasive positive pressure ventilation to treat respiratory failure resulting from exacerbations of chronic obstructive pulmonary disease: Cochrane systematic review and meta-analysis. BMJ. 2003;326(7382):185. doi: 10.1136/bmj.326.7382.185. [DOI] [PMC free article] [PubMed] [Google Scholar]
- 8.Girou E, Schortgen F, Delclaux C, et al. Association of noninvasive ventilation with nosocomial infections and survival in critically ill patients. JAMA. 2000;284(18):2361–2367. doi: 10.1001/jama.284.18.2361. [DOI] [PubMed] [Google Scholar]
- 9.Ambrosino N, Vagheggini G. Noninvasive positive pressure ventilation in the acute care setting: where are we? Eur Respir J. 2008;31(4):874–886. doi: 10.1183/09031936.00143507. [DOI] [PubMed] [Google Scholar]
- 10.Hill NS, Brennan J, Garpestad E, Nava S. Noninvasive ventilation in acute respiratory failure. Crit Care Med. 2007;35(10):2402–2407. doi: 10.1097/01.CCM.0000284587.36541.7F. [DOI] [PubMed] [Google Scholar]
- 11.Bierer GB, Soo Hoo GW. Noninvasive ventilation for acute respiratory failure: a national survey of Veterans Affairs hospitals. Respir Care. 2009;54(10):1313–1320. [PubMed] [Google Scholar]
- 12.Burns KEA, Sinuff T, Adhikari NKJ, et al. Bilevel noninvasive positive pressure ventilation for acute respiratory failure: survey of Ontario practice. Crit Care Med. 2005;33(7):1477–1483. doi: 10.1097/01.ccm.0000168042.59035.d8. [DOI] [PubMed] [Google Scholar]
- 13.Drummond J, Rowe B, Cheung L, Mayers I. The use of noninvasive mechanical ventilation for the treatment of acute exacerbations of chronic obstructive pulmonary disease in Canada. Can Respir J. 2005;12(3):129–133. doi: 10.1155/2005/714792. [DOI] [PubMed] [Google Scholar]
- 14.Maheshwari V, Paioli D, Rothaar R, Hill NS. Utilization of noninvasive ventilation in acute care hospitals: a regional survey. Chest. 2006;129(5):1226–1233. doi: 10.1378/chest.129.5.1226. [DOI] [PubMed] [Google Scholar]
- 15.Hess DR, Pang JM, Camargo CA., Jr A survey of the use of noninvasive ventilation in academic emergency departments in the United States. Respir Care. 2009;54(10):1306–1312. [PubMed] [Google Scholar]
- 16.Chandra D, Stamm JA, Taylor B, et al. Outcomes of noninvasive ventilation for acute exacerbations of chronic obstructive pulmonary disease in the United States, 1998–2008. Am J Respir Crit Care Med. 2012;185(2):152–159. doi: 10.1164/rccm.201106-1094OC. [DOI] [PMC free article] [PubMed] [Google Scholar]
- 17.Carlucci A, Richard JC, Wysocki M, Lepage E, Brochard L, SRLF Collaborative Group on Mechanical Ventilation Noninvasive versus conventional mechanical ventilation: an epidemiologic survey. Am J Respir Crit Care Med. 2001;163(4):874–880. doi: 10.1164/ajrccm.163.4.2006027. [DOI] [PubMed] [Google Scholar]
- 18.Tsai C-L, Lee W-Y, Delclos GL, Hanania NA, Camargo CA., Jr Comparative effectiveness of noninvasive ventilation vs invasive mechanical ventilation in chronic obstructive pulmonary disease patients with acute respiratory failure. J Hosp Med. 2013;8(4):165–172. doi: 10.1002/jhm.2014. [DOI] [PubMed] [Google Scholar]
- 19.Antonelli M, Conti G, Moro ML, et al. Predictors of failure of noninvasive positive pressure ventilation in patients with acute hypoxemic respiratory failure: a multi-center study. Intensive Care Med. 2001;27(11):1718–1728. doi: 10.1007/s00134-001-1114-4. [DOI] [PubMed] [Google Scholar]
- 20.Lindenauer PK, Pekow P, Gao S, Crawford AS, Gutierrez B, Benjamin EM. Quality of care for patients hospitalized for acute exacerbations of chronic obstructive pulmonary disease. Ann Intern Med. 2006;144(12):894–903. doi: 10.7326/0003-4819-144-12-200606200-00006. [DOI] [PubMed] [Google Scholar]
- 21.Lindenauer PK, Pekow PS, Lahti MC, Lee Y, Benjamin EM, Rothberg MB. Association of corticosteroid dose and route of administration with risk of treatment failure in acute exacerbation of chronic obstructive pulmonary disease. JAMA. 2010;303(23):2359–2367. doi: 10.1001/jama.2010.796. [DOI] [PubMed] [Google Scholar]
- 22.Rothberg MB, Pekow PS, Lahti M, Brody O, Skiest DJ, Lindenauer PK. Antibiotic therapy and treatment failure in patients hospitalized for acute exacerbations of chronic obstructive pulmonary disease. JAMA. 2010;303(20):2035–2042. doi: 10.1001/jama.2010.672. [DOI] [PubMed] [Google Scholar]
- 23.Stein B. Specificity of ICD-9 diagnosis codes for identifying patients hospitalized for COPD. Am J Respir Crit Care Med. 2009;179:A2159. [Google Scholar]
- 24.Elixhauser A, Steiner C, Harris DR, Coffey RM. Comorbidity measures for use with administrative data. Med Care. 1998;36(1):8–27. doi: 10.1097/00005650-199801000-00004. [DOI] [PubMed] [Google Scholar]
- 25.Gagne JJ, Glynn RJ, Avon J, Levin R, Schneeweiss S. A combined comorbidity score predicted mortality in elderly patients better than existing scores. J Clin Epidemiol. 2011;64(7):749–759. doi: 10.1016/j.jclinepi.2010.10.004. [DOI] [PMC free article] [PubMed] [Google Scholar]
- 26.Kurth T, Walker AM, Glynn RJ, et al. Results of multivariable logistic regression, propensity matching, propensity adjustment, and propensity-based weighting under conditions of nonuniform effect. Am J Epidemiol. 2006;163(3):262–270. doi: 10.1093/aje/kwj047. [DOI] [PubMed] [Google Scholar]
- 27.Xu S, Ross C, Raebel MA, Shetterly S, Blanchette C, Smith D. Use of stabilized inverse propensity scores as weights to directly estimate relative risk and its confidence intervals. Value Health. 2010;13(2):273–277. doi: 10.1111/j.1524-4733.2009.00671.x. [DOI] [PMC free article] [PubMed] [Google Scholar]
- 28.Parsons LS. Reducing Bias in a Propensity Score Matched-Pair Sample Using Greedy Matching Techniques: SAS SUGI 26. Cary, NC: SAS Institute Inc; 2001. pp. 214–226. [Google Scholar]
- 29.Johnston SC, Henneman T, McCulloch CE, van der Laan M. Modeling treatment effects on binary outcomes with grouped-treatment variables and individual covariates. Am J Epidemiol. 2002;156(8):753–760. doi: 10.1093/aje/kwf095. [DOI] [PubMed] [Google Scholar]
- 30.Lin DY, Psaty BM, Kronmal RA. Assessing the sensitivity of regression results to unmeasured confounders in observational studies. Biometrics. 1998;54(3):948–963. [PubMed] [Google Scholar]
- 31.Stefan MS, Shieh M-S, Pekow PS, et al. Epidemiology and outcomes of acute respiratory failure in the United States, 2001 to 2009: a national survey. J Hosp Med. 2013;8(2):76–82. doi: 10.1002/jhm.2004. [DOI] [PMC free article] [PubMed] [Google Scholar]
- 32.Confalonieri M, Potena A, Carbone G, Porta RD, Tolley EA, Umberto Meduri G. Acute respiratory failure in patients with severe community-acquired pneumonia: a prospective randomized evaluation of noninvasive ventilation. Am J Respir Crit Care Med. 1999;160(5, pt 1):1585–1591. doi: 10.1164/ajrccm.160.5.9903015. [DOI] [PubMed] [Google Scholar]
- 33.Honrubia T, García López FJ, Franco N, et al. Noninvasive vs conventional mechanical ventilation in acute respiratory failure: a multicenter, randomized controlled trial. Chest. 2005;128(6):3916–3924. doi: 10.1378/chest.128.6.3916. [DOI] [PubMed] [Google Scholar]
- 34.Carlucci A, Guerrieri A, Nava S. Palliative care in COPD patients: is it only an end-of-life issue? Eur Respir Rev. 2012;21(126):347–354. doi: 10.1183/09059180.00001512. [DOI] [PMC free article] [PubMed] [Google Scholar]
Associated Data
This section collects any data citations, data availability statements, or supplementary materials included in this article.