Abstract
Cancer-associated genetic alterations induce expression of tumor antigens which can activate CD8+ cytotoxic T cells (CTL), but the microenvironment of established tumors promotes immune tolerance through poorly understood mechanisms1,2. Recently developed therapeutics that overcome tolerogenic mechanisms activate tumor-directed CTL and are effective in some human cancers1. Immune mechanisms also affect treatment outcome and certain chemotherapeutic drugs stimulate cancer-specific immune responses by inducing immunogenic cell death (ICD) and other effector mechanisms3,4. Our previous studies revealed that B lymphocytes recruited by CXCL13 into prostate cancer (PC) promote castrate-resistant PC (CRPC) by producing lymphotoxin (LT) which activates an IKKα-Bmi1 module in PC stem cells5,6. Since CRPC is refractory to most therapies, we examined B cell involvement in acquisition of chemotherapy resistance. We focused this study on oxaliplatin, an immunogenic chemotherapeutic3,4 that is effective in aggressive PC7. We found that B cells modulate the response to low dose oxaliplatin, which by inducing ICD promotes tumor-directed CTL activation. Three different mouse PC models were refractory to oxaliplatin unless genetically or pharmacologically depleted of B cells. The critical immunosuppressive B cells are plasmocytes that express IgA, IL-10 and PD-L1, whose appearance depends on TGFβ-receptor (TGFβR) signaling. Elimination of these cells, which also infiltrate human therapy-resistant PC, allows CTL-dependent eradication of oxaliplatin-treated tumors.
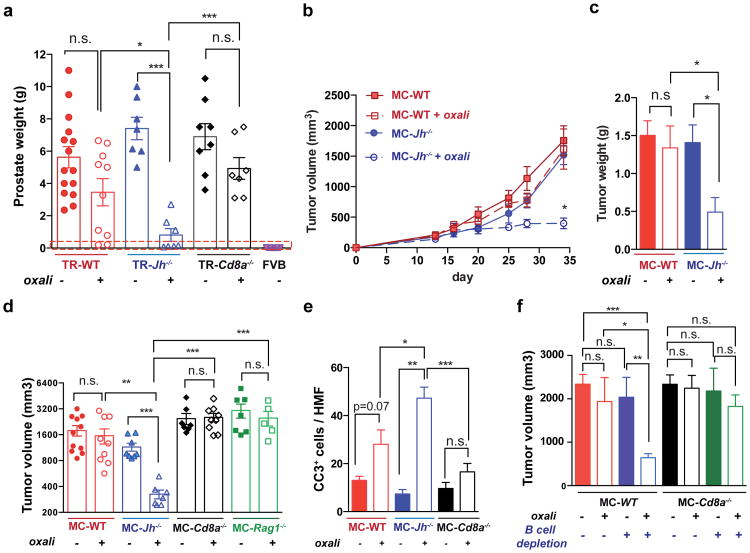
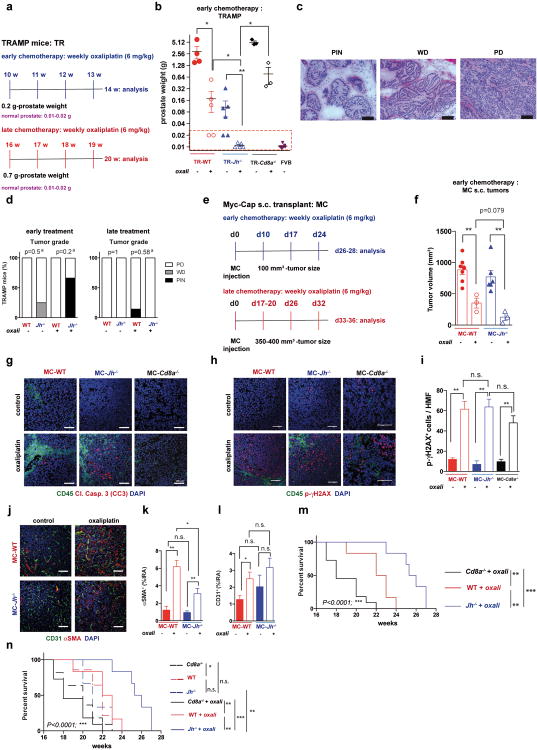
Using the autochthonous TRAMP model of metastatic PC8, we examined how lymphocytes affect the response to low dose (LD) oxaliplatin. Although early (≤ 0.2 g) tumors responded to oxaliplatin regardless of B cell status (Extended Data Fig. 1a,b), upon reaching ≥ 0.7 g, WT tumors became largely resistant to “late” chemotherapy (Fig. 1a). However, tumors arising in B cell-deficient TRAMP;Jh-/- hybrid mice were oxaliplatin sensitive (Fig. 1a), although B cells had little effect on tumor progression and histology (Extended Data Fig. 1c,d). CD8+cell-deficient TRAMP;Cd8a-/- mice bearing small tumors were less responsive to oxaliplatin, but large tumors were treatment resistant (Fig. 1a; Extended Data Fig. 1b). Similar results were obtained by s.c. transplantation of Myc-Cap (MC) cells9. Whereas small MC tumors (≤100 mm3) were chemotherapy responsive in WT mice (Extended Data Fig. 1e,f), large MC tumors (≥350-400 mm3) shrank upon oxaliplatin treatment only in Jh-/- mice (Fig. 1b-d). No response was observed in Cd8a-/- mice. Oxaliplatin responsiveness was associated with enhanced caspase 3 activation, but the tumoral DNA damage response measured by histone H2AX phosphorylation was similarly activated by oxaliplatin, regardless of host genotype (Fig. 1e; Extended Data Fig. 1g-i). Oxaliplatin treatment increased tumor-infiltrating CD45+ cells in WT and Jh-/- mice, but myofibroblast activation and CD31 infiltration was more pronounced in WT mice (Extended Data Fig. 1j-l). LD oxaliplatin enhanced TRAMP mouse survival in a manner dependent on CTL and inhibitable by B cells (Extended Data Fig. 1m,n). B cell immunodepletion also enhanced oxaliplatin-induced tumor regression and the effect was CTL-dependent (Fig. 1f).
Figure 1. B cells inhibit oxaliplatin-induced tumor regression.
a, TRAMP (FVB) mice (TR-WT, TR-Jh-/-, and TR-Cd8a-/-; n=7-15/group) received weekly oxaliplatin (6 mg/kg), starting at week 16. After 4 weeks, prostate weights measured. Dashed red line = prostate weight of naïve controls. b, Tumor growth in mice transplanted with MC cells and treated with oxaliplatin as in Extended Data Fig. 1f (late treatment) or 5% dextrose (n=7-11/group). c, Weights of MC tumors after oxaliplatin or vehicle treatment (n=5-7/group). d, Mice of indicated genotypes bearing MC tumors (n=7-11/group) were treated as above. After 3 cycles, tumor volumes (mm3) were determined. e, Numbers of cleaved caspase 3 (CC3) CD45- cells per high magnification field (HMF; 200×) in tumors from Extended Data Fig. 1g. f, MC tumors were inoculated into WT (left) or Cd8a-/- (right) mice. After 16 days, B cells were depleted with antibodies against CD19, CD20, CD22 and B220. Four days after first twice-weekly antibody treatment, mice received weekly oxaliplatin (n=4-7/group, total: 42), and sacrificed 3 weeks later. Tumor volumes were analyzed by Kruskal-Wallis test: P=0.007**. Results are means ± s.e.m. Mann-Whitney and t tests were used to determine significance indicated as *P, 0.05; **P, 0.01; ***P, 0.001.
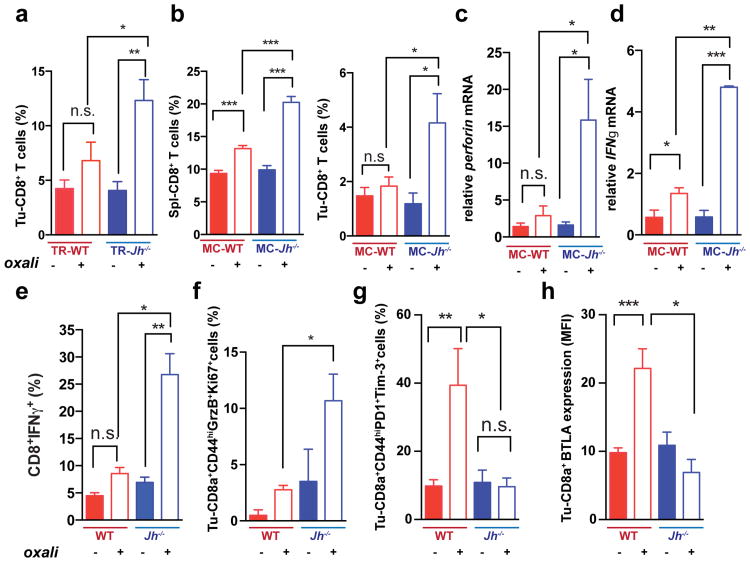
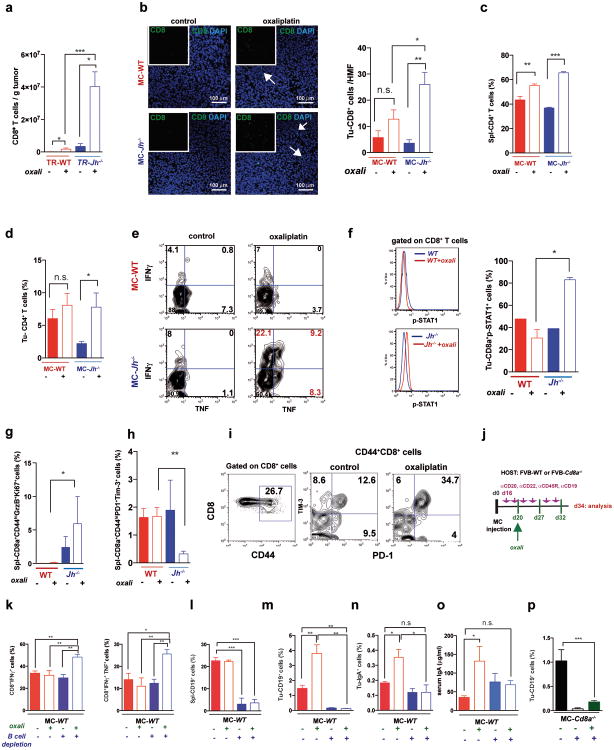
Oxaliplatin stimulated CD8+ cell recruitment in TRAMP and TRAMP;Jh-/- mice, although more tumoral CD8+ cells were found in the latter (Fig. 2a; Extended Data Fig. 2a). B cell deficiency also enhanced oxaliplatin-induced CD8+ and CD4+ cell recruitment into MC tumors and induction of perforin, γ interferon (IFNγ) and TNF in CD8+ cells (Fig. 2b-e; Extended Data Fig. 2b-e). MC tumors in Jh-/- mice contained more CD8+ cells with activated STAT1, more proliferative CD8a+CD44hiGrzB+Ki67+ cells and fewer “exhausted”2 CD8+CD44+PD-1+Tim3+ and CD8+BTLAhi cells, whose presence in WT tumors was elevated by oxaliplatin (Fig. 2f-h; Extended Data Fig. 2f-i). B cell immunodepletion also enhanced tumoral CTL activation (Extended Data Fig. 2j-p).
Figure 2. B cells inhibit oxaliplatin-induced T cell activation.
a, CD8+ cells in TRAMP prostates (WT, Jh-/-; n=4-6/group) from mice treated as in 1a, enumerated by flow cytometry and normalized to CD45+ cells. b, Mice (n=6-8/group) bearing MC tumors were analyzed as above for CD8+ cells in spleens and tumors after 3 chemotherapy cycles. c, d, Q-RT-PCR analysis of Perforin and Ifnγ mRNA in MC tumors collected as in (b) (n=4-7). e, IFNγ expression by CD8+ cells from tumors (n=6-8) from (b) after in vitro re-stimulation with tumor cell lysate. f-h, Expression of GrzB and Ki-67 (f), PD-1and Tim-3 (g) and BTLA (h) in CD8+ T effector cells (CD8+CD44+; f,g) or total CD8+ cells (h) from tumors of MC inoculated mice (b). Results are percentages of positive cells in tumoral CD8+ cells or mean fluorescence intensities (MFI) and are means ± s.e.m of 3 independent experiments (n=6-8 mice/group). Mann-Whitney and t tests were used to determine significance shown as above.
Oxaliplatin treatment greatly increased the number of tumoral B220+CD19+ B cells (Fig. 3a, Extended Data Fig. 3a,b). After 3-4 treatment cycles at least 40% of tumoral B cells were CD20-/lowCD19+B220lowCD138+ plasma cells, 40-80% of which expressed IgA (Fig. 3b,c; Extended Data Fig.3c-l). IgA+ B cells became detectable 48 hrs after first treatment cycle, and their abundance increased to nearly 80% of B220low cells after additional cycles (Extended Data Fig. 3g,l). When cultured ex vivo, tumoral IgA+ B cells released soluble IgA (Extended Data Fig. 4a). Oxaliplatin also increased serum IgA in both TRAMP and MC-tumor models, but had little effect on serum IgG (Extended Data Fig. 4b-e). Plasmocytic IgA+ cells were found adjacent to α smooth muscle actin (αSMA)-expressing myofibroblasts (Fig. 3d), which produce CXCL1310. Oxaliplatin-induced IgA+ B cells from spleen and MC tumors expressed activation-induced cytidine deaminase (Extended Data Fig. 4f,g), suggesting recent class-switch recombination (CSR).
Figure 3. Oxaliplatin induces tumor infiltration with IgA+PD-L1+IL-10-producing plasmocytes.
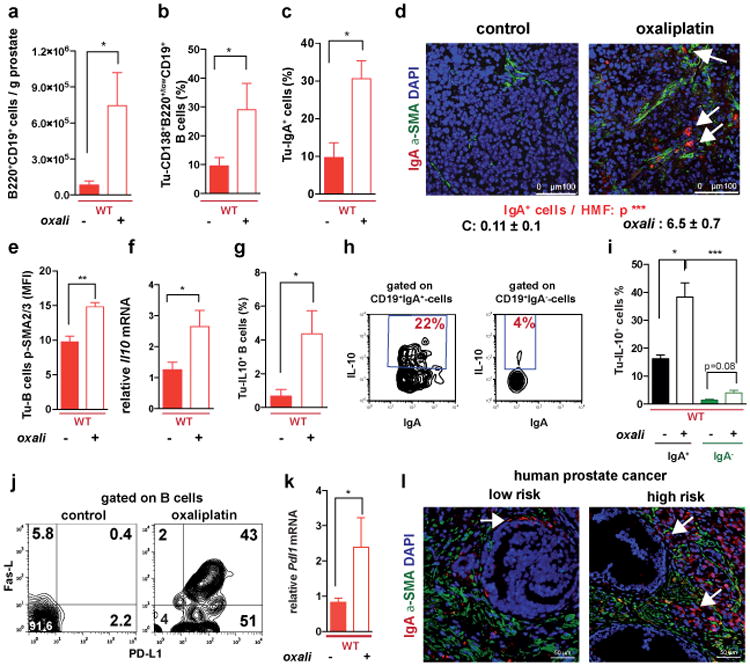
a, B220+CD19+ B lymphocytes in 20 weeks old TRAMP prostates after 4 oxaliplatin cycles (n=5-7/group) normalized to prostate weights. b,c, B220, CD19, CD138 and IgA expression in tumoral B cells from (a). Values are % of tumoral CD45+ (b) or CD19+ (c) cells. d, MC tumors (n=4-5/group) stained for αSMA (green) and IgA (red). Arrows: IgA+ cells whose number per HMF is displayed on the bottom. e, p-SMAD2/3 in tumor-infiltrating B cells (n=3-4/group). f, Il10 mRNAin MC tumors (n=5-6/group). g, Tumor-infiltrating IL-10+CD19+B cells in MC-WT mice, as percentages of CD45+ cells. h, Percentages of IL-10-producing cells in tumoral (MC-WT) CD19+IgA+ and CD19+IgA- cells i, IL-10 expression by tumoral (MC-WT) IgA+ and IgA- B cells (n=4-6/group). j, PD-L1 and FAS-L expression in B cells from TRAMP tumors. k, Pdl1 mRNA in MC tumors (n=5-6/group). l, Low (n=5) and high (n=5) risk human PC specimens stained with IgA (red) and αSMA (green) antibodies. Arrows: IgA+ cells. All results are means ± s.e.m of at least three independent experiments. Magnification bars: 100 μm. Mann-Whitney and t tests were used to calculate statistical significance shown as above.
The IgA CSR is mainly induced by TGFβ together with CD40L, IL-21, IL-10 or IL-611. Indeed, oxaliplatin increased the proportion of tumoral B cells containing phosphorylated SMAD2/3, and induced Tgfb1 mRNA in tumors (Fig. 3e; Extended Data Fig.4h-j). Oxaliplatin also increased IL-21 expression and STAT3 phosphorylation in tumoral B cells (Extended Data Fig. 4k,l), as well as Il10 mRNA in tumors, tumoral IL-10 producing B cells and IL-10 content per B cell (Fig. 3f,g; Extended Data Fig. 4m). Nearly 50% of IgA+CD19+ plasmocytes contained IL-10 mRNA and protein (Fig. 3h-i; Extended Data Fig. 4n). Oxaliplatin induced Fas ligand (Fas-L) and PD ligand 1 (PD-L1) in about 50% of IgA+ plasmocytes, 40% of which expressed both PD-L1 and IL-10 (Fig, 3j,k; Extended Data Fig. 3f-j). Most PD-L1+ cells expressed IgA and contained phosphorylated SMAD2/3 (Extended Data Fig. 4j). However, LTα/β-producing B cells did not express IL-10 and their abundance was barely increased by oxaliplatin (Extended Data Fig. 4o,p). Tumoral CD19+ cells did not express CD5, a B regulatory (Breg) cell marker12 (Extended Data Fig. 4q). Oxaliplatin induced other immunoregulatory molecules, including Nos2, Arg1, IL-12p35 and IL-12p40, but no differences were observed between tumor-bearing WT and Jh-/- mice, although the latter expressed higher amounts of IL-12 (Extended Data Fig. 5a-d). B cell deficiency or depletion had no significant effect on tumoral NK cells, myeloid CD11b+Gr1+ cells, macrophages or Treg (Extended Data Fig. 5e-i). Thus, unlike mouse skin cancer, where B cells modulate therapeutic responsiveness through macrophages13, B cells in murine PC impede immunogenic chemotherapy by suppressing CTL activation.
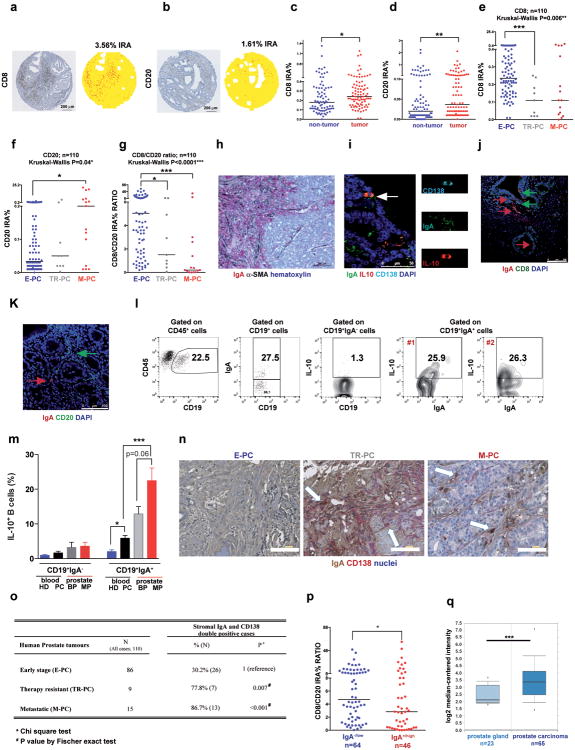
Human PC samples (n=110) were analyzed for CD8+ and CD20+ cells (Extended Data Fig. 6a,b). Comparison of matched normal and tumor tissues from 87 early stage PC (E-PC) patients indicated higher CD8+ and CD20+ counts in tumors (Extended Data Fig. 6c,d). Patients with therapy-resistant PC (TR-PC) or metastatic PC (M-PC) exhibited reduced tumoral CD8+ cell density relative to E-PC patients, whose tumors contained fewer B cells than TR-PC and M-PC, in which B cells were most abundant (Extended Data Fig. 6e,f). E-PC specimens displayed higher CD8/CD20 ratio than TR-PC and M-PC (Extended Data Fig. 6g). Immunofluorescence (IF) and immunohistochemical (IHC) analyses of human PC specimens revealed IgA+ cells in a scattered formation, frequently next to αSMA+ myofibroblasts, especially in the high risk group (Fig. 3l; Extended Data Fig. 6h-j, and n). CD20+ B cells were both scattered and clustered in lymphoid follicle-like16 areas (Extended Data Fig. 6b,k). Human PC also contained IL-10-producing IgA+ CD138+ cells and some IgA+ cells were adjacent to CD8+ T cells and expressed little CD20 (Extended Data Fig. 6i-k). 25% of IgA+ cells in fresh prostatectomy specimens expressed IL-10 and were enriched in the malignant tissue portion (Extended Data Fig. 6l,m). IgA+CD138+ plasmocytes exhibited higher density in TR-PC and M-PC than E-PC and patients with higher IgA+CD138+ cell counts showed lower CD8/CD20 ratio (Extended Data Fig. 6n-p). Oncomine analysis of human IgA (IGHA1) mRNA revealed elevated IGHA1 mRNA in malignant versus healthy prostates in 11 of 15 datasets. Of these, 5 showed a significant increase (p < 0.05) and 3 showed a > 2-fold change. Results of one analysis14 are presented (Extended Data Fig. 6q) and fit earlier findings in mice5,6,15, suggesting that tumor infiltrating lymphocytes also control malignant progression and response to therapy in human PC.
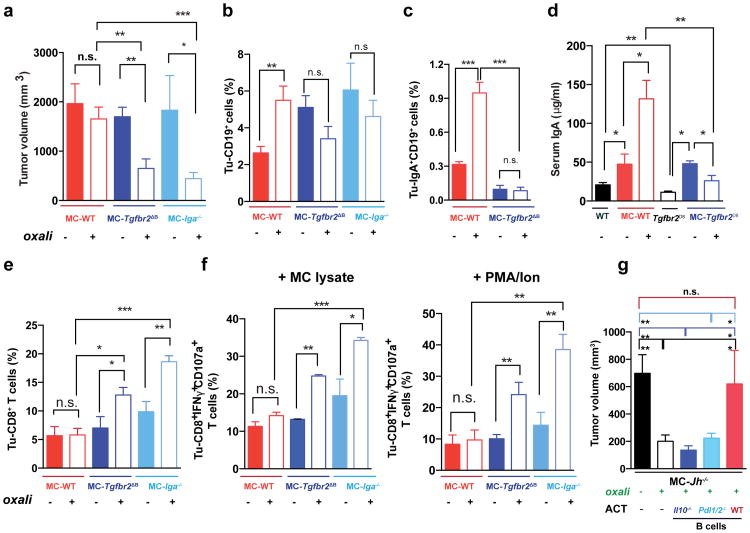
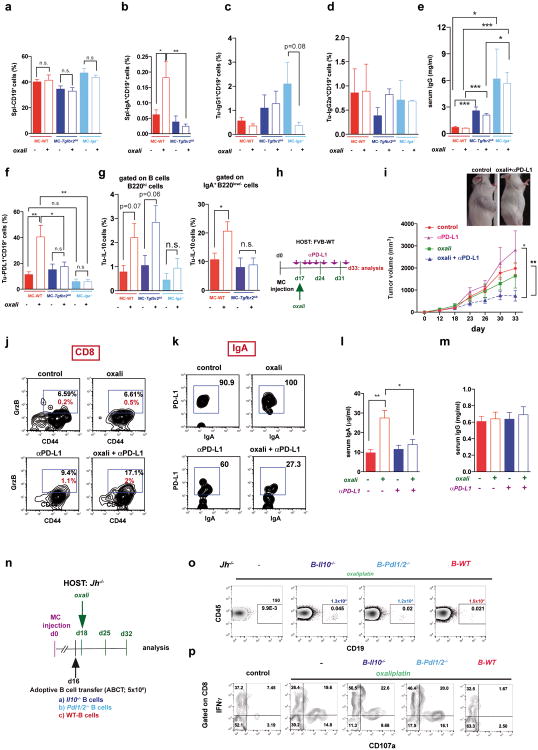
Consistent with prior knowledge11 and SMAD2/3 activation in PD-L1+ cells, TGFβR2 ablation in B cells (Tgfbr2ΔB) enhanced oxaliplatin-induced tumor regression, mildly decreased tumor-infiltrating, but not splenic, B cells and inhibited oxaliplatin-induced IgA+ plasmocyte generation without affecting IgG1+ or IgG2a+ cells (Fig. 4a-c; Extended Data Fig.7a-e). IgA ablation also potentiated oxaliplatin responsiveness without reducing tumoral B cells (Fig. 4a,b). Both TGFβR2 and IgA ablations, prevented induction of tumoral PD-L1+ or IgA+IL-10+ B cells by oxaliplatin, but barely affected IL-10 in B220hiIgA- B cells (Extended Data Fig. 7f,g). TGFβR2 ablation or IgA deficiency also increased tumoral CTL density, IFNγ-production and surface CD107 a expression by CD8+ T cells of oxaliplatin-treated mice (Fig. 4e,f). Suppressor B cells may attenuate T cell activation via PD-L116. Treatment of mice bearing MC tumors with oxaliplatin plus anti-PD-L1, but not anti-PD-L1 alone, inhibited tumor growth, increased GrzB expression by effector T cells, downregulated PD-L1 expressionon IgA+ cells, and reduced serum IgA, but not IgG (Extended Data Fig. 7h-m). Reconstitution of tumor-bearing Jh-/- hosts with B cells lacking either PD-L1 or IL-10 failed to inhibit oxaliplatin-induced tumor regression (Fig. 4g; Extended Data Fig. 7n-p). PD-L1 ablation did not affect IL-10 expression and IL-10 ablation had no effect on PD-L1 (Extended Data Fig. 10m,n), indicating that both molecules are needed for plasmocyte-mediated immunosuppression.
Figure 4. TGFβR signaling and IgA CSR are required for immunosuppressive plasmocyte development.
a, WT, Tgfbr2ΔB or Iga-/- mice bearing late MC tumors were given 3 weekly oxaliplatin cycles (n=5-11/group, total: 48), and tumor volumes at treatment end were analyzed (Kruskal-Wallis test: P=0.0004***). b, c, Tumoral CD19+ (b) and IgA+ (c) cells, depicted as percentages of tumoral CD45+ cells (b) or total vital cells (c) (n=4-7/group). d, Serum IgA in MC-WT and MC-Tgfbr2ΔB mice (n=5-8/group). Tumor-free WT and Tgfbr2ΔB mice served as controls. e, Frequency of tumoral CD8+ cells in mice from (a). f, CD8+ cells (5 × 10⁶/well) from (a) were re-stimulated with either MC lysate (left) or PMA/ionomycin (right) and analyzed for indicated markers. Percentages of marker positive cells within tumoral CD8+ cells are shown (n=4-7 mice/group). g, B cells (5 × 10⁶; 98% pure) from WT, Pdl1/2-/- and Il10-/- mice were transferred into MC tumor-bearing Jh-/- mice (16 days after inoculation) that received oxaliplatin 2 days later. Tumor volumes were determined on day 30 (n=4-6 mice/group). Results are means ± s.e.m. Mann-Whitney and t tests were used to calculate statistical significance.
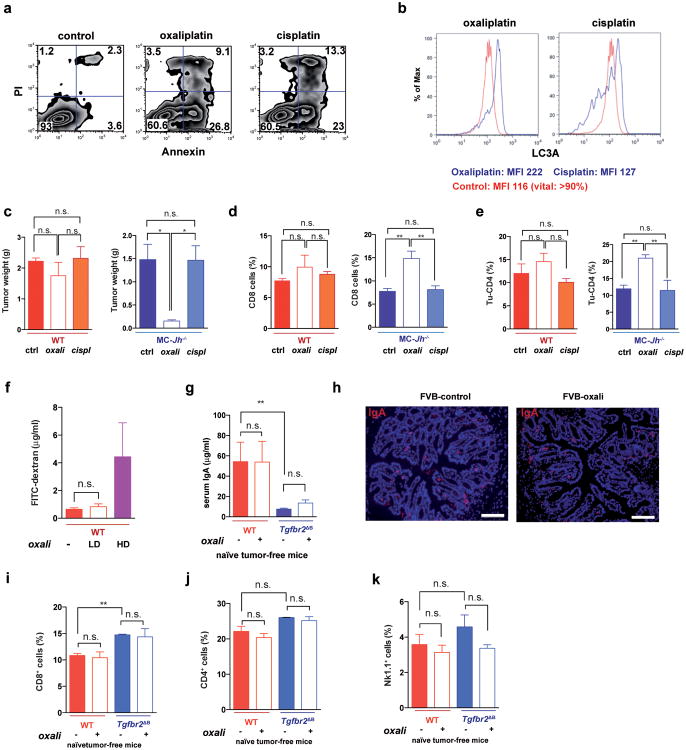
We used oxaliplatin because of its well-described immunogenic properties, which are not exhibited by the related compound cisplatin3,4. Both oxaliplatin and cisplatin induced apoptotic cell death but oxaliplatin was better in stimulating autophagy (Extended Data Fig. 8a,b). Importantly, only LD oxaliplatin induced regression of MC tumors in Jh-/- mice, whereas LD cisplatin was ineffective, and only oxaliplatin increased the abundance of tumoral CD8+ and CD4+ cells (Extended Data Fig. 8c-e). LD oxaliplatin did not increase intestinal permeability and had no effect on IgA production and other immune parameters in tumor-free WT or Tgfbr2ΔB mice (Extended Data Fig. 8f-k).
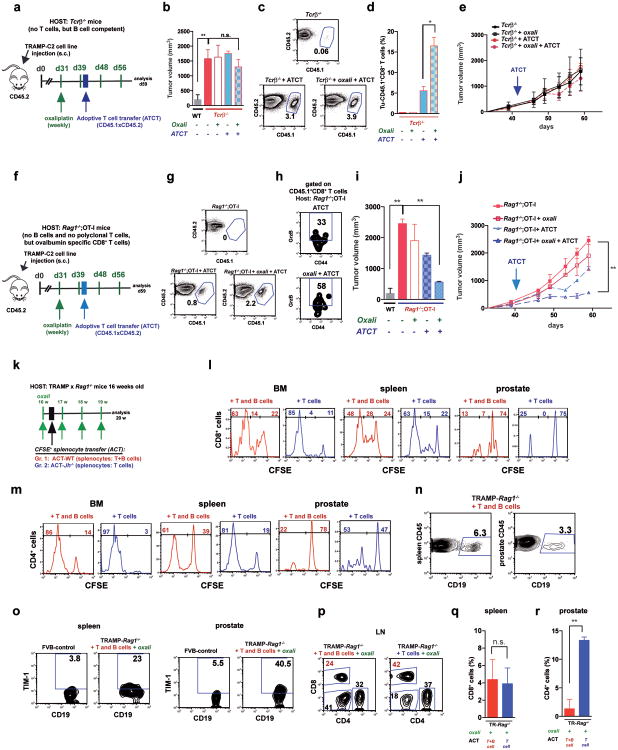
Immunogenic chemotherapy also potentiates the effectiveness of adoptively transferred T cells (ATCT). Immunogenic TRAMP-C2 cells17 were inoculated into B cell-containing Tcrβ-/- mice followed by oxaliplatin treatment and ATCT (Extended Data Fig. 9a). Bigger tumors in Tcrβ-/- relative to WT mice confirmed TRAMP-C2 immunogenicity (Extended Data Fig. 9b). However, despite successful T cell take and elevated CD8+ count after oxaliplatin treatment, tumors were not rejected (Extended Data Fig. 9c-e). TRAMP-C2 tumors were also raised in Rag1-/-;OT-1 mice, which lack B cells and polyclonal T cells but harbor CD8+ cells directed against chicken ovalbumin (Ova)18. Adoptively transferred CD8+ cells expanded and expressed GrzB in Rag1-/-;OT-1 hosts, especially after oxaliplatin treatment (Extended Data Fig. 9f-h). Consequently, tumor growth was inhibited by ATCT combined with oxaliplatin (Extended Data Fig. 9i,j). More dramatic results were obtained in TRAMP;Rag1-/- mice transplanted with CFSE-labeled splenocytes from either naïve WT (B and T cell transfer) or Jh-/- (T cell transfer) mice (Extended Data Fig. 9k). CD8+ cell proliferation in BM, spleens and prostates of transplanted mice indicated successful T cell take (Extended Data Fig. 9l,m). Thirty days after lymphocyte transfer, prostate tumors were analyzed. Oxaliplatin caused modest tumor shrinkage in mice receiving T and B cells, but in mice receiving only T cells it induced complete regression (Fig. 5a,b). Transplantation with T and B cells combined with oxaliplatin restored CD19+ cells in spleen and prostate and serum IgA and IgG, including IgA and IgG directed against SV40 T antigen, the TRAMP oncogene (Fig. 5c-e), indicating a tumor-specific humoral response. Transferred B cells expressed TIM-1 (Extended Data Fig. 9o), a molecule involved in regulation of IL-10 expression and tolerance induction19. B and T cell co-transplantation led to appearance of CD4+ and CD8+ cells in lymphoid organs, but T cell number was considerably lower in prostate tumors (Fig. 5f; Extended Data Fig. 9p-r). However, transplantation with B cell-deficient splenocytes caused robust T cell infiltration into prostate tumors (Fig. 5f; Extended Data Fig. 9r). To confirm that IgA+ B cells attenuate the response to immunogenic chemotherapy by inhibiting T cell activation, we raised MC tumors in Rag1-/- mice and transplanted them with T cells from WT mice immunized with MC cell lysate, with or without naïve B cells from WT or Tgfbr2ΔB spleens. In this case, oxaliplatin induced tumor regression and CTL activation only in mice receiving T cells, or T cells + TGFβR2-deficient B cells, which produced little IgA (Fig. 5g-i; Extended Data Fig. 10a-c). Hence, only B cells that have undergone TGFβR signaling and IgA CSR suppress CTL activation.
Figure 5. Adoptively transferred B cells inhibit T cell-dependent tumor eradication.
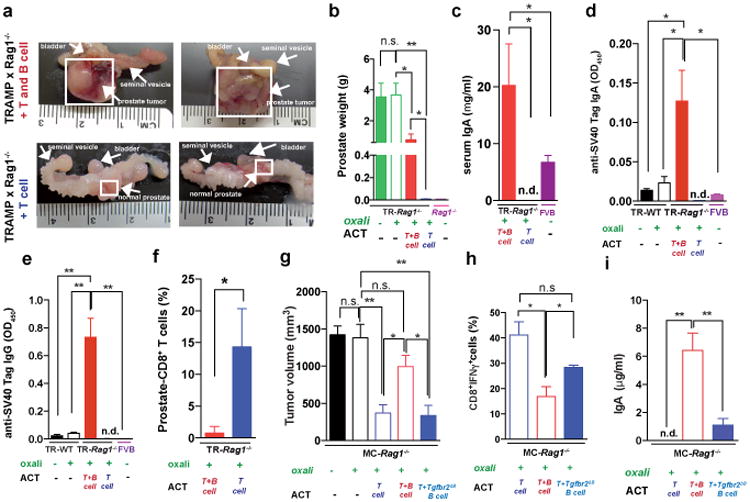
a,b TRAMP;Rag1-/- mice (16 weeks old) received weekly oxaliplatin. One day after 1st treatment, CFSE-labeled splenocytes from WT or Jh-/- mice were adoptively transferred (ACT) into tumor-bearing mice (4-5/group). After 3 more oxaliplatin cyclesthe prostates were photographed (a) and tumor weight measured (b). c, Serum IgA in both ACT groups and FVB-WT mice. d,e Serum anti-SV40-Tag IgA and IgG concentrations in indicated strains with or without ACT and/or oxaliplatin treatment. f, Frequency of CD8+ cells amongst CD45+ cells in TRAMP;Rag1-/- prostates after ACT and oxaliplatin treatment. g, MC tumor-bearing Rag1-/- mice were oxaliplatin treated. One day later, mice (4-5/group) received activated T cells from WT mice immunized with MC cell extract without or with B cells from WT or Tgfbr2ΔB mice. After 2 more treatments, mice were sacrificed and tumor volumes determined. h, IFNγ in tumoral CD8+ cells of above mice. Cells were re-stimulated with PMA/ionomycin before determining percentages of IFNγ-expressing cells in total CD8+ cells (n=5-8/group). j, Serum IgA in above mice. Results are means ± s.e.m. Mann-Whitney and t tests were used to determine significance. n.d. not detectable.
Our results show that successful eradication of large prostate tumors by immunogenic chemotherapy requires removal of immunosuppressive IgA+ plasmocytes that are present both in mouse and human PC. Spontaneous and transplantable PC models contain IgA+ plasmocytes that strongly suppress CTL activation after treatment with oxaliplatin, an ICD inducer4. Although oxaliplatin causes regression of small tumors, it does not activate CTL or shrinks large prostate tumors, despite inducing DNA damage, unless tumor-infiltrating immunosuppressive B cells are removed. These B cells are IgA-producing plasmocytes that express PD-L1, IL-10 and Fas-L. Genetic analysis confirms that much of the immunosuppressive activity derives from IgA+PD-L1+IL-10+ cells. Development of these cells, which differ from the LT-producing CD20+ B cells that infiltrate androgen-deprived prostate tumors and stimulate CRPC emergence through the IKKα-Bmi1 module5,6, depends on TGFβR signaling. Nonetheless, CD20+LT+ B cells that are exposed to high TGFβ concentrations and antigen in the PC microenvironment after oxaliplatin treatment may eventually become IgA+ plasmocytes. A likely source of TGFβ are αSMA+ myofibroblasts that reside next to IgA+ cells in oxaliplatin-treated mouse tumors and human PC samples10. Alternatively, LT-producing B cells may stimulate the IgA CSR, as signaling via LTβ receptor on gut stromal cells is required for IgA production20. Although the anti-inflammatory and regulatory activities of intestinal IgA-producing cells21, as well as other plasmocytes22, are well known, this is the first time IgA+ plasmocytes were found to suppress anti-tumor immunity.
IgA+ plasmocytes within prostate tumors induce CD8+ cell exhaustion2 and suppress anti-tumor CTL responses through PD-L1 and IL-10, either of which can induce anergy or exhaustion2,23. Yet, B cells may regulate anti-tumor immunity by other mechanisms24,25, including indirect control of T cell infiltration via macrophages13 and IL-10 production by Breg cells26, although the latter only affect CD4+ T helper cells24,25. Notably, IL-10-expressing IgA+ cells are most abundant in therapy-resistant and metastatic human PC and circulating IgA is a well-established adverse prognostic indicator in PC27. We therefore suggest that elimination or inhibition of tumor infiltrating IgA+ plasmocytes may be the key to successful immunotherapy of PC, as long as an immunogenic chemotherapeutic, such as oxaliplatin, is also used. Immunogenic chemotherapy may also enhance response rates to PD-1 or PD-L1 blockade in other malignancies, including bladder cancer and cutaneous melanoma where only 35% of the patients exhibit a response28.
Methods
Animal models
C57BL/6 and FVB control mice were from Charles River Laboratories and CD45.1 mice29 were from the Jackson Laboratory, and all were bred at the University of California San Diego (UCSD) animal facility. C57BL/6-Tg(TRAMP)8247Ng/J (TRAMP mice)30_were backcrossed to the FVB strain for more than 10 generations. The median survival of TRAMP-FVB mice was 23 weeks compared to 52 weeks for TRAMP-C57BL/6 mice. TRAMP mice were crossed with B cell-deficient (Jh-/-) mice31, CTL-deficient (Cd8a-/-) mice32 or Rag1-/- mice, which lack both B and T cells33, all in the FVB-background. OT-I mice were obtained from Taconic18. Tgfbr2F/F (FVB-background) mice were obtained from Dr. Hal Moses at Vanderbilt University34. Tcrb-/-, Cd19-Cre, Il10-/- and CD45.1 mice were purchased from the Jackson Laboratory. IgA gene-deficient (Iga-/-) mice35 were obtained from Baylor College of Medicine. Pdl1/2-/- mice were obtained from Genentech (San Francisco, CA). Cd19-Cre and Iga-/- mice were backcrossed to the FVB strain for more than 10 generations. All mice were maintained in filter-topped cages on autoclaved food and water at the UCSD animal facility and all experiments were performed in accordance with UCSD and NIH guidelines and regulations.
Mouse treatment studies were “matched design control trials.” Accordingly, mice were randomly chosen and paired based on sex (male), age (Extended Data Fig. 1a) and tumor size. For transplanted tumor models, tumor size was defined by the median tumor volume (e.g. 400 mm3, for late treatments, Extended Data Fig. 1a,e). For TRAMP transgenic tumor models, treatment decisions were made based on age and mice were randomly chosen including a control littermate. An identification code was assigned to each tumor-bearing mouse both in the transplanted and transgenic models, and the investigators were blinded to treatment allocation at the time of tumor volume measurement, autopsy and analysis.
The number of mice used in each experiment and the number of experiments are shown in Supplementary Table 1.
Flow cytometry and lymphocyte isolation
For lymphocytes isolated from spleen and lymph nodes, standard protocols using filters have been used. Lymphocytes were isolated from human blood using Ficoll-Paque PLUS (GE Healthcare Life Science) according to manufacturer's recommendations. For lymphocyte isolation from tumors (mouse and human), tumors were cut into small pieces and incubated in dissociation solution (RPMI medium supplemented with 5% FBS, collagenase type I (200 U/ml), collagenase type IV (200 U/ml), and DNase I (100 μg/ml) for 30 min at 37° C. After incubation, cell suspensions were passed through a 50 μm cell strainer and washed twice. For large tumors (≥ 0.7 g), hematopoietic cells were pre-enriched using density gradient centrifugation (Percoll or Ficoll), and red blood cells were lysed (RBC Lysis buffer, multi-species; eBioscience). For blocking of Fc-mediated interactions, mouse cells were pre-incubated with 0.5-1 μg of purified anti-mouse CD16/CD32 (93) per 100 μl and human cells were incubated with FcR blocking reagent (Miltenyi Biotec). Isolated cells were stained with labeled antibodies in PBS with 2% FCS and 2 mM EDTA or cell staining buffer (Biolegend). Dead cells were excluded based on staining with Live/Dead fixable dye (eBioscience). For intracellular cytokine staining, cells were restimulated (Myc-Cap cell lysate, PMA/ionomycin or PMA/ionomycin/LPS, as indicated) in the presence of a protein transport inhibitor cocktail containing Brefeldin A and Monensin (eBioscience), as indicated. For CD107, a staining antibody was added to the culture during the stimulation. After 5 hrs, cells were fixed and permeabilized with BD™ Cytofix/Cytoperm reagent for cytokine staining. BD™ transcription factor buffer was used for Foxp3 and T-bet staining and BD™ Phosflow was used for p-SMAD2/3 and p-STAT staining (BD Biosciences) according to manufacturer's recommendations. After fixation/permeabilization, cells were stained with labeled antibodies of interest. Moreover, Il10 and β-actin mRNA expression were analyzed on single cell level by flow cytometry in combination with CD45, IgA and IL-10 protein staining, using FlowRNA II Assay kit (Affymetrix eBioscience) according to manufacturer's protocols36. Cells were analyzed on a Beckman Coulter Cyan ADP flow cytometer. Data were analyzed using FlowJo software (Treestar). Immune cell analysis of tumor-free mice of different genetic backgrounds (C57BL/6 and FVB) and different genetic ablations are shown in Extended Data Fig. 10d-p. The gating strategies and isotype controls for p-STAT1 and IL-10 staining are shown in Extended Data Fig. 10q-u.
Adoptive lymphocyte transfer
For adoptive T cell transfer (ATCT) CD8+ T cells were isolated from single cell suspensions, prepared from spleens and lymph nodes as described above, using CD8α-specific microbeads and MACS-columns (both Miltenyi Biotec GmbH, Bergisch Gladbach, Germany), and 5 × 10⁶ CD8+ T cells were transferred intraperitoneally (i.p.; Extended Data Fig. 9a-j). For adoptive B cell transfer (ABCT), B cells (B220+/CD19+) were isolated from single cell suspensions prepared from spleens using CD19- and B220-specific microbeads and MACS-columns, and 5 × 10⁶ B cells were transferred i.p. (Fig. 4g, Extended Data Fig. 7n-p). For adoptive splenocytes transfer (ACT), single cell suspensions prepared from spleens were transferred i.p., with one total spleen injected per mouse. Labelling with 5- (and 6-) carboxyfluorescein diacetate succinimidyl ester (CFSE; Molecular Probes, Eugene, OR) was done according to manufacturer's protocol. 5 × 10⁶ CD8+ T cells or 7 × 10⁶ B cells were transferred (equal to one spleen per mouse; Fig. 5a-f and Extended Data Fig. 9k-r). For combined adoptive B and T cell transfer (Fig. 5jg-i, Extended Data Fig. 10a-c), T cells were isolated from WT-FVB mice immunized with a Myc-Cap cell lysate as previously described37. Specifically, Myc-Cap cells were incubated with oxaliplatin (40 μM) for 48 hrs. The extent of cell death was determined by flow cytometry, showing that more than 90% of cells were positive for Annexin V and PI. The dead cells were injected subcutaneously (s.c.) into WT-FVB mice. Seven days later, T cells were isolated from single cell suspensions of spleen and LN using a Pan T cell isolation Kit (Miltenyi Biotec). B cells were isolated from spleens of naïve FVB-WT or FVB-Tgfbr2ΔB mice using a Pan B cell isolation kit (Miltenyi Biotec). MC-tumor bearing Rag1-/- mice received 5 × 10⁶ T cells with or without 5 × 10⁶ B cells (98% pure) from WT or Tgfbr2ΔB mice. Purity was analyzed on a Beckman Coulter Cyan ADP flow cytometer and was always > 98%. Absolute numbers of particular immune cells in spleen were calculated by multiplying the CD45+ cell number from one spleen by the percentages of the particular cell type amongst CD45+ cells. Absolute numbers of particular immune cells (e.g. CD8+ cells) in tumors were calculated by multiplying the cell number in one tumor portion by the percentages of the corresponding cell type in vital tumor cells divided by the weight of the analyzed tumor fragment.
Subcutaneous tumor models
2 × 10⁶ Myc-Cap5 or 3 × 10⁶ TRAMP-C217 cells (purchased from ATCC) were s.c. injected into the right flank. Tumors were measured every 2-3 days using a caliper. Tumor volumes were calculated as width2 × length/2.
Immune-mediated B cell depletion
B cells were depleted as previously described38. Mice were weekly injected (i.p.) with a mixture of monoclonal antibodies, each at 150 μg/mouse: rat anti–mouse CD19 (clone 1D3), rat anti–mouse B220 (clone RA36B2), and mouse anti–mouse CD22 (clone CY34). After 48 hrs, the mice were injected with a secondary antibody (mouse anti–rat kappa chain; GeneTex) at 150 μg/mouse. In addition, mice were injected weekly, but not on the same day, with 250 μg/mouse rat anti-mouse CD20 (Genentech). Rat anti-mouse IgG2a and IgG1 were used as isotype controls. Mice were treated for 3 weeks in total (Fig. 1f; Extended Data Fig. 2j-p).
Oncomine data analysis
In silico analysis of human IgA (IGHA1) mRNA expression was performed using 15 PC microarray gene datasets14,39-52 from the Oncomine database (Compendia Biosciences; Ann Arbor, MI, USA; www.oncomine.org)53 comparing a combined 126 carcinoma/adenocarcinoma specimens to 30 normal (either benign, disease-free normal and/or normal adjacent) tissue specimens. Evaluation criteria were set as p < 0.05, fold change > 2.0, and gene rank in the top 10%.
Analysis of human specimens
Paraffin-embedded specimens from a total of 110 PC patients were integrated into a tissue microarray system (TMA) constructed at the Clinical Institute of Pathology at the Medical University of Vienna (MUV). All of the human specimens used for TMA construction were approved by the MUV Research Ethics Committee (1753/2014). The cohort included 87 patients with early PC (E-PC), 9 patients with therapy-resistant PC (TR-PC), and 15 patients with metastatic PC (M-PC). Patients' demographic and histopathological features are shown in Supplementary Table 2.
TMA were designed to provide two cores of normal prostate tissue and four cores of PC tissue from each E-PC patient, and 3-6 cores of tumor tissue for each TR-PC and M-PC patient. Stained TMA slides were digitalized by virtual microscopy at 20 × magnification with a fixed light intensity and resolution into a bright-field image using the Nanozoomer (Hamamatsu) scanner. Computer-assisted image analysis of individual TMA core images was used to quantify the percentage of CD8+ and CD20+ immune reactive area (IRA%) as a proportion of the total digitized haematoxylin-stained region, as previously described54. For each PC patient, the mean continuous values of CD8+ and CD20+ IRA% in TMA cores without technical artifact for normal and tumor prostate tissue were calculated and used for subsequent statistical analysis. The presence of CD138+ and IgA+ double immunoreactivity for plasma cells in the stromal compartment or directly contacting a cancer cell was semi-quantitatively scored in TMA cores for each patient by an investigator who was blinded to the patients tumor features. A value of 0 was assigned to tissue cores without evidence of stromal CD138+/IgA+ double immunoreactive cells and a value of 1 was recorded when CD138+/IgA+ double immunoreactive cells were present in the stromal compartment. Furthermore, after approval from the UCSD institutional review board (IRB), whole tissue slides were subjected to immunohistochemical (IHC) analysis of αSMA+/IgA, CD8+/IgA and IL-10+/IgA double staining from a cohort of formalin-fixed, paraffin-embedded (FFPE) radical prostatectomy specimens. As previously described55, this cohort included up to 50 patients, which were selected based on known clinical outcome according to risk categories of low-, intermediate- and high-risk groups based on the D'Amico risk classification56.
Anonymized fresh prostatectomy and blood samples from consented human subjects, and de-identified clinical information were provided under the UCSD Moores Cancer Center Biorepository and Tissue Technology IRB approved protocol and provided to investigators (M.K., C.J.K., C.A.M.J., D.E.H.) with Cancer Sample Banking Committee approval. Fresh, de-identified samples of human prostate tissue and blood in 10 ml EDTA-coated tubes were collected from patients undergoing radical prostatectomy for clinically localized, intermediate or high risk PC, Gleason grade 3+4 or higher. A board-certified genitourinary pathologist (D.E.H.) collected samples of fresh prostate tumor and adjacent benign tissue, within 1 hr of radical prostatectomy, that were 5-10 mm in diameter.
Immunostaining
Tissues were embedded in Tissue Tek OCT (Sakura Finetek, Torrance, CA, USA) compound and snap-frozen. Tissue sections were fixed in cold acetone/methanol or 3% PFA for 3-10 min and washed with PBS. Slides were blocked with 1× PBS/1% normal donkey or goat serum for surface staining or 0.2% gelatin (from cold water fish skin; Sigma-Aldrich)/PBS/1% normal donkey or goat serum for intracellular staining for 30 min. Sections were incubated with primary antibodies for 1 or 12 hrs at RT or 4° C, respectively. After washing with PBS, secondary antibodies were added for 1 hr at RT. As negative controls, samples were incubated with isotype-matched control antibodies or secondary antibodies only. After staining with DAPI, sections were covered with Vectashield Mounting Medium (Vector Laboratories, Burlingame, CA USA). TMA tissue slides from formalin-processed and paraffin-embedded tumor sections were processed for immunohistochemistry. After de-paraffinization and rehydration, sections were immersed in a pre-heated antigen retrieval water bath with a pH 6.1 citrate buffer, or Dako Target Retrieval Solution for 20 minutes at 95-96°C. ImmPRESS™ Polymer System Diaminobenzidine tetrahydrochloride (DAB) peroxidase substrate-based chromogens were used for single staining of CD8, CD20 and for IgA staining when combined with CD138 and for αSMA staining when combined with IgA for IHC of human samples. ImmPACT™ Vector® NovaRED™ peroxidase substrate-based chromogens were used for CD138 staining when combined with IgA for IHC of human samples. ImmPACT™ Vector® Red Alkanine Phosphatase substrate-based chromogens were used for IgA staining when combined with αSMA for IHC of human samples. All stainings were done according to the manufacturer's protocols (Vector Laboratories). Nuclei were lightly counterstained with a freshly made haematoxylin solution then further washed in water and mounted. Sections were examined using an Axioplan 200 microscope with AxioVision Release 4.5 software (Zeiss, Jena, Germany) or TCS SPE Leica confocal microscope (Leica, Germany).
Antibodies
Antibodies specific for the following antigens were used: mAb rabbit to cleaved Caspase 3 (# 9661) or p-γH2AX (Ser139; 20E3) (Cell Signaling Technology, Danvers, USA); pAb rabbit to: CD3 (Dako, IS503); αSMA (Dako); Tim-3 (B8.2C12); Tim-1 (RMT1-4); p-SMAD2/3 (D27F4); LC3B (D11) and CD138 (Syndecan-1) (anti-mouse Biolegend,; anti-human Dako Ml15); IgA (mA-6E1, m11-44-2, mRMA-1, anti-mouse eBioscience/Biolegend; anti-human for IHC: Dako, A0262; for FACS: Miltenyi); AID (MAID-2); CD8a (m53-6.7, human DAKO, C8/144B); CD45 (hOKT4); CD20 (AISB12, hL26); CD44 (IM7); CD4(RM4-5); B220 (RA3-6B2); CD19 (m1D3, hHIB19); IgM (II/41); IgD (11-26c); TNF (MP6-XT22); IFNγ (XMG1.2); GrzB (NGZB); CD107a (eBio1D48); PD-1 (J43); PD-L1 (MIH5); FAS-L1 (MFL3); Ki67 (SolA15); IgG2a (m2a-15F8); IgG1 (M1-14D12); IL-10 (mJES5-16E3; hJES3-9D7: IHC: hIL-10: AF-217-NA); CD69 (H1.2F3); FoxP3 (FJK/16s); CD11c (N418); CD11b (M1/70); MHCII (M5/114.15.2); Gr-1 (1A8-l66g); F4/80 (BM8) and NK1.1 (NKR.P1C) (all from eBioscience); CD31 (PECAM-1, MEC 13.3); CD45 (m30-F11); p-STAT1 (pY701) and p-STAT3 (pY705) (BD Bioscience): and αSMA (anti-mouse ab5694; anti-human: DAKO, 1A4). The following Alexa 594-, Alexa 647-, Alexa 488-conjugated secondary antibodies were used: donkey anti-rat IgG, donkey anti-rabbit IgG, donkey anti-goat IgG and goat anti-rat IgG (Molecular Probes, Invitrogen).
ELISA
Anti-SV40 Tag immunoglobulin ELISA was performed as described57. IgA and IgG ELISA kits were purchased from eBioscience, and used according to manufacturer's protocols. Tumoral single cell suspension has been prepared as described above in the flow cytometry section, and was washed 2-3 times with 1×PBS/2mM EDTA/2% FCS, to remove soluble IgA. Thereafter, about 3 × 10⁶ cells/24-well were plated in either 10% FCS/DMEM or Hybridoma medium (Life Technology). After 24 hrs, the supernatants were analysed for IgA content. Media without cells were used as controls.
Treatment with chemotherapy or antibodies
Oxaliplatin was diluted in 5% dextrose and i.p. injected weekly at 6 mg/kg as indicated. Anti-PD-L1 antibody was i.v. injected at 10 mg/kg once, followed by 5 mg/kg bi-weekly. Mice were treated for three weeks for a total of 7 doses/animal.
Q-RT-PCR analysis
Total RNA was extracted using an RNeasy Plus kit (Qiagen). RNA was reverse transcribed using an IScript kit (Biorad). Q-RT-PCR was performed using Ssofast EvaGreens upermix (Biorad) on a Biorad CFX96 machine. Primer sequences are listed below and generally were obtained from the NIH qPrimerDepot (http://mouseprimerdepot.nci.nih.gov). The relative expression levels of target genes were measured in triplicates and normalized against the level of RPL32 expression. Fold-difference (as relative mRNA expression) was calculated by the comparative CT method (2(Ct(RPL32–gene of interest))).
| Name | primer 1 | primer 2 |
| IFNγ | TGAACGCTACACACTGCATCT | GACTCCTTTTCCGCTTCCTGA |
| TNF | GGTCTGGGCCATAGAACTGA | CAGCCTCTTCTCATTCCTGC |
| IL-10 | GGTTGCCAAGCCTTATCGGA | ACCTGCTCCACTGCCTTGCT |
| Perforin | TGGAGGTTTTTGTACCAGGC | TAGCCAATTTTGCAGCTGAG |
| TGFβ1 | AAGTTGGCATGGTAGCCCTT | GGAGAGCCCTGGATACCAAC |
| NOS2 | TCCAGGGATTCTGGAACATT | GAAGAAAACCCCTTGTGCTG |
| Arginase 1 | TTTTTCCAGCAGACCAGCTT | CATGAGCTCCAAGCCAAAGT |
| Granzyme B | CTCTCGAATAAGGAAGCCCC | CTGACCTTGTCTCTGGCCTC |
| RPL32 | TTGTGAGCAATCTCAGCACA | GGGAGCAACAAGAAAACCAA |
| IL-21 | CCC TTG TCT GTC TGG TAG TCA TCT T | GGA GGC GAT CTG GCC C |
| IL-12p35 | GAGGACTTGAAGATGTACCAG | CTATCTGTGTGAGGAGGGC |
| IL-12p40 | GAC CCT GCC CAT TGA ACT GGC | CAA CGT TGC ATC CTA GGA TCG |
| PD-L1 | TGC TGC ATA ATC AGC TAC GG | CCA CGG AAA TTC TCT GGT TG |
Statistical analysis
Data are presented either averages ± S.E.M or median of continuous values and were analyzed by Students' t-test or Mann-Whitney-U, respectively, for comparison of two groups. Kruskal-Wallis test was used to compare three or more groups. Long-rank (Mantel-Cox) tests were used to compare survival curves. Fisher's exact Chi-square P values were used to calculate statistical significance of categorical values between groups. Two tailed p-values of ≤ 0.05 were considered significant. Unpaired t test-independent studies were used to determine the minimum sample sizes (StatsDirect Version 2.8.0). GraphPad PRISM software was used for statistical analyses.
Extended Data
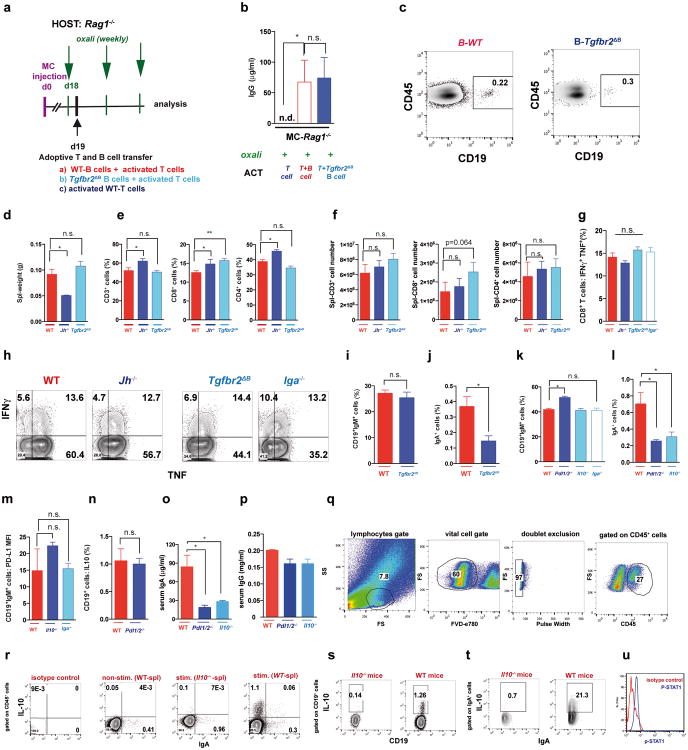
Extended Data Figure 1. Treatment schemes and characterization of tumors and mouse survival before and after treatment.
a, Early and late treatment schemes for TRAMP mice. b, TRAMP mice (n= 3-6/group) were subjected to early oxaliplatin treatment as described in (a) and prostate weights were determined at 14 weeks, one week after completion of 4 treatment cycles. Dashed red line indicates prostate weight of tumor-free controls (n=33 in total). c-d, Histopathology of TRAMP tumors. c, Representative images of H&E stained prostate sections from TRAMP mice are shown. Magnification bars: 100 μm. PIN, prostatic intraepithelial neoplasia; WD, well differentiated adenocarcinoma; PD, poorly differentiated adenocarcinoma. d, Histopathological assessment of early and late treated TRAMP tumors in WT and Jh-/- mice without or with oxaliplatin treatment. The percentages of the different histotypes shown in (c) are depicted (n=3-7/group). Fisher chi-square analysis was used to calculate statistical significance. e, Early and late treatment schemes for mice bearing s.c. MC tumors. f, MC cells were s.c. transplanted into WT and Jh-/- mice (n= 3-7/group) that were subjected to early oxaliplatin treatment when tumor volume was 100 mm3. 48 hrs after completion of 3 treatment cycles, mice were sacrificed and tumor volumes (mm3) were measured (n=19 in total). Prostate weight in (f) is shown in a Log 2 scale. g, MC tumors from indicated mice were stained for CD45 (green) and cleaved caspase 3 (CC3; red) (n=4-6/group). h,i, MC tumors (n=3-5/group) grown in WT, Jh-/- and Cd8a-/- mice were stained for CD45 (green) and p-γH2AX (red), and the p-γH2AX+ foci in CD45- cells were enumerated (i). Magnification bars: 100 μm. All results are means ± s.e.m. j, Representative images of s.c. MC tumors (n=5-6/group) from WT and Jh-/- mice, with or without oxaliplatin treatment stained for αSMA (green) and CD31 (red). k, l, Frequency of αSMA (k) and CD31 (l) positive cells within tumors from (j). Shown are median values ± s.e.m. Mann-Whitney and t tests were used to calculate statistical significance indicated by *P, 0.05; **P, 0.01; ***P, 0.001. m, TRAMP mice (WT, Cd8a-/- or Jh-/-; n=6-14/group) were treated weekly with low-dose oxaliplatin. Moribund mice were sacrificed, and survival was compared by Kaplan-Meyer analysis and significance was determined (WT: n.s.; Cd8a-/-: n.s.; Jh-/-; p<0.002;**). n, Survival curves for the different TRAMP groups before and after oxaliplatin treatment. Significant differences in survival times are indicated on the right. No statistically significant differences in survival were found between WT and Jh-/- or Jh-/- and Cd8a-/- mice without treatment. Significant differences in survival times were observed between all three oxaliplatin-treated groups (WT, Cd8a-/- or Jh-/-; indicated on the right).
Extended Data Figure 2. B cells attenuate oxaliplatin-triggered CTL activation.
a, Flow cytometry of CD8+ T lymphocytes in prostates of 20 weeks old TRAMP mice after 4 cycles of oxaliplatin treatment (n=5-7/group) normalized to prostate weights. b, Late s.c. MC tumors from WT and Jh-/- mice were stained for CD8 and analyzed by immunofluorescent microscopy. In the upper left areas (white square), single CD8 staining (green) without DAPI counterstain is shown. Tumoral CD8+ cells were counted in 3-4 HMF (200×)/tumor (n=4-5 tumors/group). Magnification bars: 100 μm. c,d, Late s.c. MC tumors were analyzed by flow cytometry for CD4+ lymphocytes in spleens (c) and tumors (d) after 3 oxaliplatin treatment cycles (n=4-7/group). The results show percentages of CD4+ cells in the CD45+ population. e, Flow cytometric analysis of TNF and IFNγ expression by CD8+ cells in MC tumors from WT and Jh-/- mice treated as above (n=6-8) and re-stimulated in vitro with tumor cell lysate. f, Flow cytometry of STAT1 phosphorylation in CD8+ cells from MC tumors of treated and untreated WT, and Jh-/- mice (for isotype controls, see E.D. Fig. 10u). The results are summarized in the right panel (n=3 mice/group). g, Expression of GrzBand Ki-67in CD8+ T effector cells (CD8+CD44+) from spleens of MC inoculated mice after oxaliplatin treatment. h,i, Flow cytometry of PD-1 and Tim-3 expression by CD8+ effector cells (CD8+CD44+ cells) in spleen (h) and MC tumors (i) as indicated with or without oxaliplatin treatment. Shown are percentages of the corresponding CD8+ T cells in the CD8+CD44+ population (n=3-5/group). j, The experimental scheme for B cell immunodepletion in tumor-bearing mice. MC tumors were raised in WT or Cd8a-/- mice, 16 days after s.c. tumor cell inoculation. B cells were depleted by twice weekly administration of antibodies directed against CD19, CD20, CD22 and B220. Four days after first antibody treatment, mice were treated with oxaliplatin (n=4-7 mice/group, total: 44). After 3 weekly chemotherapy cycles, mice were sacrificed. k, Flow cytometry analysis of tumor-infiltrating CD45+CD8+ T cells stained for IFNγ (left) or IFNγ and TNF (right) after in vitro restimulation with PMA/ionomycin (n=4-6 mice/group). l-n, Flow cytometry analysis of CD19+ (l,m) and IgA+ (n) cells in spleens and tumors isolated from the WT mice described above, confirming depletion of CD19+ B cells and oxaliplatin-induced IgA+ cells in spleen and tumors. o, Serum IgA concentrations in the mice described in i (n=3-5/group). p, Flow cytometry analyses of CD19+ B cells in tumors isolated from Cd8a-/- mice subjected to B cell depletion or not, confirmed the efficient depletion of tumoral CD19+ B cells. All results are means ± s.e.m. Mann-Whitney and t tests were used to calculate statistical significance indicated by *P, 0.05; **P, 0.01; ***P, 0.001.
Extended Data Figure 3. Immunogenic chemotherapy induces tumor infiltration by immunosuppressive CD19+CD20lowB220lowIgA+ B cells.
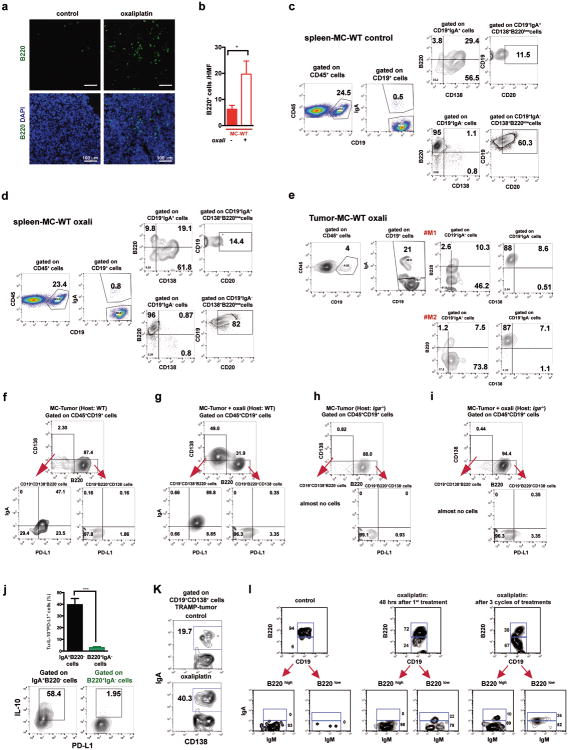
a,b, MC tumors (n=4-9/group) raised in WT mice without or with oxaliplatin treatment were stained for B220 (a), and tumor-infiltrating B220+ cells per HMF were enumerated (b). In panel a, single B220 staining (above) and combined staining B220/DAPI (below) are shown. Magnification bars: 100 μm. c,d, The flow cytometry plots and gating strategy for analysis of splenic B cell populations using CD19, IgA, B220, CD138 and CD20 antibodies. Results from WT mice bearing MC tumors are shown in panel (c) and from oxaliplatin-treated mice in panel (d) (n=8 mice/group). Oxaliplatin treatment modestly increased the amount of splenic IgA+ cells. Splenic IgA+ cells expressed CD138 as expected and showed lower levels of B220 and CD20, in either control or oxaliplatin-treated mice. e, The gating strategies for analysis of tumoral B cells using CD19, IgA, B220 and CD138 antibodies. Results from MC tumors in two representative oxaliplatin-treated WT mice are shown (n=8 mice/group), demonstrating the presence of IgA+ cells in oxaliplatin-treated tumors with a typical CD138+B220low phenotype. f-i, Flow cytometry plots and gating strategies for analysis of tumoral B cell populations using CD19, B220, CD138, IgA and PD-L1 antibodies. Results from WT mice bearing MC tumors without (f) or with oxaliplatin treatment (g) (n=6 mice/group) and Iga-/- mice bearing MC tumors without (h) or with oxaliplatin treatment (i) (n=6 mice/group) are shown. Oxaliplatin treatment increased the amount of tumoral IgA+CD138+B220lowPD-L1+cells in WT mice. j, Flow cytometric analysis of PD-L1 and IL-10 expression in IgA+B220- and B220+IgA- B cells from oxaliplatin-treated TRAMP tumors (n=4). k, Flow cytometric analysis of IgA and CD138 expression by TRAMP tumor-infiltrating B cells. Shown are percentages of IgA+ cells amongst all tumor-infiltrating CD19+CD138+ cells. l, WT mice bearing MC tumors were treated with oxaliplatin as above. Two days after the first or last oxaliplatin cycle, mice were sacrificed, tumors were isolated and analyzed by flow cytometry as indicated (n=6/group). After dead cell exclusion, tumor-infiltrating B cells were stained with CD19, CD20, B220, IgA and IgM antibodies. Shown are the results for control (left panels), one cycle (middle panels), and 3 cycles (right panels) of oxaliplatin treatment, demonstrating the presence of tumoral IgA+ cells with a CD19+CD20lowB220low IgA+ cell phenotype within 48 hrs after oxaliplatin treatment.
Extended Data Figure 4. Immunogenic chemotherapy induces tumoral and systemic IgA production through class switch recombination.
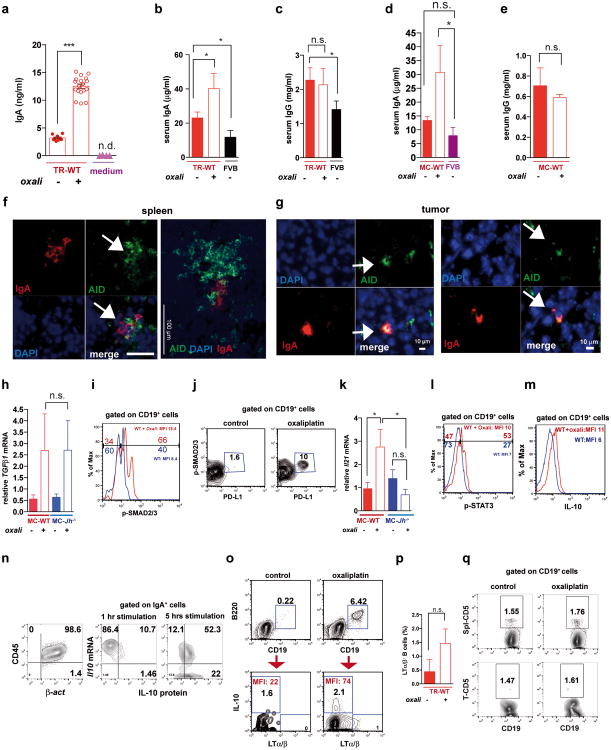
a, Ex vivo analysis of IgA released by tumor single cell suspension isolated from oxaliplatin-treated TRAMP tumors. Single cell suspension from non-treated tumors and culture medium without cells were used as controls. b,c, Serum IgA (b) and IgG (c) in treated and untreated TRAMP mice and age-matched naïve FVB controls (n=7-14/group). d, Serum IgA amounts in control or oxaliplatin-treated mice bearing MC tumors (n=5-7/group) were determined and compared to age-matched naïve FVB controls (n=7). e. Serum IgG amounts in control or oxaliplatin-treated mice bearing MC tumors (n=5-7 mice/group) were determined and compared to age-matched naïve FVB controls. a-e, Results are means ± s.e.m. Mann-Whitney and t tests were used to calculate statistical significance. f,g, Immunofluorescence analysis of activation-induced cytidine deaminase (AID, green) and IgA (red) expression in spleen (f, used as a positive control) and MC tumors from oxaliplatin-treated WT mice (g). Magnification bars: 10 μm except in panel f (right) where it is 100 μm. Arrows point to IgA+AID+ cells. Shown are representative results of spleens and tumors isolated from 4 mice/group. h, Q-RT-PCR analysis of Tgfb1 mRNA in MC tumors raised in WT or Jh-/- mice without or with oxaliplatin treatment (n=3-7 mice/group). Results are means ± s.e.m. i, Flow cytometry of SMAD2/3 phosphorylation in MC tumor-infiltrating B cells from WT mice before and after oxaliplatin treatment (n=4/group). Shown are the mean fluorescence intensities (MFI) and percentages (see Fig. 3e). j, Flow cytometry of SMAD2/3 phosphorylation and PD-L1 in MC tumor-infiltrating B cells from WT mice before and after oxaliplatin treatment (n=4/group). Shown are the percentages of PD-L1+p-SMAD2/3+ cells within CD45+CD19+ cells. k, Q-RT-PCR analysis of Il21 mRNA in MC tumors raised in WT or Jh-/- mice without or with oxaliplatin treatment (n=4-7 mice/group). Chemotherapy-induced Il21 mRNA mainly in WT mice. l,m, Flow cytometry of tumor-infiltrating B cells stained for phospho-STAT3 and IL-10 (n=5-6/group) before and after oxaliplatin treatment. n, Flow cytometry analysis of β-actin mRNA, IL-10 protein and Il10 mRNA in MC tumor-infiltrating IgA+ cells using PrimeFlow™ RNA technology (pooled data of 4 mice/group, after oxaliplatin treatment). Left panel: β-actin mRNA gated on CD45+ cells; middle panel: Il10 mRNA and IL-10 protein expression after 1 hr stimulation with PMA/ion/LPS gated on IgA+ cells, right panel: Il10 mRNA and IL-10 protein expression after 5 hrs stimulation with PMA/ion/LPS, gated on IgA+ cells. o,p, Flow cytometric analysis of tumor-infiltrating B cells in TRAMP mice (n=4-5/group) stained for CD19, B220, IL-10 and LTαβ (o). The percentage of tumor-infiltrating LTαβ+ cells amongst all tumor-infiltrating B cells was determined (p). q, Flow cytometric analyses of CD5 expression by B cells from spleen and MC-tumor of WT mice after oxaliplatin treatment (n=4-5/group). Shown are means ± s.e.m. Mann-Whitney and t tests were used to calculate statistical significance indicated by *P, 0.05; **P, 0.01; ***P, 0.001.
Extended Data Figure 5. Immunogenic chemotherapy or B cell deficiency has marginal effects on Tregs, NK and myeloid cells.
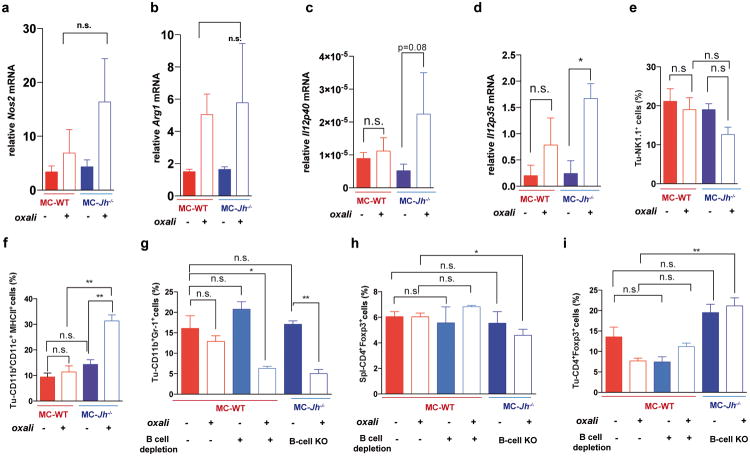
a,b, Q-RT-PCR analyses of Nos2 (a) and Arg1 (b) mRNAcontent of MC tumors (n=4-7 mice/group). Chemotherapy induced Nos2 and Arg1 expression in WT and Jh-/- mice and no significant and consistent differences were found between both groups. c,d, Q-RT-PCR analyses of Il12p40 (c), Il12p35 (d) mRNAin MC tumors grown in WT and Jh-/- mice (n=4-6 mice/group). e-i, Flow cytometry analyses of tumor-infiltrating or splenic lymphocytes and monocytes: tumoral Nk1.1+ cells (e), tumoral CD11b+CD11c+ MHCII+ cells (f), tumoral CD11b+GR-1+ cells (g), CD4+FoxP3+ cells (splenic, h; tumoral, i). Cells in panels e-i are from tumor-bearing mice subjected to oxaliplatin treatment and/or B cell depletion as indicated (B cell depletion + oxaliplatin; n=4-6 mice/group). Results are means ± s.e.m. Mann-Whitney and t tests were used to calculate statistical significance.
Extended Data Figure 6. Analyses of B and T cells in human prostate cancer specimens.
a-h, Tissue microarrays of tumor and non-tumor tissue from 110 PC patients were stained for CD8 and CD20 (5-6 spots/patient = 3-4 tumor tissue + 2 non-tumor tissue). a,b, Representative examples of CD8 (a) and CD20 (b) IHC of PC tissue microarrays (left). Magnification bar: 200 μm. Right, computer assisted image analysis with ad hoc developed image software. Tumor tissue is represented in yellow and CD8+ and CD20+ cells are represented in red. The percentages of immune reactive area (IRA) occupied by CD8+ or CD20+ cells are shown. Magnification bars: 200 μ. c,d, comparison of CD8 and CD20 IRAs in matched non-tumor and tumor tissues from each early stage PC (E-PC) patient (n=87). e-h, Patients were divided into three subgroups: E-PC (n=86); therapy-resistant-PC (TR-PC; n=9), and metastatic-PC (M-PC; n=15). e, CD8+ cell infiltration into tumor tissues of the different groups. f, CD20+ cell infiltration into tumor tissues of the different groups. g, The CD8+/CD20+ ratio for the different groups. Each dot represents one patient. Line indicates the median value. Mann-Whitney test was used to calculate statistical significance between the two groups. Kruskal-Wallis test was used to calculate statistical significance between the three groups. h, IHC analysis of low risk (n=5) and high risk (n=5) human PC specimens using IgA (red) and αSMA (black). Nuclei were counterstained with hematoxylin. Magnification bar: 100 μm i, IF analysis of human PC showing IL-10 (red) –expressing IgA+ (green) CD138+ (turquoise) plasma cells (n=6). Representative images are shown. White arrow indicates IL-10-expressing IgA+ cells. Magnification bars: 50 μm. j, Human normal prostate (n=3-5), and human PC (n=5), were stained for IgA and CD8. Typical images are shown. Red and green arrows indicate IgA+ and CD8+ cells, respectively. Magnification bar: 100 μm. k, Human normal prostate (n=3), and human PC (n=5), were stained for IgA (red arrow) and CD20 (green arrow). Magnification bar: 100 μm. l, Flow cytometric analysis of human prostate tumor-infiltrating CD19+ B cells and IgA+ cells. The percentages of IL-10-expressing B cells in CD19+IgA+ (2 different samples) and CD19+IgA- B cells are shown. m, Summary of results obtained from human blood samples taken from healthy donors (n=3) and PC patients (n=5) and prostate tissue specimens (benign, malignant; n=4) analyzed by flow cytometry for IL-10 expression in CD19+IgA- and CD19+IgA+ B cells. n,o, Tissue microarrays from 110 PC patients (described above) were stained for IgA and CD138. Patients were divided into three subgroups: E-PC (n=86); TR-PC (n=9), and M-PC (n=15). (n) Representative images of IgA (immunoperoxidase) and CD138 (alkaline phosphatase) double staining of tumor tissues from each group. CD138+ and IgA+ double positive cells in the PC stroma are indicated by the white arrows (hematoxylin counterstain). Magnification bar: 100 μm. o, Frequencies of IgA+ and CD138+ double positive cells in the tumor stroma of the different PC patient groups. p, PC patient specimens were divided into two groups: IgA-/low (n=64) and IgA+/hi (n=46). Shown is the CD8+/CD20+ ratio for each group. Each dot represents one patient. Line indicates the median value. q, IgA mRNA expression (IGHA1) is significantly elevated in human PC tissue relative to healthy or benign prostate tissue in 5 out of 15 studies evaluated via Oncomine. Results from one significant study14 are presented. Chi square test and Fischer exact test were used to calculate statistical significance shown by *P, 0.05; **P, 0.01; ***P, 0.001.
Extended Data Figure 7. Effects of TGFβR2, IgA, PD-L1 and IL-10 ablations on tumor-infiltrating lymphocytes.
MC tumors were raised in WT, Tgfbr2ΔB or Iga-/- mice (n= 5-11/group). Mice were subjected to 3 cycles of late oxaliplatin treatment after which splenic (Spl) and tumoral (Tu) B cells were analyzed. After dead cell exclusion, splenic (a,b) and tumoral (c,d) B cells were stained with CD19, B220, IgA, IgG2a and IgG1 antibodies and analyzed by flow cytometry. e, Serum IgG concentrations in control or oxaliplatin-treated WT, Tgfbr2ΔB or Iga-/- mice bearing MC tumors (n=5-9/group). f, Flow cytometry of tumor-infiltrating CD19+ B cells from WT, Tgfbr2ΔB or Iga-/- MC tumor-bearing mice (n=4-7/group) analyzed for PD-L1 expression, revealing lower PD-L1 surface expression on Tgfbr2Δ and Iga-/- B cells after oxaliplatin treatment. g, Flow cytometry of tumor-infiltrating B220hi B cells (left) and IgA+B220low B cells (right) from WT, Tgfbr2ΔB or Iga-/- MC tumor-bearing mice (n=4-7/group) analyzed for IL-10 expression, revealing no difference in IL-10 expression by B220hiIgA- B cells in the corresponding groups, and lower IL-10 expression by Tgfbr2Δ B cells after oxaliplatin treatment compared to WT mice. Results are means ± s.e.m. Mann-Whitney and t tests were used to calculate statistical significance. h, The experimental scheme. WT mice bearing MC tumors were divided into four treatment groups (n=7-8/group): 1) isotype control (IgG2a); 2) oxaliplatin (weekly); 3) anti-PD-L1 (twice weekly); 4) oxaliplatin plus anti-PD-L1 (weekly and twice weekly, respectively). After 3 treatment cycles, mice were sacrificed and analyzed. i, Tumor growth curves of tumor-bearing mice and gross appearance of untreated and treated mice. Significance was determined by Mann-Whitney and t tests. j, Flow cytometric analysis for GrzB expression by tumor-infiltrating CD8+ T effector cells (CD8+CD44+) from MC tumor-bearing mice treated as described above. Results are shown either as percentages of GrzB+ cells amongst CD8+ T cells (black), or percentages of GrzB+CD8+CD44+ T cells amongst tumoral CD45+ cells (red). k, Flow cytometry of PD-L1 expression on tumor-infiltrating IgA+ CD19+ B cells in the different treatment groups. l,m, Serum IgA (l), and IgG (m) concentrations in the different treatment groups described in panel h. n, The experimental scheme for the experiment whose results are shown in Fig. 4g,h. B cells were isolated from WT, Pdl1/2-/- and Il10-/- mice and 5 × 10⁶ cells (purity 98%) were i.p. transferred into MC tumor-bearing Jh-/- mice (16 days after MC cell inoculation). After 2 days (day 18), the mice were given 3 oxaliplatin treatment cycles and analyzed. o, Flow cytometric analysis of splenocytes after staining with CD45 and CD19 antibodies, confirming presence of B cells in the ABCT groups. Shown are percentages and absolute B cell numbers in spleen. p, Tumor infiltrating CD8+ cells from MC tumor-bearing Jh-/- mice transplanted with B cells and treated as above were re-stimulated for 4 hrs with PMA/ionomycin before flow cytometry (n=4-6 mice/group). Results are means ± s.e.m. Mann-Whitney and t tests were used to calculate statistical significance.
Extended Data Figure 8. Low dose cisplatin treatment is devoid of immunogenic activity and low dose oxaliplatin does not affect gut barrier function.
a, Flow cytometry of MC cells stained with Annexin V and propidium iodide 24 hrs after treatment with either oxaliplatin or cisplatin (both at 20 μM). b, Flow cytometry analysis of MC cells treated as above and stained with antibody to the autophagy marker LC3A. c-e, MC tumors were raised in WT and Jh-/- mice until 400 mm3 in size, after which the mice were treated with either cisplatin or oxaliplatin at 6 mg/kg (n=4-5/group). After 3 weekly chemotherapy cycles, mice were sacrificed. c, Tumor weights; left panel: WT mice; right panel: Jh-/- mice. d, e, Flow cytometry of tumor-infiltrating CD8 (d) and CD4 (e) cells. Left panel: WT mice, right panel: Jh-/- mice. f, Gut permeability was measured in WT mice before and after low (LD) and high (HD) dose oxaliplatin treatment using orally administered fluorescein isothiocyanate (FITC)–dextran. Shown are FITC-dextran concentrations in serum (μg/ml) (n=5 mice/group). g, Serum IgA concentrations in naïve WT (FVB) and Tgfbr2ΔB mice before and after oxaliplatin treatment. h, IgA staining of colon sections of untreated or LD oxaliplatin-treated WT mice. Magnification bars: 100 μm. i-k, Flow cytometry of CD8+ (i), CD4+ (j) and Nk1.1+ (k) cells in spleens of naïve WT and Tgfbr2Δ mice without or with oxaliplatin treatment. All results are means ± s.e.m. Mann-Whitney and t tests were used to calculate statistical significance shown as *P, 0.05; **P, 0.01; ***P, 0.001.
Extended Data Figure 9. Immunogenic chemotherapy supports adoptive T cell transfer only in the absence of B cells.
a, The experimental scheme. Immunogenic TRAMP-C2 cells were s.c. inoculated into WT or Tcrβ-/- mice. After 30 days, the mice were divided into 4 groups (n=4-5/group): 1) control, 2) oxaliplatin (weekly), 3) ATCT, 4) ATCT plus oxaliplatin (weekly). The first oxaliplatin cycle was given at day 31. Two days after the second cycle, CD8+ T cells from CD45.1×CD45.2 WT mice (3 × 10⁶ cells) were transferred into tumor-bearing mice and this was followed by two more oxaliplatin cycles after which mice were sacrificed for analysis on day 59. b, Tumor volumes (mm3) c,d, Flow cytometric analysis of spleen (c) and tumor (d) cells after staining with CD45.1, CD45.2, CD8 and TCRαβ antibodies, confirming expansion of adoptively transferred T cells. e, tumor growth curves. f, The experimental scheme. Immunogenic TRAMP-C2 cells were s.c. inoculated into WT or Rag1-/- × OT-1 mice (no B cells), that harbor CD8+ T cells specific for chicken ovalbumin which is not expressed by TRAMP-C2 cells. After 30 days, tumor-bearing Rag1-/- × OT-1 mice were divided into 4 groups (n=3-4 mice per group): 1) control, 2) oxaliplatin treatment, 3) ATCT, 4) oxaliplatin treatment plus ATCT. The first oxaliplatin cycle was given at day 31. Two days after the second oxaliplatin cycle, CD8+ T cells (3 × 10⁶) from CD45.1×CD45.2 mice were adoptively transferred into tumor-bearing mice, which were sacrificed on day 59 and analyzed. g, Flow cytometric analysisof tumor-infiltrating cells stained with CD45.1, CD45.2, CD8 and TCRαβ antibodies, confirming infiltration of adoptively transferred T cells. h, Flow cytometric analysis of GrzB expression in adoptively transferred, tumor-infiltrating, CD8+ effector cells (CD45.1+CD8+CD44+) from tumor-bearing mice treated as above. i, Tumor volumes (mm3). j, tumor growth curves. k, The experimental scheme for Fig. 5a-f. Sixteen weeks old TRAMP;Rag1-/- mice (no B and T cells) were treated with oxaliplatin (weekly). One day after the 1st treatment cycle, CFSE-labeled splenocytes from either WT (B and T cells, SP-WT) or Jh-/- (T but no B cells, SP-Jh-/-) mice were transferred into the tumor-bearing mice (5 × 10⁶ T cells per mouse; 4-5 mice per group). l, m, After 6 days, one mouse from each group was sacrificed, and the proliferation of CD8+ (l) and CD4+ (m) T cells in bone marrow (BM), spleen and prostates was analyzed by CFSE staining and flow cytometry. n-r, After 3 more oxaliplatin cycles (4 weeks in total), the mice were sacrificed and analyzed. n, Frequency of adoptively transferred CD19+ cells amongst CD45+ cells in spleens and prostates 30 days after ACT. o, Flow cytometric analyses of CD19+ B lymphocytes for TIM-1 expression in spleens (left) and prostates (right) of abovemice. p-r, Flow cytometric analyses of T lymphocytes. Percentages of CD8+ and CD4+ T cells in LN (p); spleens (q); prostates (r) of above TRAMP;Rag1-/- mice. Red:splenocytes from WT mice (T and B cell transfer), blue: splenocytes from Jh-/- mice (T cell transfer). Results are means ± s.e.m. Mann-Whitney and t tests were used to calculate statistical significance.
Extended Data Figure 10. Immunogenic chemotherapy supports adoptive T cell transfer only in the absence of B cells and analysis of lymphocytes and monocytes in tumor-free mice.
a, The experimental scheme for Fig. 5g. MC tumor-bearing Rag1-/- mice (no B and T cells) were treated with oxaliplatin (weekly). One day after 1st oxaliplatin treatment, 5 × 10⁶ T cells (negative selection) from WT mice immunized with MC cell lysate10 were adoptively transferred into tumor-bearing mice (4-5 mice/group), alone or in combination with 5 × 10⁶ B cells from WT or Tgfbr2ΔB mice (purity 98%). After 2 more oxaliplatin cycles (3 weeks total), the mice were sacrificed and analyzed. b, Serum IgG analysis of above mice. c, Flow cytometric analysis of splenocytes after staining with CD45 and CD19 antibodies. All results are means ± s.e.m. Mann-Whitney and t tests were used to calculate statistical significance. Statistical significance is given by *P, 0.05; **P, 0.01; ***P, 0.001. d-p, WT, Jh-/-, Iga-/- and Tgfbr2ΔB mice in the FVB background and WT, Pdl1/2-/-, Il10-/- and Iga-/- in the C57BL/6 background were analyzed for the distribution of immune markers. d, Spleen weights of WT, Jh-/- and Tgfbr2ΔB mice in the FVB background. e, Flow cytometry of splenocytes for the following markers: CD3 (left), CD8 (middle), CD4 (right), gated on the splenic CD45+ population. f, Absolute cell numbers of splenic CD3+ (left), CD8+ (middle), and CD4+ (right) cells are shown (percentage × cell count of whole spleen). g,h Flow cytometry for TNF and IFNγ in CD8+ cells from tumor-free WT, Jh-/-, Tgfbr2ΔB and Iga-/- mice (n=6-8) that were re-stimulated in vitro with PMA/ionomycin and the representative flow cytometry panels (e). i,j, Flow cytometry of splenocytes from WT and Tgfbr2ΔB for: CD19+IgM+ cells (i) and IgA (j) gated on the splenic CD45+ population. k-n, Flow cytometry of splenocytes from WT, Pdl1/2-/- and Il10-/- mice for: CD45+CD19+IgM+ cells (k), CD45+IgA+ cells (l), PD-L1 expression by CD19+IgM+ cells (m), and IL-10 expression by CD19+ cells (n). o,p, Serum IgA and IgG concentrations were analyzed in WT, Pdl1/2-/- and Il10-/- mice (n=4-5 mice/group). All results are means ± s.e.m. Mann-Whitney and t tests were used to calculate statistical significance shown as *P, 0.05; **P, 0.01; ***P, 0.001. The different gating strategies and staining controls are shown. q, Gating strategies for tumor-infiltrating lymphocytes: lymphocyte gate, dead cell exclusion, doublets exclusion, and gating on the CD45+ population. r, Flow cytometric analysis of IL-10 and IgA expression, gated on the CD45+ population: 1) isotype control (no staining), 2) non-stimulated splenocytes: showing IgA staining, but not IL-10. 3) stimulated splenocytes from Il10-/- mice showing IgA staining, but not IL-10. 4) stimulated splenocytes from WT mice showing IgA and IL-10 staining. s, Flow cytometric analysis of IL-10 and CD19 expression, gated on the CD19+B220+ population. left: stimulated cells from Il10-/- mice, showing B cell staining, but not IL-10; right: stimulated cells from WT mice showing B cell staining and IL-10 staining. t, Flow cytometric analysis of IL-10 and IgA expression, gated on the IgA+ population: left: stimulated cells from Il10-/- mice, showing IgA cell staining, but not IL-10; right: stimulated cells from WT mice showing IgA and IL-10 staining. These results confirm IL-10 production by IgA+ cells. u, Flow cytometric analysis of p-STAT1 staining with corresponding isotype control.
Supplementary material
Acknowledgments
We thank L. Bastian, K. Wang, A. Umemura, M.K. Kim, M. Susani, E. Gurnhofer and F. Grizzi, for discussions and research materials. Antibodies and MACS-beads were gifts from eBioscience, Biolegends and Milteny iBiotec. Anti-PD-L1 and Pdl1/2-/- mice were from Ira Mellman (Genentech). Research was supported by NIH (CA127923 and AI043477), DFG (TR36 to G.W.), the Genome Research-Austria project “Inflammobiota” (FWF and P26011 to L.K.) and postdoctoral research fellowships from the German Research Foundation (DFG, SH721/1-1 to S.S.); Irvington-CRI (to S.S. and Z.Z.); CIRM (TG2-01154 to J.F.-B.) and FIRC/AIRC (to G.D.C.). M.K. is an ACS Research Professor and holds the Ben and Wanda Hildyard Chair for Mitochondrial and Metabolic Diseases.
Footnotes
Contributions: M.K. and S.S. conceived and designed the project. S.S. performed experiments. S.S. and M.K. analyzed data. J.F.B., Z.Z, D.D., M.A., G.W. and A.S. assisted with experiments and analysis. S.S., G.D.C., E.S.L. and D.E.H., performed immunohistochemical analyses of human samples. G.W. performed Tag-specific ELISA. D.E.H, C.J., P.B., C.J.K, T.K., and L.K. collected and provided human specimens. M.K. and S.S. wrote the manuscript, with all authors contributing to writing and providing feedback.
Competing financial interests: The authors declare no competing financial interests.
References
- 1.Chen DS, Mellman I. Oncology meets immunology: the cancer-immunity cycle. Immunity. 2013;39:1–10. doi: 10.1016/j.immuni.2013.07.012. [DOI] [PubMed] [Google Scholar]
- 2.Schietinger A, Greenberg PD. Tolerance and exhaustion: defining mechanisms of T cell dysfunction. Trends Immunol. 2014;35:51–60. doi: 10.1016/j.it.2013.10.001. [DOI] [PMC free article] [PubMed] [Google Scholar]
- 3.Zitvogel L, Galluzzi L, Smyth MJ, Kroemer G. Mechanism of action of conventional and targeted anticancer therapies: reinstating immunosurveillance. Immunity. 2013;39:74–88. doi: 10.1016/j.immuni.2013.06.014. [DOI] [PubMed] [Google Scholar]
- 4.Kroemer G, Galluzzi L, Kepp O, Zitvogel L. Immunogenic cell death in cancer therapy. Annu Rev Immunol. 2013;31:51–72. doi: 10.1146/annurev-immunol-032712-100008. [DOI] [PubMed] [Google Scholar]
- 5.Ammirante M, Luo JL, Grivennikov S, Nedospasov S, Karin M. B-cell-derived lymphotoxin promotes castration-resistant prostate cancer. Nature. 2010;464:302–305. doi: 10.1038/nature08782. [DOI] [PMC free article] [PubMed] [Google Scholar]
- 6.Ammirante M, et al. An IKKalpha-E2F1-BMI1 cascade activated by infiltrating B cells controls prostate regeneration and tumor recurrence. Genes Dev. 2013;27:1435–1440. doi: 10.1101/gad.220202.113. [DOI] [PMC free article] [PubMed] [Google Scholar]
- 7.Lee JL, et al. Gemcitabine-oxaliplatin plus prednisolone is active in patients with castration-resistant prostate cancer for whom docetaxel-based chemotherapy failed. Br J Cancer. 2014;110:2472–2478. doi: 10.1038/bjc.2014.204. [DOI] [PMC free article] [PubMed] [Google Scholar]
- 8.Kaplan-Lefko PJ, et al. Pathobiology of autochthonous prostate cancer in a pre-clinical transgenic mouse model. Prostate. 2003;55:219–237. doi: 10.1002/pros.10215. [DOI] [PubMed] [Google Scholar]
- 9.Watson PA, et al. Context-dependent hormone-refractory progression revealed through characterization of a novel murine prostate cancer cell line. Cancer Res. 2005;65:11565–11571. doi: 10.1158/0008-5472.CAN-05-3441. [DOI] [PubMed] [Google Scholar]
- 10.Ammirante M, Shalapour S, Kang Y, Jamieson CA, Karin M. Tissue injury and hypoxia promote malignant progression of prostate cancer by inducing CXCL13 expression in tumor myofibroblasts. Proc Natl Acad Sci U S A. 2014;111:14776–14781. doi: 10.1073/pnas.1416498111. [DOI] [PMC free article] [PubMed] [Google Scholar]
- 11.Cerutti A. The regulation of IgA class switching. Nat Rev Immunol. 2008;8:421–434. doi: 10.1038/nri2322. [DOI] [PMC free article] [PubMed] [Google Scholar]
- 12.Yoshizaki A, et al. Regulatory B cells control T-cell autoimmunity through IL-21-dependent cognate interactions. Nature. 2012;491:264–268. doi: 10.1038/nature11501. [DOI] [PMC free article] [PubMed] [Google Scholar]
- 13.Affara NI, et al. B cells regulate macrophage phenotype and response to chemotherapy in squamous carcinomas. Cancer Cell. 2014;25:809–821. doi: 10.1016/j.ccr.2014.04.026. [DOI] [PMC free article] [PubMed] [Google Scholar]
- 14.Yu YP, et al. Gene expression alterations in prostate cancer predicting tumor aggression and preceding development of malignancy. J Clin Oncol. 2004;22:2790–2799. doi: 10.1200/JCO.2004.05.158. [DOI] [PubMed] [Google Scholar]
- 15.Luo JL, et al. Nuclear cytokine-activated IKKalpha controls prostate cancer metastasis by repressing Maspin. Nature. 2007;446:690–694. doi: 10.1038/nature05656. [DOI] [PubMed] [Google Scholar]
- 16.Doi T, et al. IgA plasma cells express the negative regulatory co-stimulatory molecule programmed cell death 1 ligand and have a potential tolerogenic role in the intestine. Biochem Biophys Res Commun. 2012;425:918–923. doi: 10.1016/j.bbrc.2012.08.010. [DOI] [PubMed] [Google Scholar]
- 17.Foster BA, Gingrich JR, Kwon ED, Madias C, Greenberg NM. Characterization of prostatic epithelial cell lines derived from transgenic adenocarcinoma of the mouse prostate (TRAMP) model. Cancer Res. 1997;57:3325–3330. [PubMed] [Google Scholar]
- 18.Hogquist KA, et al. T cell receptor antagonist peptides induce positive selection. Cell. 1994;76:17–27. doi: 10.1016/0092-8674(94)90169-4. [DOI] [PubMed] [Google Scholar]
- 19.Xiao S, et al. Defect in regulatory B-cell function and development of systemic autoimmunity in T-cell Ig mucin 1 (Tim-1) mucin domain-mutant mice. Proc Natl Acad Sci U S A. 2012;109:12105–12110. doi: 10.1073/pnas.1120914109. [DOI] [PMC free article] [PubMed] [Google Scholar]
- 20.Kang HS, et al. Signaling via LTbetaR on the lamina propria stromal cells of the gut is required for IgA production. Nat Immunol. 2002;3:576–582. doi: 10.1038/ni795. [DOI] [PubMed] [Google Scholar]
- 21.Feng T, Elson CO, Cong Y. Treg cell-IgA axis in maintenance of host immune homeostasis with microbiota. Int Immunopharmacol. 2011;11:589–592. doi: 10.1016/j.intimp.2010.11.016. [DOI] [PMC free article] [PubMed] [Google Scholar]
- 22.Shen P, et al. IL-35-producing B cells are critical regulators of immunity during autoimmune and infectious diseases. Nature. 2014;507:366–370. doi: 10.1038/nature12979. [DOI] [PMC free article] [PubMed] [Google Scholar]
- 23.Pardoll DM. The blockade of immune checkpoints in cancer immunotherapy. Nat Rev Cancer. 2012;12:252–264. doi: 10.1038/nrc3239. [DOI] [PMC free article] [PubMed] [Google Scholar]
- 24.Qin Z, et al. B cells inhibit induction of T cell-dependent tumor immunity. Nat Med. 1998;4:627–630. doi: 10.1038/nm0598-627. [DOI] [PubMed] [Google Scholar]
- 25.Olkhanud PB, et al. Tumor-evoked regulatory B cells promote breast cancer metastasis by converting resting CD4(+) T cells to T-regulatory cells. Cancer Res. 2011;71:3505–3515. doi: 10.1158/0008-5472.CAN-10-4316. [DOI] [PMC free article] [PubMed] [Google Scholar]
- 26.Fremd C, Schuetz F, Sohn C, Beckhove P, Domschke C. B cell-regulated immune responses in tumor models and cancer patients. Oncoimmunology. 2013;2:e25443. doi: 10.4161/onci.25443. [DOI] [PMC free article] [PubMed] [Google Scholar]
- 27.Shah N. Diagnostic significance of levels of immunoglobulin A in seminal fluid of patients with prostatic disease. Urology. 1976;8:270–272. doi: 10.1016/0090-4295(76)90384-8. [DOI] [PubMed] [Google Scholar]
- 28.Schumacher TN, Kesmir C, van Buuren MM. Biomarkers in cancer immunotherapy. Cancer Cell. 2015;27:12–14. doi: 10.1016/j.ccell.2014.12.004. [DOI] [PubMed] [Google Scholar]
- 29.Shen FW, et al. Cloning of Ly-5 cDNA. Proc Natl Acad Sci U S A. 1985;82:7360–7363. doi: 10.1073/pnas.82.21.7360. [DOI] [PMC free article] [PubMed] [Google Scholar]
- 30.Gingrich JR, et al. Metastatic prostate cancer in a transgenic mouse. Cancer Res. 1996;56:4096–4102. [PubMed] [Google Scholar]
- 31.Chen J, et al. Immunoglobulin gene rearrangement in B cell deficient mice generated by targeted deletion of the JH locus. Int Immunol. 1993;5:647–656. doi: 10.1093/intimm/5.6.647. [DOI] [PubMed] [Google Scholar]
- 32.Koh DR, et al. Less mortality but more relapses in experimental allergic encephalomyelitis in CD8-/- mice. Science. 1992;256:1210–1213. doi: 10.1126/science.256.5060.1210. [DOI] [PubMed] [Google Scholar]
- 33.Mombaerts P, et al. RAG-1-deficient mice have no mature B and T lymphocytes. Cell. 1992;68:869–877. doi: 10.1016/0092-8674(92)90030-g. [DOI] [PubMed] [Google Scholar]
- 34.Forrester E, et al. Effect of conditional knockout of the type II TGF-beta receptor gene in mammary epithelia on mammary gland development and polyomavirus middle T antigen induced tumor formation and metastasis. Cancer Res. 2005;65:2296–2302. doi: 10.1158/0008-5472.CAN-04-3272. [DOI] [PubMed] [Google Scholar]
- 35.Harriman GR, et al. Targeted deletion of the IgA constant region in mice leads to IgA deficiency with alterations in expression of other Ig isotypes. J Immunol. 1999;162:2521–2529. [PubMed] [Google Scholar]
- 36.Porichis F, et al. High-throughput detection of miRNAs and gene-specific mRNA at the single-cell level by flow cytometry. Nat Commun. 2014;5 doi: 10.1038/ncomms6641. [DOI] [PMC free article] [PubMed] [Google Scholar]
- 37.Michaud M, et al. Autophagy-dependent anticancer immune responses induced by chemotherapeutic agents in mice. Science. 2011;334:1573–1577. doi: 10.1126/science.1208347. [DOI] [PubMed] [Google Scholar]
- 38.Keren Z, et al. B-cell depletion reactivates B lymphopoiesis in the BM and rejuvenates the B lineage in aging. Blood. 2011;117:3104–3112. doi: 10.1182/blood-2010-09-307983. [DOI] [PubMed] [Google Scholar]
- 39.Holzbeierlein J, et al. Gene expression analysis of human prostate carcinoma during hormonal therapy identifies androgen-responsive genes and mechanisms of therapy resistance. Am J Pathol. 2004;164:217–227. doi: 10.1016/S0002-9440(10)63112-4. [DOI] [PMC free article] [PubMed] [Google Scholar]
- 40.LaTulippe E, et al. Comprehensive gene expression analysis of prostate cancer reveals distinct transcriptional programs associated with metastatic disease. Cancer Res. 2002;62:4499–4506. [PubMed] [Google Scholar]
- 41.Singh D, et al. Gene expression correlates of clinical prostate cancer behavior. Cancer Cell. 2002;1:203–209. doi: 10.1016/s1535-6108(02)00030-2. [DOI] [PubMed] [Google Scholar]
- 42.Arredouani MS, et al. Identification of the transcription factor single-minded homologue 2 as a potential biomarker and immunotherapy target in prostate cancer. Clin Cancer Res. 2009;15:5794–5802. doi: 10.1158/1078-0432.CCR-09-0911. [DOI] [PMC free article] [PubMed] [Google Scholar]
- 43.Liu P, et al. Sex-determining region Y box 4 is a transforming oncogene in human prostate cancer cells. Cancer Res. 2006;66:4011–4019. doi: 10.1158/0008-5472.CAN-05-3055. [DOI] [PubMed] [Google Scholar]
- 44.Grasso CS, et al. The mutational landscape of lethal castration-resistant prostate cancer. Nature. 2012;487:239–243. doi: 10.1038/nature11125. [DOI] [PMC free article] [PubMed] [Google Scholar]
- 45.Lapointe J, et al. Gene expression profiling identifies clinically relevant subtypes of prostate cancer. Proc Natl Acad Sci U S A. 2004;101:811–816. doi: 10.1073/pnas.0304146101. [DOI] [PMC free article] [PubMed] [Google Scholar]
- 46.Tomlins SA, et al. Integrative molecular concept modeling of prostate cancer progression. Nat Genet. 2007;39:41–51. doi: 10.1038/ng1935. [DOI] [PubMed] [Google Scholar]
- 47.Welsh JB, et al. Analysis of gene expression identifies candidate markers and pharmacological targets in prostate cancer. Cancer Res. 2001;61:5974–5978. [PubMed] [Google Scholar]
- 48.Varambally S, et al. Integrative genomic and proteomic analysis of prostate cancer reveals signatures of metastatic progression. Cancer Cell. 2005;8:393–406. doi: 10.1016/j.ccr.2005.10.001. [DOI] [PubMed] [Google Scholar]
- 49.Magee JA, et al. Expression profiling reveals hepsin overexpression in prostate cancer. Cancer Res. 2001;61:5692–5696. [PubMed] [Google Scholar]
- 50.Wallace TA, et al. Tumor immunobiological differences in prostate cancer between African-American and European-American men. Cancer Res. 2008;68:927–936. doi: 10.1158/0008-5472.CAN-07-2608. [DOI] [PubMed] [Google Scholar]
- 51.Vanaja DK, Cheville JC, Iturria SJ, Young CY. Transcriptional silencing of zinc finger protein 185 identified by expression profiling is associated with prostate cancer progression. Cancer Res. 2003;63:3877–3882. [PubMed] [Google Scholar]
- 52.Luo JH, et al. Gene expression analysis of prostate cancers. Mol Carcinog. 2002;33:25–35. doi: 10.1002/mc.10018. [DOI] [PubMed] [Google Scholar]
- 53.Rhodes DR, et al. ONCOMINE: a cancer microarray database and integrated data-mining platform. Neoplasia. 2004;6:1–6. doi: 10.1016/s1476-5586(04)80047-2. [DOI] [PMC free article] [PubMed] [Google Scholar]
- 54.Di Caro G, et al. Occurrence of tertiary lymphoid tissue is associated with T-cell infiltration and predicts better prognosis in early-stage colorectal cancers. Clin Cancer Res. 2014;20:2147–2158. doi: 10.1158/1078-0432.CCR-13-2590. [DOI] [PubMed] [Google Scholar]
- 55.Woo JR, et al. Tumor infiltrating B-cells are increased in prostate cancer tissue. J Transl Med. 2014;12:30. doi: 10.1186/1479-5876-12-30. [DOI] [PMC free article] [PubMed] [Google Scholar]
- 56.D'Amico AV, et al. Biochemical outcome after radical prostatectomy, external beam radiation therapy, or interstitial radiation therapy for clinically localized prostate cancer. JAMA. 1998;280:969–974. doi: 10.1001/jama.280.11.969. [DOI] [PubMed] [Google Scholar]
- 57.Czeh M, et al. The immune response to sporadic colorectal cancer in a novel mouse model. Oncogene. 2010;29:6591–6602. doi: 10.1038/onc.2010.388. [DOI] [PubMed] [Google Scholar]
Associated Data
This section collects any data citations, data availability statements, or supplementary materials included in this article.


