

Abstract
Introduction
The immunosuppressive enzyme, indoleamine 2,3 dioxygenase (IDO), is overexpressed in many different tumor types including breast cancer. IDO inhibitors synergize with chemotherapy in breast cancer murine models. Characterizing IDO expression in breast cancer could define which patients receive IDO inhibitors. This study analyzed IDO protein expression in 203 breast cancer cases. The relationship between IDO, overall survival (OS), disease-specific survival (DSS), clinicopathologic, molecular, and immune tumor infiltrate factors was evaluated.
Methods
Expression of IDO, estrogen receptor (ER), progesterone receptor (PR), human epithelial receptor 2, cytokeratin 5/6, epithelial growth factor receptor, phosphorylated AKT, neoangiogenesis, nitrogen oxide synthetase 2 (NOS2), cyclooxygenase 2 (COX2), FoxP3, CD8, and CD11b on archival breast cancer tissue sections was evaluated by immunohistochemistry. Associations between IDO and these markers were explored by a univariate and multivariate analysis. Survival was analyzed using Kaplan–Meier (OS) and Wilcoxon two-sample (DSS) tests.
Results
IDO expression was higher in ER+ tumors compared to ER− tumors. IDO was lower in those with higher neoangiogenesis. OS was better in ER+ patients with high IDO expression. DSS was better in node-positive patients with high IDO expression. IDO activity positively correlates with NOS2. COX2 as positively correlated with IDO on univariate but not multivariate analysis. There was a trend toward greater numbers of CD11b+ cells in IDO-low tumors.
Conclusions
IDO protein expression is lower in ER- breast tumors with greater neoangiogenesis. Future clinical trials evaluating the synergy between IDO inhibitors and chemotherapy should take this finding into account and stratify for ER status in the trial design.
Keywords: Indoleamine 2, 3 dioxygenase, Breast cancer, Immunotherapy, Immunohistochemistry
Introduction
The inducible enzyme known as indoleamine 2,3 dioxygenase (IDO or IDO1) and a splice variant of IDO known as IDO2 participate in the catabolism of tryptophan that generates various biologically active and immunosuppressive metabolites such as kynurenine [1]. The role of IDO in immunosuppression was revealed by Munn et al. [2] who showed that IDO can prevent immune rejection and spontaneous abortion of allogeneic concepti. The finding sparked a great deal of ongoing research into the role of IDO in autoimmunity, graft rejection, and tumor-mediated immunosuppression [3–5]. Many different tumor types overexpress IDO in response to cytokines such as interferon-γ, and the subsequent breakdown of tryptophan into various metabolites such as kynurenine causes tumor-infiltrating lymphocytes to become anergic and die [6–10]. Studies looking at IDO expression in ovarian, endometrial, and colorectal cancer have shown that high IDO expression is correlated with poorer outcomes [11–13]. In colorectal cancer, there was no survival difference seen, but high IDO-expressing tumors were more likely to metastasize to the liver. There is evidence that combining IDO inhibitors can synergize with various chemotherapeutic agents in a MMTV-neu murine model [14]. Chemotherapy agents such as taxanes induce an influx of tumor-infiltrating lymphocytes (TILs) in breast tumors. Using an IDO inhibitor in combination with a taxane may augment the ability of the TILs to kill tumor cells and improve clinical response. This approach is currently the subject of a phase I clinical trial in metastatic solid tumors, so understanding which breast cancers overexpress IDO is particularly relevant.
A recently published study analyzing IDO expression in 26 breast cancer cases correlated higher IDO expression with a lymph node involvement and a non-significant trend toward worse recurrence-free survival [15]. Interestingly, another recent study published by Jaquemiere et al. [16] demonstrated elevated INDO mRNA transcript levels and IDO protein in a subset of triple-negative basal breast cancers. This was particularly evident in the medullary subtype. In addition, increased IDO was associated with a favorable prognosis and lack of nodal involvement in their dataset. Due to these conflicting results, we sought to investigate whether we could confirm any of the prior clinicopathologic associations with IDO expression. We also wanted to explore any relationships between IDO expression and other molecular factors including ER, PR, epithelial receptor 2 (HER2), basal breast cancer markers (CK5/6 and EGFR), phosphorylation of AKT (pAKT473), caspase 9 activity, and neoangiogenesis (CD31). Finally, the impact of IDO expression on FoxP3+ (T-regulatory cells), CD11b+ (macrophages, granulocytes, natural killer cells), CD8+ (Th1 cytotoxic T cells) immune cell tumor infiltrates, cyclooxygenase-2 (COX2), and nitrogen oxide synthetase (NOS2) was evaluated.
Materials and methods
Collection of tumor specimens and survival information
For this retrospective analysis, paraffin-embedded tumor specimens were obtained from 203 breast cancer patients that resided in the greater Baltimore area, as described [17]. Patients were recruited at the University of Maryland Medical Center (UMD), the Baltimore Veterans Affairs Medical Center, Union Memorial Hospital, Mercy Medical Center, and the Sinai Hospital in Baltimore between 1993 and 2003 as part of a molecular epidemiology study that examines markers for cancer risk and disease outcome in breast cancer [18]. All patients were identified through surgery lists and enrolled into the study prior to surgery. They signed a consent form for the unspecified use of biospecimens and survey data in research studies of breast cancer and completed an interviewer–administered questionnaire. Cases were eligible if they resided in the greater Baltimore area at the time of recruitment, were of African American or Caucasian descent by self-report, had pathologically confirmed breast cancer, were diagnosed with breast cancer within the last 6 months prior to recruitment, and had no previous history of breast cancer. Patients were excluded if they were HIV, HCV, or HBV carriers, were IV-drug users, were institutionalized, or were physically or mentally unable to sign consent and complete the questionnaire. Clinical and pathological information was obtained from medical records and pathology reports. Disease staging was performed according to the tumor–node–metastasis (TNM) system of the American Joint Committee on Cancer/the Union Internationale Contre le Cancer (AJCC/UICC). The Nottingham system was used to determine the tumor grade. Survival was determined for the period from the date of hospital admission to the date of the last completed search for death entries in the Social Security Index (date of search: December 31st, 2006) for the 203 patients. The mean and median follow-up times for breast cancer survival were 71 and 68 months, respectively (range: 12–166 months). We obtained information (National Death Index, death certificates) on the causes of death for the deceased patients and censored all patients whose causes of death, such as accidents, were not related to breast cancer (n = 11). The collection of tumor specimens, survey data, and clinical and pathological information, and follow-up data was reviewed and approved by the University of Maryland Institutional Review Board for the participating institutions (UMD protocol #0298229). IRB approval of this protocol was then obtained at all institutions (Veterans Affairs Medical Center, Union Memorial Hospital, Mercy Medical Center, and Sinai Hospital). The research was also reviewed and approved by the NIH Office of Human Subjects Research (OHSR #2248) and University of South Florida IRB (MCC16015).
Immunohistochemical staining and scoring of IDO
Slides were stained using a Ventana Discovery XT automated system (Ventana Medical Systems, Tucson) as per manufacturer’s protocol with proprietary reagents. Briefly, slides were deparaffinized on the automated system with EZ Prep solution (Ventana). Enzymatic retrieval method was used in protease 1 at 4 min (Ventana). The mouse primary antibody that reacts to IDO1 (#mab5412, Millipore, Temecula, CA, USA) was used at a 1:50 concentration in Dako antibody diluent (Carpenteria, CA, USA) and incubated for 60 min. The Ventana anti-mouse secondary antibody was used for 16 min. IDO labeling was visualized using the Ventana OmniMap kit and slides were then counterstained with hematoxylin. Slides were then dehydrated and coverslipped as per normal laboratory protocol. The slides were scored numerically by two pathologists on intensity of IDO cytoplasmic staining (0, 1, 2, 3) and percent cells staining positive (0 = 0 %, 1 = 1–33 %, 2 = 34–66 %, 3 ≥ 66 %). The slides also underwent computer image analysis for IDO staining as an additional quality assurance measure (Analytic Microscopy Core, Moffitt Cancer Center). Differences in scores were adjudicated between the two pathologists to arrive at a final score. The product of the two values would result in a composite IDO score, and the scores were stratified as low = 0–2, intermediate = 3 and 4, and high = 6 and 9. For all statistical and survival analyses, the samples were grouped into either IDO-low (0–2) or IDO-medium/high (3, 4, 6, 9) groups.
Immunohistochemical staining and evaluation for all other markers including COX2, NOS2, and tumor immune infiltrates
The staining and quantification method for the various proteins analyzed in this dataset including ER, PR, HER2, AKT, COX2, EGFR, CK5/6, and NOS2 was previously published [17, 19]. Immune infiltrates were characterized utilizing Ab-3 antibody (Lab Vision Corp.) for CD68 at 1:250; (no. 2729-1; Epitomics) for CD11b at 1:1,000; for FoxP3 1:1,500 diluted rabbit polyclonal antibody (Abcam); CD8 1:100 mouse monoclonal antibody (Thermo Fisher scientific). Immunostaining was detected with Dako Envision System kits after standard deparaffinization and citrate buffer antigen retrieval. Counterstaining with methyl green was used for all markers with the exception of CD11b+ (hematoxylin and Tacha’s bluing solution). The cell counts analyzed were an average of three high-powered fields.
Statistical analysis
Descriptive statistics for patient and tumor characteristics were presented overall and by IDO scores (low vs. medium/high). Comparisons between IDO scores and patient and tumor characteristics were made using the exact Wilcoxon Rank Sum test for continuous characteristics, and the exact Pearson Chi-squared test for categorical characteristics, both using Monte Carlo estimation. The logistic regression model was used to assess univariate association between IDO scores (medium/high vs. low) and patients or tumor characteristics. The variables that were significantly associated with IDO scores in univariate analysis were then simultaneously put in multivariate logistic regression model to assess the association while adjusting for other significantly associated variables. No adjustment for multiple testing was performed in this exploratory analysis. Overall survival (OS) was examined using Kaplan–Meier survival curves with log-rank test. All p values are two-sided and considered statistically significant at the 0.05 level. All statistical analyses were performed using SAS (version 9.3; SAS Institute; Cary, NC, USA).
Results
Demographics, pathologic factors, and treatment information
The patient demographics and characteristics are summarized in Table 1. The overall median age was 54 (range 29–93), and all participants were female. Approximately 61 % were African American in keeping with the catchment area served by the participating hospitals involved. The stage distribution was typical with 7.3, 21.3, 56.7, 20.2, and 1.7 % presenting with Stage 0, I, II, III, and IV, respectively. The frequency of ER-positive disease was 61.6 and 55.2 % of the patients in the study received adjuvant chemotherapy. In the analysis of categorical variables, it appears that smaller, node-negative breast cancers had higher IDO expression compared to more advanced stages. Tumors with higher p-caspase 9, EGFR, NOS2, and COX2 expression also had higher IDO levels. The data regarding EGFR are less robust due to a large number of missing EGFR scores for this dataset. Finally, an inverse relationship was noted between CD31 and IDO expression.
Table 1.
Patients and tumor characteristics by low and medium/high IDO scores
| Variable | Level | N (%) | p value (1) | ||
|---|---|---|---|---|---|
| Total | Low IDO scores | Medium/high IDO scores | |||
| Race | African American | 124 (61.1 %) | 70 (56.5 %) | 54 (43.5 %) | 0.2550 |
| European American | 79 (38.9 %) | 38 (48.1 %) | 41 (51.9 %) | ||
| Total | 203 (100 %) | 108 (53.2 %) | 95 (46.8 %) | ||
| BMI | 24.9 or < | 55 (28.6 %) | 33 (60 %) | 22 (40 %) | 0.4645 |
| 25–29.9 | 56 (29.2 %) | 27 (48.2 %) | 29 (51.8 %) | ||
| 30 or > | 81 (42.2 %) | 44 (54.3 %) | 37 (45.7 %) | ||
| Total | 192 (100 %) | 104 (54.2 %) | 88 (45.8 %) | ||
| Tumor size | TIS/1/2 | 146 (76.4 %) | 73 (50 %) | 73 (50 %) | 0.0407 |
| 3/4 | 45 (23.6 %) | 31 (68.9 %) | 14 (31.1 %) | ||
| Total | 191 (100 %) | 104 (54.5 %) | 87 (45.5 %) | ||
| Node | Negative | 118 (60.8 %) | 57 (48.3 %) | 61 (51.7 %) | 0.0383 |
| Positive | 76 (39.2 %) | 49 (64.5 %) | 27 (35.5 %) | ||
| Total | 194 (100 %) | 106 (54.6 %) | 88 (45.4 %) | ||
| Stage | 0 | 14 (7.3 %) | 6 (42.9 %) | 8 (57.1 %) | 0.0002 |
| I | 38 (19.8 %) | 9 (23.7 %) | 29 (76.3 %) | ||
| IIA/IIB | 101 (52.6 %) | 63 (62.4 %) | 38 (37.6 %) | ||
| III/IIIA/IIIB/IIIC | 36 (18.8 %) | 26 (72.2 %) | 10 (27.8 %) | ||
| IV | 3 (1.6 %) | 1 (33.3 %) | 2 (66.7 %) | ||
| Total | 192 (100 %) | 105 (54.7 %) | 87 (45.3 %) | ||
| Tumor grade | 1 | 27 (14.7 %) | 13 (48.1 %) | 14 (51.9 %) | 0.2032 |
| 2 | 65 (35.3 %) | 33 (50.8 %) | 32 (49.2 %) | ||
| 3 | 92 (50 %) | 58 (63 %) | 34 (37 %) | ||
| Total | 184 (100 %) | 104 (56.5 %) | 80 (43.5 %) | ||
| Estrogen receptor | Negative | 78 (38.4 %) | 51 (65.4 %) | 27 (34.6 %) | 0.0059 |
| Positive | 125 (61.6 %) | 57 (45.6 %) | 68 (54.4 %) | ||
| Total | 203 (100 %) | 108 (53.2 %) | 95 (46.8 %) | ||
| Progesterone receptor | Negative | 93 (52.2 %) | 53 (57 %) | 40 (43 %) | 0.3747 |
| Positive | 85 (47.8 %) | 42 (49.4 %) | 43 (50.6 %) | ||
| Total | 178 (100 %) | 95 (53.4 %) | 83 (46.6 %) | ||
| HER2–neu receptor | Negative | 56 (49.1 %) | 33 (58.9 %) | 23 (41.1 %) | 0.8480 |
| Positive | 58 (50.9 %) | 33 (56.9 %) | 25 (43.1 %) | ||
| Total | 114 (100 %) | 66 (57.9 %) | 48 (42.1 %) | ||
| Menopause | Negative | 55 (32.4 %) | 34 (61.8 %) | 21 (38.2 %) | 0.1919 |
| Positive | 115 (67.6 %) | 58 (50.4 %) | 57 (49.6 %) | ||
| Total | 170 (100 %) | 92 (54.1 %) | 78 (45.9 %) | ||
| p53 nuclear IHC | Negative | 141 (69.5 %) | 69 (48.9 %) | 72 (51.1 %) | 0.0707 |
| Positive | 62 (30.5 %) | 39 (62.9 %) | 23 (37.1 %) | ||
| Total | 203 (100 %) | 108 (53.2 %) | 95 (46.8 %) | ||
| p53 mutation status | Negative | 166 (81.8 %) | 86 (51.8 %) | 80 (48.2 %) | 0.4655 |
| Positive | 37 (18.2 %) | 22 (59.5 %) | 15 (40.5 %) | ||
| Total | 203 (100 %) | 108 (53.2 %) | 95 (46.8 %) | ||
| EGFR | 1 | 11 (15.7 %) | 9 (81.8 %) | 2 (18.2 %) | 0.0003 |
| 2 | 20 (28.6 %) | 17 (85 %) | 3 (15 %) | ||
| 3 | 17 (24.3 %) | 14 (82.4 %) | 3 (17.6 %) | ||
| 4 | 22 (31.4 %) | 7 (31.8 %) | 15 (68.2 %) | ||
| Total | 70 (100 %) | 47 (67.1 %) | 23 (32.9 %) | ||
| EGFR | 1/2 | 31 (44.3 %) | 26 (83.9 %) | 5 (16.1 %) | 0.0099 |
| 3/4 | 39 (55.7 %) | 21 (53.8 %) | 18 (46.2 %) | ||
| Total | 70 (100 %) | 47 (67.1 %) | 23 (32.9 %) | ||
| CK 5/6 | 1/2 | 52 (74.3 %) | 34 (65.4 %) | 18 (34.6 %) | 0.3923 |
| 3/4 | 18 (25.7 %) | 14 (77.8 %) | 4 (22.2 %) | ||
| Total | 70 (100 %) | 48 (68.6 %) | 22 (31.4 %) | ||
| CD31 | ≤39.5 | 115 (56.7 %) | 51 (44.3 %) | 64 (55.7 %) | 0.0053 |
| >39.5 | 88 (43.3 %) | 57 (64.8 %) | 31 (35.2 %) | ||
| Total | 203 (100 %) | 108 (53.2 %) | 95 (46.8 %) | ||
| pAKT473 | 1/2 | 35 (17.2 %) | 23 (65.7 %) | 12 (34.3 %) | 0.1307 |
| 3/4 | 168 (82.8 %) | 85 (50.6 %) | 83 (49.4 %) | ||
| Total | 203 (100 %) | 108 (53.2 %) | 95 (46.8 %) | ||
| p-caspase 9 | 1/2/3 | 113 (55.7 %) | 68 (60.2 %) | 45 (39.8 %) | 0.0348 |
| 4 | 90 (44.3 %) | 40 (44.4 %) | 50 (55.6 %) | ||
| Total | 203 (100 %) | 108 (53.2 %) | 95 (46.8 %) | ||
| NOS2 | 1/2/3 | 115 (56.7 %) | 71 (61.7 %) | 44 (38.3 %) | 0.0083 |
| 4 | 88 (43.3 %) | 37 (42 %) | 51 (58 %) | ||
| Total | 203 (100 %) | 108 (53.2 %) | 95 (46.8 %) | ||
| COX2 | 1/2 | 128 (63.1 %) | 77 (60.2 %) | 51 (39.8 %) | 0.0134 |
| 3/4 | 75 (36.9 %) | 31 (41.3 %) | 44 (58.7 %) | ||
| Total | 203 (100 %) | 108 (53.2 %) | 95 (46.8 %) | ||
| Cyclin E nuclear | Negative | 98 (49.2 %) | 50 (51 %) | 48 (49 %) | 0.4801 |
| Positive | 101 (50.8 %) | 57 (56.4 %) | 44 (43.6 %) | ||
| Total | 199 (100 %) | 107 (53.8 %) | 92 (46.2 %) | ||
Bold values indicate statistical significance p < 0.05
Survival analysis
Overall survival (OS) was compared between the IDO-low and IDO-medium/high groups. There was no statistically significant difference between the two groups across all patients in the sample (5-year OS 78 vs. 67 %, p = 0.248) (Fig. 1). However, subset analysis revealed that within the ER-positive subgroup, patients with medium/high IDO expression had a superior OS compared to IDO low (5-year OS 86 vs. 65 %, p = 0.0215) (Fig. 2). Disease-specific survival (DSS) trended toward superiority in IDO medium/high versus IDO low (mean DSS 35.5 vs. 27.1 months, p = 0.068). In addition, DSS within the node-positive group was superior for IDO-medium/high compared to IDO-low tumors (mean DSS 23.5 vs. 15.4 months, p = 0.03). There were no other survival differences observed within other clinical subsets between IDO-low versus IDO-medium/high groups.
Fig. 1.

Overall survival (OS) stratified by two groups of IDO scores
Fig. 2.

OS stratified by two groups of IDO scores within ER-positive group
IDO staining results
None of the breast cancer specimens were completely negative for IDO staining. The mean value was 2.5, median and mode equaled 2, and range was 1–9. Out of 203 samples, 108 (53.2 %), 84 (41.4 %), and 11 (5.4 %) had a low, medium, and high IDO score, respectively. The staining was cytoplasmic as was expected and was mainly confined to the malignant ductal cells and mostly undetectable in the adjacent stromal cells (Fig. 3). However, there were occasional mononuclear cells that stained positive for IDO infiltrating the surrounding tumor stroma. The distribution of IDO scores across the study population is shown in a histogram (Fig. 4). Interobserver concordance between the two pathologists and computer-aided image analysis for IDO score stratification was >90 % demonstrating reproducibility of the IHC analysis.
Fig. 3.
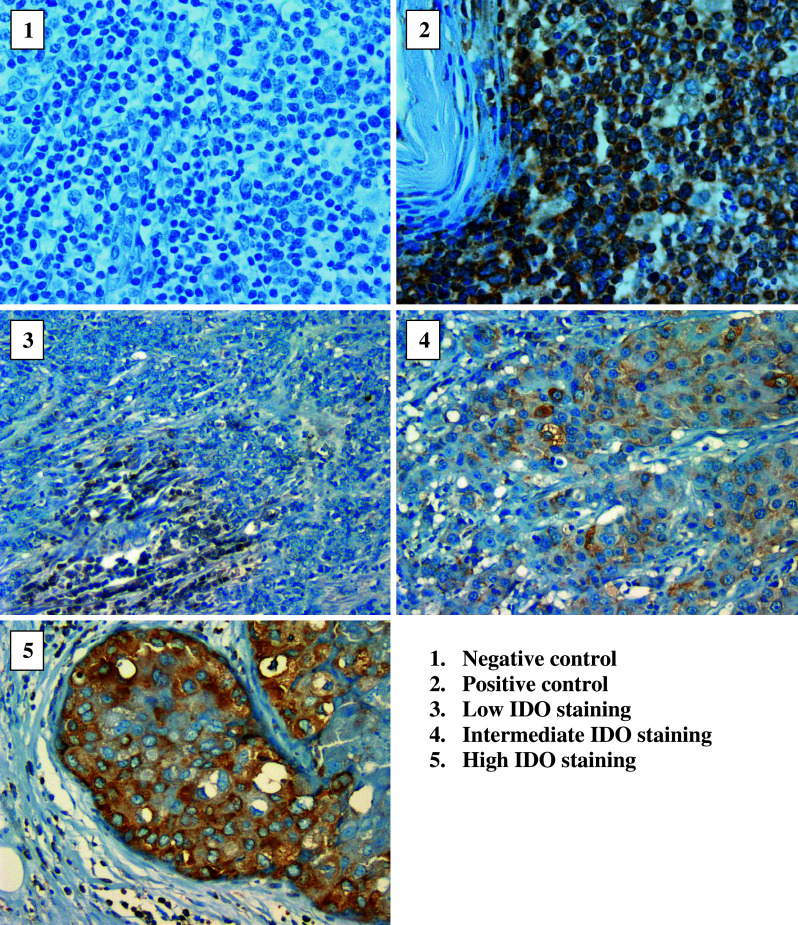
IDO-immunostaining photographs
Fig. 4.

Distributional histogram of IDO scores. This figure shows the distribution of IDO scores as a percentage of the total (N = 203) for the samples studied. The black portion of the bar reflects the proportion of samples that received their score based on stain intensity (i.e. 2 × 1) while the white portion is the proportion of samples that received their score based on % cells staining positive (i.e. 1 × 2)
Univariate and multivariate analysis
Table 2 summarizes the various demographic, clinical, and pathologic factors that were included in the univariate statistical analysis to explore their relationship with IDO expression. We did not observe a relationship between IDO expression and clinical factors such as race, age, menopausal status, and body mass index. Larger tumors (OR = 0.45, 0.22–0.92, p = 0.028) and node-positive tumors (OR = 0.51, 0.28–0.93, p = 0.028) were associated with lower IDO expression. We did not find an association between IDO and the tumor PR or HER2 status. Estrogen-receptor-positive tumors were associated with higher IDO expression compared to estrogen-receptor-negative tumors (OR = 2.25, 1.26–4.04, p = 0.006). Univariate analysis for high IDO expression between breast tumor types demonstrated triple-negative tumors with an OR = 0.29 (0.08–1.08, p = 0.06) and HER2+ with an OR = 0.76 (0.33–1.72, p = 0.51) compared to ER+/HER2− tumors. Tumors with greater microvessel density and neoangiogenesis (CD31) were significantly associated with low IDO expression (OR = 0.4, 0.18–0.80, p = 0.012). Elevated levels of p-caspase 9 were associated on univariate analysis with greater IDO expression (OR = 1.9, 1.08–3.31, p = 0.026). A greater proportions of IDO-medium/high tumors expressed higher levels of both NOS (OR = 2.2, 1.26–3.92, p = 0.006) and COX2 (OR = 2.14, 1.2–3.83, p = 0.01) compared to low IDO-expressing tumors in the univariate analysis. In the multivariate analysis (Table 3), high IDO expression was associated with ER positivity (OR = 2.49, 1.24–5, p = 0.01), low CD31 expression (OR = 0.31, 0.15–0.63, p = 0.001), and high NOS2 levels (OR 2.61, 1.26–5.37, p = 0.0095).
Table 2.
Univariate logistic regression for IDO scores—low versus medium/high
| Variable | Reference | Level | OR (95 % CI) | p value(1) | p value(2) |
|---|---|---|---|---|---|
| Race | African American | European American | 1.4 (0.79–2.46) | 0.2457 | 0.2457 |
| Age | 1 (1–1.01) | 0.5543 | |||
| BMI | 24.9 or < | 25–29.9 | 1.61 (0.76–3.42) | 0.2140 | 0.4615 |
| 24.9 or < | 30 or > | 1.26 (0.63–2.53) | 0.5122 | ||
| Age | 1 (0.98–1.02) | 0.8812 | |||
| Metastasis | Negative | Positive | 2.37 (0.21–26.56) | 0.4847 | 0.4847 |
| Tumor size | TIS/1/2 | 3/4 | 0.45 (0.22–0.92) | 0.0282 | 0.0282 |
| Node | 0 | 1+ | 0.51 (0.28–0.93) | 0.0281 | 0.0281 |
| Tumor grade | 1 | 2 | 0.9 (0.37–2.21) | 0.8189 | 0.2003 |
| 1 | 3 | 0.54 (0.23–1.29) | 0.1684 | ||
| Estrogen receptor | Negative | Positive | 2.25 (1.26–4.04) | 0.0064 | 0.0064 |
| Progesterone receptor | Negative | Positive | 1.36 (0.75–2.45) | 0.3119 | 0.3119 |
| HER2–neu receptor | Negative | Positive | 1.09 (0.52–2.29) | 0.8262 | 0.8262 |
| p53 mutation status | Negative | Positive | 0.73 (0.36–1.51) | 0.4000 | 0.4000 |
| EGFR | 1 | 2 | 0.79 (0.11–5.66) | 0.8180 | 0.0013 |
| 1 | 3 | 0.96 (0.13–6.95) | 0.9712 | ||
| 1 | 4 | 9.64 (1.63–56.92) | 0.0124 | ||
| EGFR | 1/2 | 3/4 | 4.46 (1.42–14.01) | 0.0106 | 0.0106 |
| CK 5/6 | 1/2 | 3/4 | 0.54 (0.15–1.88) | 0.3333 | 0.3333 |
| CD31 | ≤39.5 | >39.5 | 0.43 (0.24–0.77) | 0.0041 | 0.0041 |
| pAKT473 | 1/2 | 3/4 | 1.87 (0.87–4) | 0.1063 | 0.1063 |
| p-caspase 9 | 1/2/3 | 4 | 1.89 (1.08–3.31) | 0.0263 | 0.0263 |
| NOS2 | 1/2/3 | 4 | 2.22 (1.26–3.92) | 0.0057 | 0.0057 |
| COX2 | 1/2 | 3/4 | 2.14 (1.2–3.83) | 0.0100 | 0.0100 |
(1) Specific-level p value, (2) overall variable p value
Bold values indicate statistical significance p < 0.05
Table 3.
Multivariable logistic regression for IDO scores—low (reference) versus medium/high
| Effect | OR (95 % CI) | p value |
|---|---|---|
| Tumor size – 3/4 versus TIS/1/2 | 0.46 (0.2–1.03) | 0.0593 |
| Node – positive versus negative | 0.58 (0.29–1.15) | 0.1171 |
| ER – positive versus negative | 2.49 (1.24–5) | 0.0100 |
| CD31 – >39.5 versus ≤39.5 | 0.31 (0.15–0.63) | 0.0011 |
| p-caspase 9 – 4 versus 1/2/3 | 1.81 (0.88–3.69) | 0.1044 |
| NOS2 – 4 versus 1/2/3 | 2.61 (1.26–5.37) | 0.0095 |
| COX2 – 3/4 versus 1/2 | 1.62 (0.77–3.42) | 0.2077 |
Bold values indicate statistical significance p < 0.05
Tumor immune infiltrates
The FoxP3+ T-regulatory average cell counts/high-powered field (HPF) were identical between the IDO-low (17.9, 95 % CI 10.7–25) versus IDO-medium/high (17.1, 95 % CI 10.5–23.6) groups (p = 0.90). There was a greater average CD8+ T cells/HPF in the IDO-low (99, 95 % CI 55–143) versus IDO-medium/high (77.2, 95 % CI 48.7–105.6) groups, but this was not statistically significant (p = 0.43). A marginally significant trend was seen in the average CD11b+ macrophages/HPF in the IDO-low (18.1, 95 % CI 8.8–27.3) compared to the IDO-medium/high (5.6, 95 % CI 3.5–7.8) group (p = 0.06) (Fig. 5).
Fig. 5.

Average cell counts of CD11b+ cells in IDO-low versus IDO-medium/high tumors
Conclusions
The findings from this study support the observation that higher IDO expression is associated with a better survival outcome, consistent with the findings published by Jaquemiere et al. However, we observed this association in ER+ and node-positive breast cancers but not in ER− disease. Due to the multiple analyses conducted, these findings are hypothesis generating and should be confirmed in other datasets. Although both studies associated elevated IDO with a favorable outcome, we observed elevated IDO in different histological and biologic subtypes than Jaquemiere et al. Their study included a large sample size and reasonable study methodology, but primarily analyzed IDO expression at the RNA level while we studied IDO protein expression in archived tissues. Additional research is required to reconcile the differences between the two studies, but it is known that IDO mRNA expression can be divergent from IDO protein expression due to multiple transcriptional control mechanisms. It is for this reason that we feel measurement of IDO protein may serve as a more reliable means to study the activation of this pathway in relation to other biologic factors. Our study shows that IDO-low-expressing tumors were more frequently estrogen-receptor-negative with greater neovascularization. The other interesting finding is that higher IDO expression levels correlated with higher expression of other inflammatory markers like NOS2 in breast tumors. It has been shown in the past that both IDO and NOS2 are interferon-inducible enzymes which may explain their co-expression in a subset of breast tumors. There is in vitro fibroblast cell line data suggesting that nitric oxide exerts a post-translational inhibitory effect on IDO [20]. While COX2 appeared to positively trend with IDO expression, this could not be confirmed on the multivariate analysis and may require a larger dataset to assess this. Understanding the interplay between these enzymes in experimental breast cancer models could lead to better understanding on how functionally active IDO is and how to manipulate them for maximal immunotherapeutic benefit. Additional analyses could not link IDO expression to the number of tumor-infiltrating T-regulatory and cytotoxic T cells in these breast tumors. However, low IDO expression was found to correlate with increased CD11b+ tumor infiltrates. This preliminary finding, however, will require further confirmation.
Why an immunosuppressive enzyme like IDO could lead to a favorable survival outcome in breast cancer is unknown. It may be that increased IDO activation may lead to a metabolic growth disadvantage due to decreased tryptophan within the tumor microenvironment. The inverse association observed between IDO expression and CD11b+ macrophages is another possibility, as CD11b+ macrophages have been associated with facilitating tumor progression in murine breast cancer models [21]. The pathologic activation of IDO in tumors is only part of a complex web of interconnected metabolic and immune regulatory pathways. It is possible that IDO activation can facilitate or hinder tumor progression in a host. The degree to which it does either may be influenced by other specific host conditions, type of cancer, or stage the malignancy is in. Understanding the role of IDO in the natural progression of breast cancer through various stages and in different scenarios will be important to determine the optimal targeting of this pathway.
Our data suggests that future trials of IDO inhibitors combined with chemotherapy must take into account the proper stratification of biologic subtypes across study treatment arms. This information will better inform clinicians on how to integrate IDO inhibitors currently undergoing clinical trials in the treatment of breast cancer.
Acknowledgments
The authors thank Noel Clark for the IDO IHC work and Mark Lloyd in the Moffitt Cancer Center analytic microscopy core for the image analysis.
References
- 1.Prendergast GC. Immune escape as a fundamental trait of cancer: focus on IDO. Oncogene. 2008;27(28):3889–3900. doi: 10.1038/onc.2008.35. [DOI] [PubMed] [Google Scholar]
- 2.Munn DH, Zhou M, Attwood JT, Bondarev I, Conway SJ, Marshall B, Brown C, Mellor AL. Prevention of allogeneic fetal rejection by tryptophan catabolism. Science. 1998;281(5380):1191–1193. doi: 10.1126/science.281.5380.1191. [DOI] [PubMed] [Google Scholar]
- 3.Mellor AL, Munn D, Chandler P, Keskin D, Johnson T, Marshall B, Jhaver K, Baban B. Tryptophan catabolism and T cell responses. Adv Exp Med Biol. 2003;527:27–35. doi: 10.1007/978-1-4615-0135-0_3. [DOI] [PubMed] [Google Scholar]
- 4.Mellor AL, Munn DH. IDO expression by dendritic cells: tolerance and tryptophan catabolism. Nat Rev. 2004;4(10):762–774. doi: 10.1038/nri1457. [DOI] [PubMed] [Google Scholar]
- 5.Munn DH. Indoleamine 2,3-dioxygenase, tumor-induced tolerance and counter-regulation. Curr Opin Immunol. 2006;18(2):220–225. doi: 10.1016/j.coi.2006.01.002. [DOI] [PubMed] [Google Scholar]
- 6.Fallarino F, Grohmann U, Vacca C, Bianchi R, Orabona C, Spreca A, Fioretti MC, Puccetti P. T cell apoptosis by tryptophan catabolism. Cell Death Differ. 2002;9(10):1069–1077. doi: 10.1038/sj.cdd.4401073. [DOI] [PubMed] [Google Scholar]
- 7.Frumento G, Rotondo R, Tonetti M, Damonte G, Benatti U, Ferrara GB. Tryptophan-derived catabolites are responsible for inhibition of T and natural killer cell proliferation induced by indoleamine 2,3-dioxygenase. J Exp Med. 2002;196(4):459–468. doi: 10.1084/jem.20020121. [DOI] [PMC free article] [PubMed] [Google Scholar]
- 8.Munn DH, Sharma MD, Baban B, Harding HP, Zhang Y, Ron D, Mellor AL. GCN2 kinase in T cells mediates proliferative arrest and anergy induction in response to indoleamine 2,3-dioxygenase. Immunity. 2005;22(5):633–642. doi: 10.1016/j.immuni.2005.03.013. [DOI] [PubMed] [Google Scholar]
- 9.Ge K, Duhadaway J, Sakamuro D, Wechsler-Reya R, Reynolds C, Prendergast GC. Losses of the tumor suppressor BIN1 in breast carcinoma are frequent and reflect deficits in programmed cell death capacity. Int J Cancer. 2000;85(3):376–383. doi: 10.1002/(SICI)1097-0215(20000201)85:3<376::AID-IJC14>3.0.CO;2-1. [DOI] [PubMed] [Google Scholar]
- 10.Ge K, Minhas F, Duhadaway J, Mao NC, Wilson D, Buccafusca R, Sakamuro D, Nelson P, Malkowicz SB, Tomaszewski J, Prendergast GC. Loss of heterozygosity and tumor suppressor activity of Bin1 in prostate carcinoma. Int J Cancer. 2000;86(2):155–161. doi: 10.1002/(SICI)1097-0215(20000415)86:2<155::AID-IJC2>3.0.CO;2-M. [DOI] [PubMed] [Google Scholar]
- 11.Brandacher G, Perathoner A, Ladurner R, Schneeberger S, Obrist P, Winkler C, Werner ER, Werner-Felmayer G, Weiss HG, Gobel G, Margreiter R, Konigsrainer A, Fuchs D, Amberger A. Prognostic value of indoleamine 2,3-dioxygenase expression in colorectal cancer: effect on tumor-infiltrating T cells. Clin Cancer Res. 2006;12(4):1144–1151. doi: 10.1158/1078-0432.CCR-05-1966. [DOI] [PubMed] [Google Scholar]
- 12.Okamoto A, Nikaido T, Ochiai K, Takakura S, Saito M, Aoki Y, Ishii N, Yanaihara N, Yamada K, Takikawa O, Kawaguchi R, Isonishi S, Tanaka T, Urashima M. Indoleamine 2,3-dioxygenase serves as a marker of poor prognosis in gene expression profiles of serous ovarian cancer cells. Clin Cancer Res. 2005;11(16):6030–6039. doi: 10.1158/1078-0432.CCR-04-2671. [DOI] [PubMed] [Google Scholar]
- 13.Ino K, Yoshida N, Kajiyama H, Shibata K, Yamamoto E, Kidokoro K, Takahashi N, Terauchi M, Nawa A, Nomura S, Nagasaka T, Takikawa O, Kikkawa F. Indoleamine 2,3-dioxygenase is a novel prognostic indicator for endometrial cancer. Br J Cancer. 2006;95(11):1555–1561. doi: 10.1038/sj.bjc.6603477. [DOI] [PMC free article] [PubMed] [Google Scholar]
- 14.Muller AJ, DuHadaway JB, Donover PS, Sutanto-Ward E, Prendergast GC. Inhibition of indoleamine 2,3-dioxygenase, an immunoregulatory target of the cancer suppression gene Bin1, potentiates cancer chemotherapy. Nat Med. 2005;11(3):312–319. doi: 10.1038/nm1196. [DOI] [PubMed] [Google Scholar]
- 15.Yu J, Sun J, Wang SE, Li H, Cao S, Cong Y, Liu J, Ren X. Upregulated expression of indoleamine 2, 3-dioxygenase in primary breast cancer correlates with increase of infiltrated regulatory T cells in situ and lymph node metastasis. Clin Dev Immunol. 2011;2011:469135. doi: 10.1155/2011/469135. [DOI] [PMC free article] [PubMed] [Google Scholar]
- 16.Jacquemier J, Bertucci F, Finetti P, Esterni B, Charafe-Jauffret E, Thibult ML, Houvenaeghel G, Van den Eynde B, Birnbaum D, Olive D, Xerri L (2011) High expression of indoleamine 2,3-dioxygenase in the tumour is associated with medullary features and favourable outcome in basal-like breast carcinoma. Int J Cancer Journal international du cancer. doi:10.1002/ijc.25979 [DOI] [PubMed]
- 17.Prueitt RL, Boersma BJ, Howe TM, Goodman JE, Thomas DD, Ying L, Pfiester CM, Yfantis HG, Cottrell JR, Lee DH, Remaley AT, Hofseth LJ, Wink DA, Ambs S. Inflammation and IGF-I activate the Akt pathway in breast cancer. Int J Cancer. 2007;120(4):796–805. doi: 10.1002/ijc.22336. [DOI] [PubMed] [Google Scholar]
- 18.Boersma BJ, Howe TM, Goodman JE, Yfantis HG, Lee DH, Chanock SJ, Ambs S. Association of breast cancer outcome with status of p53 and MDM2 SNP309. J Natl Cancer Inst. 2006;98(13):911–919. doi: 10.1093/jnci/djj245. [DOI] [PubMed] [Google Scholar]
- 19.Glynn SA, Boersma BJ, Dorsey TH, Yi M, Yfantis HG, Ridnour LA, Martin DN, Switzer CH, Hudson RS, Wink DA, Lee DH, Stephens RM, Ambs S. Increased NOS2 predicts poor survival in estrogen receptor-negative breast cancer patients. J Clin Invest. 2010;120(11):3843–3854. doi: 10.1172/JCI42059. [DOI] [PMC free article] [PubMed] [Google Scholar]
- 20.Thomas SR, Terentis AC, Cai H, Takikawa O, Levina A, Lay PA, Freewan M, Stocker R. Post-translational regulation of human indoleamine 2,3-dioxygenase activity by nitric oxide. J Biol Chem. 2007;282(33):23778–23787. doi: 10.1074/jbc.M700669200. [DOI] [PubMed] [Google Scholar]
- 21.Qian B, Deng Y, Im JH, Muschel RJ, Zou Y, Li J, Lang RA, Pollard JW. A distinct macrophage population mediates metastatic breast cancer cell extravasation, establishment and growth. PLoS ONE. 2009;4(8):e6562. doi: 10.1371/journal.pone.0006562. [DOI] [PMC free article] [PubMed] [Google Scholar]