

Abstract
BACKGROUND
In the last five years, a consensus has developed that Alzheimer’s disease (AD) may begin years before overt cognitive impairment (Sperling et al., 2011). Accordingly, the focus has shifted to identifying preclinical disease in order to match treatments to those most likely to benefit. Subtle cognitive changes, including reduced benefit from practice, may be one such preclinical sign. In this paper, we explore cognitive aging trajectories within a large cohort of clinically intact late-middle-aged adults.
METHOD
Longitudinal cognitive data were analyzed from 594 participants in the Wisconsin Registry for Alzheimer’s Prevention. Mixed models were used to examine trajectories, adjusting for prior exposure, and the moderation thereof by markers of dementia risk, APOE-ε4 status, and family history of AD.
RESULTS
Practice effects were observed for Verbal Learning & Memory, Working Memory, Speed & Flexibility, and Visual Learning. However, for Working Memory and Speed & Flexibility, these effects were attenuated for FH+ subjects. CONCLUSION Reduced practice effects have previously been observed in clinical groups (Cooper et al., 2001; Machulda et al., 2013). These results in middle-aged adults suggest that they may also indicate preclinical changes on the path to AD.
Keywords: practice effects, cognitive aging, preclinical Alzheimer’s disease
Introduction
The number of persons affected by Alzheimer’s disease (AD) is projected to triple by 2030 (Hebert, Weuve, Scherr, & Evans, 2013), and at present there is no cure. In the last five years, a scientific consensus has developed that AD most likely begins years before overt cognitive impairment presents itself (Sperling et al., 2011). Accordingly, the focus of research has shifted to identifying preclinical signs of disease in the hopes of matching preventive and curative treatments to those who are most likely to benefit. Much of this work has been geared toward biomarkers of disease. However, identifying early cognitive markers of impairment would give providers an inexpensive and non-invasive tool for monitoring their middle-aged and elderly patients.
There are several measurement issues to contend with when looking for signs of cognitive change. First, cognitive assessments with moderate test-retest reliability are subject to regression to the mean (Frerichs & Tuokko, 2005; Temkin, Heaton, Grant, & Dikmen, 1999), which results in apparent decline among high performers and improvement among lower performers. Second, most assessments are vulnerable to practice effects (Calamia, Markon, & Tranel, 2012; McCaffrey & Westervelt, 1995; Rabbitt, Lunn, Ibrahim, & McInnes, 2009), although these may be diminished in older populations (Salthouse, 2010) and populations with frank cognitive impairment (Darby, Maruff, Collie, & McStephen, 2002; Jordan, 2014).
Interestingly, there are a few articles on the attenuation of normal practice effects as a prospective signal of neurodegeneration. Cooper and colleagues were the first to examine this question, showing in two small-group studies that practice effects on a category fluency task were diminished or absent in groups with AD or mild cognitive impairment (MCI; Cooper et al., 2001; Cooper, Lacritz, Weiner, Rosenberg, & Cullum, 2004). Duff and colleagues later found evidence suggestive of a relationship between diminished practice effects and prospective decline in small clinical or clinically-enriched samples (Duff et al., 2007, 2011), though a follow-up study examining relationships between practice effects and current impairment in a population-based cohort found only weak ones (Duff, Callister, Dennett, & Tometich, 2012). The bulk of these studies use short-interval massed practice, which differs from the typical timeline for clinical retesting, and it is not clear as yet whether very short interval practice engages the same or different cognitive processes as practice occasions separated by months or years. However, Howieson and colleagues (Howieson et al., 2008) found similar results in a longitudinal analysis comparing those who did and did not develop MCI during the follow-up period. On average, those who developed MCI exhibited no practice effect on the Logical Memory tests, whereas the cognitively healthy individuals did, a difference suggestive of an altered preclinical cognitive trajectory . A complementary longitudinal study of the cognitively healthy found that reduced practice effects over one-year retest intervals on two assessments, the Wechsler Memory Scale Associate Memory Test and the Boston Naming Test, were associated with neuropathological features of AD at autopsy (Galvin et al., 2005).
A recent paper by Machulda and colleagues (Machulda et al., 2013) extended this literature by describing practice effects in a large population-based sample of cognitively-healthy older adults with a median baseline age of 78.1. In this sample, which was followed longitudinally for an average of five years, 29 percent of participants were classified as exhibiting MCI before the end of the study. Whereas cognitively healthy individuals’ performance evinced practice effects for memory, language, attention, and visual reasoning domains, improving slightly from Visit 1 to Visit 2 before plateauing at later visits, those with MCI began to deteriorate immediately for language, attention, and visual reasoning domains. Paradoxically, this group did show some evidence of a practice effect for memory, a fact the authors attribute to those who were not diagnosed with MCI until Visit 3 or later. However, it appears that even for those without MCI, memory tasks benefited from the greatest practice effects, which may also help to resolve the paradox.
Although the work by Machulda and colleagues filled an important gap in the preclinical literature, identifying vulnerable populations in late life may be too late for effective intervention (Sperling et al., 2011). While studies on younger adults lack the “ground truth” provided by frank endpoint diagnoses of MCI or dementia, we can use them to explore antecedent cognitive trajectories stratifying by known markers of future dementia risk, including APOE-ε4 carrier status (Strittmatter et al., 1993; Strittmatter & Roses, 1995) and a family history of AD (La Rue et al., 2008). In this paper, we explore cognitive aging trajectories within a large cohort of middle-aged adults, most of whom are at elevated risk for developing AD (Sager, Hermann, & La Rue, 2005). Primary analyses focused on two questions: 1) What longitudinal cognitive trends are observed in a sample of at-risk middle-aged adults, and how do practice effects contribute to those trends? 2) How do genetic risk factors, including APOE and family history of AD, affect performance, cross-sectionally and longitudinally?
Methods
Participants
The Wisconsin Registry for Alzheimer’s Prevention (WRAP) is an ongoing longitudinal study of a sample of middle-aged adults, all cognitively-healthy at baseline, but enriched for a family history of AD (Sager et al., 2005). Recruitment began in 2001 and is ongoing. WRAP participants were generally between the ages of 40 and 65 years at baseline, English speaking, and had a parent with either autopsy-confirmed or probable AD (FH+) as defined by NINCDS-ADRDA research criteria (McKhann et al., 1984) or no parental history of AD or other dementia (FH−). FH+ subjects were volunteers whose parent(s) had been evaluated in a memory assessment clinic at the University of Wisconsin-Madison or at affiliated satellite memory assessment clinics, and others who learned about the study from educational presentations or word of mouth. To verify the diagnosis of AD in parents not directly assessed, autopsy reports or parental medical records were reviewed when available. Otherwise the dementia questionnaire interview was conducted, which has been shown to have very good agreement with clinical diagnosis (Kawas, Segal, Stewart, Corrada, & Thal, 1994). Most FH- participants had mothers who survived to at least age 75, and fathers to at least age 70, without AD, other dementia, or significant memory deficits. These participants were recruited through community presentations and word of mouth.
The WRAP sample currently includes 1541 middle-aged adults recruited predominantly in the upper Midwest and tested at sites in Madison, LaCrosse, and Milwaukee. For the present analyses, we considered only subjects (N=707) who had completed three or four waves of cognitive tests without reporting other neurological diagnoses that could affect cognition (including AD, stroke, epilepsy, meningitis, Parkinson’s disease, and multiple sclerosis). To simplify the covariance structures in our models, when data were available from more than one sibling in a given family, we included only the sibling who had returned for the most waves; ties were broken through random selection. Our analyses also excluded subjects with incomplete data on any predictors of interest (N=2 missing APOE status). However, those with incomplete cognitive data were included as much as was feasible. For instance, for any participant who was missing data from one test at one timepoint, we excluded that visit’s data from the analysis of the affected outcome, but all other data – the remaining two or three visits of data from the same outcome, and all visits for all other outcomes – were still included. Our final sample consisted of N=594 subjects.
General study procedures
A battery of commonly used clinical neuropsychological tests was administered at each wave of assessment, in addition to questionnaires about mood, health history and lifestyle, laboratory tests, and APOE genotyping (see Sager et al., 2005 for a description of the baseline procedures). Cognitive measures included in the present analyses are shown in Table 1. The first test-retest interval was approximately four years; further visits occurred at two-year intervals. All study procedures have been approved by the Health Sciences IRB of the University of Wisconsin-Madison.
Table 1.
Factor structure of five cognitive domains identified in the battery for the Wisconsin Registry for Alzheimer’s Prevention (WRAP). Mean (SD) baseline scores for family history groups (FH+ vs FH-) are also shown for each test. For the first four factors, “baseline” refers to Wave 1; for the last two, Wave 2, when the tests were first administered.
| Factor name | Cognitive test | FH+ | FH- |
|---|---|---|---|
| Immediate Memory | Rey Auditory Verbal Learning Test (AVLT)a: | ||
| Trial 1 | 6.3 (1.7) | 6.6 (1.7) | |
| Trial 2 | 9.2 (2.0) | 9.5 (2.0) | |
| Verbal Learning & Memory | Rey AVLT: | ||
| Trial 3 | 10.9 (2.1) | 10.9 (2.1) | |
| Trial 4 | 11.8 (2.0) | 11.8 (2.1) | |
| Trial 5 | 12.3 (2.0) | 12.2 (2.0) | |
| Delayed recall | 10.3 (2.9) | 10.3 (2.8) | |
| Working Memory | Wechsler Adult Intelligence Scale- IIIb: | ||
| Digit Span Forward | 10.5 (2.2) | 10.4 (2.3) | |
| Digit Span Backward | 7.0 (2.3) | 7.0 (2.2) | |
| Letter-number Sequencing | 10.5 (2.5) | 10.7 (2.5) | |
| Speed & Flexibility | Stroop Color-Word Testc: Interference trial | 109.2 (20.9) | 107.2 (20.9) |
| Trail-Making Testd: | |||
| Part A | 27.3 (9.4) | 28.1 (9.0) | |
| Part B | 65.7 (33.1) | 65.7 (29.0) | |
|
| |||
| Visual Learning & Memory | Brief Visuospatial Memory Teste: | ||
| Sum of Trials 1 - 3 | 24.2 (5.5) | 23.7 (5.7) | |
| Delayed recall | 9.5 (1.9) | 9.4 (1.9) | |
| Story Recall | Wechsler Memory Scale (Revised)f, Logical Memory II: | ||
| Sum of A & B immediate recall | 29.2 (6.2) | 29.4 (6.0) | |
| Sum of A & B delayed recall | 25.9 (6.8) | 26.1 (7.0) | |
Lezak, Howieson, & Loring, 1984
Wechsler, 1999
Trenerry, Crosson, DeBoe, & Leber, 1989
Reitan & Wolfson, 1993
Benedict, 1997
Wechsler, 1987
Cognitive outcomes
Factor analysis using promax rotation and maximum likelihood estimation (Grice, 2001) were used to reduce the set of cognitive measures to a smaller number of factors and obtain weights used to combine the measures within each factor. The resulting weighted factor scores were then standardized (~N (0, 1)) into z-scores, using means and standard deviations obtained from the whole baseline sample (additional details on the factor analysis methods used for the WRAP sample can be found in Dowling, Hermann, La Rue, & Sager, 2010 and Koscik et al., 2014). Among tests begun at Wave 1, there are two factors representing new verbal learning and recall (Immediate Memory; Verbal Learning and Memory), both derived from the Rey Auditory Verbal Learning Test (Lezak, Howieson, & Loring, 2004), and two factors reflecting components of executive function (Working Memory; Speed and Flexibility). A similar factor analysis was performed on Wave 2 data, suggesting that the newly-added Brief Visuospatial Memory Test and WMS-Logical Memory each required a separate factor (Visual Learning & Memory; Story Recall). Table 1 shows the six factors and the cognitive tests that loaded on each factor.
Statistical analysis
Analyses were conducted using SAS (version 9.3). Outcomes were approximately normal (|skewness| & |kurtosis| < 1).
We used linear mixed models to examine longitudinal trends in cognition and their relationship to familial/genetic risk. As noted by Machulda and colleagues (Machulda et al., 2013), this technique avoids some of the problems inherent in change-score-based methods, while allowing for inclusion of incomplete records. Major predictors of interest were age (linear and quadratic), which we centered for ease of interpretation; amount of prior practice, which we operationalized as the number of times the subject had previously taken the test as part of this study (ranging from 0 to 3); and family history (FH) and the presence of at least one APOE-ε4 allele (APOE), which were treated as indicator variables (1=present, 0=absent). Also considered were interaction effects between age and practice, on the one hand, and FH and APOE-ε4 status, on the other. Education level (highest degree attained), site of testing, and sex were initially included as covariates; following reviewer input, CES-D scores were covaried in a secondary analysis. Because our design was unbalanced, we used the Kenward-Roger approximation to calculate denominator degrees of freedom for all tests (Schaalje, McBride, & Fellingham, n.d.).
Models were fit using restricted maximum likelihood. Random effects were evaluated by likelihood-ratio (χ2) tests; fixed effects were evaluated via F-tests based on Type III sums of squares. For significance testing, we set α=.05. However, for interactions, we retained effects with p < .10. Although a p-value between .05 and .10 is by convention not statistically significant, we chose to keep interaction terms in this range in the model to ensure that our interpretation of related main effects was conservative. Models were constructed as follows. For each outcome, unrestricted means models were tested with a variety of covariance structures, including random intercept only; random intercept plus a random slope for age, with uncorrelated intercept and slope (indicated in SAS with the type=vc option within the random statement); and random intercept and slope, with correlation permitted between intercept and slope (in SAS, type=un). We also tested whether repeated measurements within subjects exhibited an autoregressive structure (i.e., tighter correlations between visits adjacent in time) that could account for additional variance beyond the random effects (within the repeated statement, type=ar(1)). Once a full covariance structure had been selected, we added predictors of interest and covariates, beginning with a full model containing all interactions and removing nonsignificant interactions (p>.10) one by one in descending order by p-value, refitting iteratively until no nonsignificant interactions remained.
Collinearity diagnostics were examined for final models. In some cases, inclusion of interaction effects produced tolerances that fell below 0.2 (Cohen, Cohen, West, & Aiken, 2003). In these cases, we stratified by one of the constituent terms (FH or APOE) and ran separate models to provide more stable estimates of the relevant simple main effects. Quantile-quantile plots of residuals were also examined for evidence of significant outliers.
Results
Our final sample included data from 594 participants. Demographic and other characteristics of our sample can be found in Table 2. The FH+ group, on average, was older, had longer test-retest intervals, and lower full-scale IQ. Among sample members who had returned for three visits, those in the FH+ group were also more likely to be six months or more past their due date for a fourth visit (24% vs 9% past due; χ2(2) = 14.66, p = .0007). The FH+ group also had a higher percentage of people from Madison; a higher proportion with four visits; and more subjects with the APOE-ε4 allele. Accordingly, we controlled for site in our analyses, and conducted secondary analyses including only three visits, to assess the impact of these differences on our findings.
Table 2.
Demographic characteristics of the study sample (N=594) stratified by family history (FH). Bold lines indicate statistically-significant differences between FH+ and FH- participants. Note: APOE = apolipoprotein-E.
| FH+ (N=429) | FH- (N=165) | |
|---|---|---|
| Age at baseline, mean (SD, range) | 53.3 (6.4, 40–67) | 56.6 (6.0, 36–68) |
| Baseline to Wave 2 interval, mean (years; SD, range) | 4.4 (0.49, 2.3–7.1) | 4.0 (0.41, 3.3–7.0) |
| Wave 2 to 3 interval, mean (years; SD, range) | 2.3 (.37, 1.6–4.4) | 2.1 (.25, 1.5–3.3) |
| Site, N (%) | ||
| Madison | 387 (90) | 136 (82) |
| La Crosse | 42 (10) | 29 (18) |
| Sex, number female (%) | 301 (70) | 106 (64) |
| APOE, number ε4+ (%) | 194 (45) | 31 (19) |
| Race, number white (%) | 424 (98) | 164 (99) |
| Education, number with BA (%) | 284 (66) | 117 (71) |
| Full-scale IQ, mean (SD, range) | 114 (9, 75–140) | 115 (8, 86–135) |
| CESD total score, mean (SD, range) | 7.4 (7.6, 0–51) | 5.8 (6.2, 0–40) |
WRAP participants excluded from these analyses for reasons other than neurological diagnoses (i.e., for reasons not expected to influence cognition; N=835) differed somewhat from those participants who were included. Specifically, excluded participants tended to have less education (52% vs 68% with BA; χ2(1) = 34.48, p < .0001) and lower IQ (110 vs 114; t(1424) = −8.11, p < .0001) than included participants. In addition, five years into the study, an urban site was added to increase demographic diversity; as this site has not yet seen any subjects return for Wave 3, included participants were less racially diverse than those excluded from analysis (98% vs 83% white; χ2(1) = 86.57, p < .0001). These differences should not affect the internal validity of our analyses, but limits their generalizability somewhat (see Discussion).
Covariance structures
Random intercepts were retained automatically to represent intra-subject correlation. Model selection procedures described above led to retention of age as a random effect (uncorrelated with the intercept) for Immediate Memory (χ2(1) = 4.8, p = .028), Verbal Learning & Memory (χ2(1) = 20.7, p < .0001), and Speed & Flexibility (χ2(1) = 8.6, p = . 00034). In addition, the Speed & Flexibility factor exhibited autoregressive structure not accounted for in the random effects (χ2(1) = 4.2, p = .040).
Model diagnostics
Residuals from each model were plotted against normal quantiles to look for evidence of model misfit. Plots for four of the six factors – Immediate Memory, Working Memory, Speed & Flexibility, and Story Recall -- indicated that residuals were normally distributed, with no significant outliers. For the other two factors – Verbal Learning & Memory and Visual Learning – these plots showed some evidence of restriction of range (i.e., ceiling and/or floor effects), but again, no significant outliers were found.
Practice and age effects
Significant, positive effects of previous exposure to the WRAP battery were observed for Verbal Learning & Memory, Working Memory, Speed and Flexibility, and Visual Learning. In addition, performance on Immediate Memory showed marginal improvement from wave to wave. Follow-up analyses suggested no independent effects of test-retest interval on any of these outcomes; accordingly, in the interest of model simplicity, these terms were not included in the final models. Boxplots of estimated means for each outcome at each visit, adjusting for other factors, are presented in Figure 1.
Figure 1.

Main effect of practice. To depict the practice effects for each factor score, we first obtained the factor score residuals at each visit, after adjusting for all model terms other than visit number, and created boxplots of these residuals. The center line of each boxplot in Figure 1 represents the estimated mean outcome at each visit. Factors with significant practice effects show center lines that increase across visits. Note: Visual Learning and Story Recall scores available starting at Visit 2.
After controlling for these practice effects, small but significant negative effects of age on performance were observed for Immediate Memory, Verbal Learning & Memory, Speed & Flexibility, Visual Learning & Memory, and Story Recall. Furthermore, negative quadratic effects of age – that is, accelerating decline over time – were observed for Verbal Learning & Memory, Working Memory, and Speed & Flexibility. For these four outcomes, in models excluding practice effects, the linear age coefficients are shallower, especially for Speed & Flexibility (excluding practice, βage = −0.011; including practice, βage = −0.069). Coefficient estimates and standard errors for models that include effects related to practice can be found in Table 3.
Table 3.
Regression coefficients describing longitudinal and genetic effects on six cognitive outcomes. Coefficients with p<.05 are bold. Note: APOE = apolipoprotein-E.
| Immediate Memory | Verbal Learning & Memory | Working Memory | Speed & Flexibility | Visual Learning & Memory | Story Recall | |
|---|---|---|---|---|---|---|
| β (SE) | β (SE) | β (SE) | β (SE) | β (SE) | β (SE) | |
| Age, centered, linear (yrs) | −0.028 (0.0058) | −0.027 (0.0058) | −0.0096 (0.0058) | −0.069 (0.011) | −0.036 (0.0058) | −0.023 (0.0058) |
| Age, centered, quadratic (yrs2) | −.00063 (0.00037) | −0.00068 (0.00030) | −0.00095 (0.00024) | −0.0015 (0.00028) | -- | -- |
| Practice, linear (no. exposures) | 0.040 (0.023) | 0.076 (0.021) | 0.096 (0.028) | 0.25 (0.039) | 0.16 (0.034) | −0.035 (0.026) |
|
| ||||||
| FH+ | −0.12 (0.078) | −0.10 (0.081) | 0.081 (0.091) | −0.025 (0.087) | 0.0060 (0.085) | −0.15 (0.083) |
| FH x age | -- | -- | -- | 0.025 (0.012) | -- | -- |
| FH x practice | -- | -- | −0.052 (0.025) | −0.089 (0.045) | -- | -- |
|
| ||||||
| APOE-ε4+ | −0.0019 (0.069) | 0.037 (0.072) | −0.088 (0.078) | −0.075 (0.070) | 0.099 (0.11) | −0.030 (0.075) |
| APOE-ε4 x age | -- | -- | -- | -- | -- | -- |
| APOE-ε4 x practice | -- | -- | -- | -- | −0.090 (0.050) | -- |
Effects of genetic risk
All main effects of FH and APOE were nonsignificant (p > .05). However, several longitudinal interaction effects were observed. Significant negative FH × practice effects were observed for Working Memory (F(1,1403) = 4.40, β = −0.052, p = .036, ηp2=.0031) and Speed & Flexibility (F(1,1134) = 3.91, β = −0.089, p = 0.048, ηp2=.0034), such that practice effects were attenuated for FH+ subjects. Furthermore, a significant positive FH × age effect was seen for Speed & Flexibility (F(1,624) = 4.20, β = 0.025, p = .041, ηp2=.0067), with FH+ subjects showing slower decline with age. No significant interactions were observed with APOE; however, a weak (p < .10) APOE × practice effect was observed for Visual Learning (F(1,842) = 3.27, β = −.090, p = .071, ηp2=.0039), with APOE-ε4+ subjects showing attenuated practice effects. Although this did not reach statistical significance, we retained it in the model to ensure conservative estimates of constituent main effects. Diagnostics suggested multicollinearity in all models containing interaction terms; accordingly, simple slopes were calculated by stratifying by FH or APOE, as appropriate. Graphs depicting model estimates of simple main effects can be found in Figure 2.
Figure 2.

Interaction effects retained in longitudinal models. Family history by practice interaction effects on Working Memory (A) and Speed & Flexibility (B); Apolipoprotein-E (APOE) by practice interaction effect on Visual Learning (C); Family history by age interaction effect on Speed & Flexibility (D). Points represent raw observation values. Note: Visual Learning scores available starting at Visit 2.
Secondary analysis: Speed & Flexibility followup
The combination of FH x age and FH x practice effects for Speed & Flexibility prompted a post-hoc exploration of the full set of interactions between these variables. Similar longitudinal interactions with APOE were added for the sake of completeness. Both three-way interactions were nonsignificant and were removed, as were all other interaction effects including APOE. However, one additional effect – the age by practice interaction – was significant (F(1,1580) = 21.66, β = −.017, p < .0001, ηp2=.014) and indicated a reduced practice effect for older individuals in the study. To untangle these effects and remove any effects of multicollinearity on our coefficients, we ran a simple interactions analysis on Speed & Flexibility stratifying by visit number and examined the FH x age interactions at visits 1 through 3 (Fig. 3). These effects were all positive, of similar magnitude, and of at least marginal significance (Visit 1: F(1,549) = 3.48, β = 0.026, p = .062, ηp2 = .0064; Visit 2: F(1,568) = 6.43, β = 0.036, p = .012, ηp2 = .011; Visit 3: F(1,569) = 5.81, β = 0.033, p = .016, ηp2 = .010).
Figure 3.
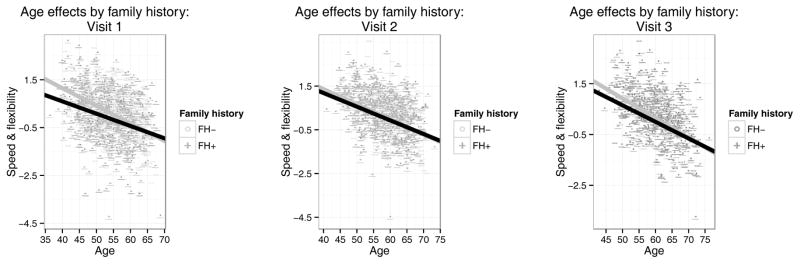
Simple main effects of age on Speed & Flexibility, stratifying by FH and visit number (Visits 1–3; A-C). Points represent raw observation values. At this granularity, all quadratic effects were nonsignificant (p > .05) and are not plotted.
To better understand the effects we saw, we constructed secondary models of the raw test scores, following the same basic procedure described for the factor scores. (Note that for Trail-Making Test subtests, higher scores indicate worse performance.) For Trails A, the basic pattern of results was the same as for the overall factor scores: performance deteriorated with age (β = 0.47, p < .0001) and improved with practice (β = −2.42, p < .0001), but FH+ participants showed less improvement with practice (FH × practice: β = 0.97, p = .026) paired with a shallower deterioration with age (FH × age: β = −0.20, p = .034). Performance on Trails B also worsened with age (β = 0.95, p < .0001) and improved with practice (β = −4.36, p < .0001), but there the similarity ended: no significant interactions with genetic risk were observed (all ps > .10). Finally, like Trails A, the Stroop interference task showed a pattern like that seen in the factor scores: deterioration with age (β = −1.27, p < .0001), improvement with practice (β = 5.04, p < .0001), and contrary age and practice interactions with genetic risk (FH × practice: β = −2.09, p = .018; FH × age: β = 0.73, p = .006).
Secondary analysis: three visits only
Because practice effects are subject to diminishing returns, the discrepancy between FH+ and FH- in total number of visits is a potential confound, and one complicated by the apparent difference in reason for nonreturn (administrative bias vs differential attrition). Accordingly, secondary analyses were run to examine the effects of genetic risk only including the first three visits for all subjects. For the Speed & Flexibility model, the secondary age by practice interaction effect described above was retained. In this analysis, the FH × practice effects were similar in magnitude but statistically weak, with none retaining significance (Speed & Flexibility: F(1,1117) = 3.78, β = −0.095, p = 0.052; Working Memory: F(1,1196) = 2.58, β = −0.046, p = .11). The previously-weak APOE × practice effect disappeared entirely (F(1,591) = 0.30, β = −.039, p = .58).
Secondary analysis: effects of depression
The observed baseline group difference in CES-D scores raises the question of whether effects of FH are better explained by depression. Accordingly, a secondary analysis was run controlling for (time-varying) CES-D. No independent effect of this covariate was observed on Immediate Memory, Working Memory, or Speed & Flexibility. For the other three factors, the effect of CES-D on the outcome itself was significant, but coefficient estimates and significance levels were essentially unchanged by its inclusion.
Discussion
In these analyses, we observed statistically significant age-related changes on five of six cognitive measures in a middle aged sample. These changes were very small, on the order of one tenth of a standard deviation every four years. On the other hand, the practice effects themselves – while still fairly small – were larger for most outcomes, with the most susceptible outcome, Speed & Flexibility, evincing an average effect of a quarter of a standard deviation per visit. Without adjusting for prior practice with the battery, our estimated age trajectories for these individuals were shallower, making decline harder to detect.
In addition, we observed an age x practice interaction on Speed & Flexibility. Although the effect was observed in a post-hoc analysis and therefore should be interpreted with caution, it is worth noting both that this was the factor with the strongest overall age effect (Table 3) and that it represents a domain known to deteriorate markedly with age (Salthouse, 2010). These findings highlight the importance of accounting for practice effects when using longitudinal data to estimate cognitive trajectories in preclinical populations.
No overall differences were seen between genetic risk groups on any measure. However, modest differences between our FH risk groups were observed on the practice effects for two factors, Working Memory and Speed & Flexibility. This effect, though slight, could presage the findings of reduced practice effects in older clinical and preclinical groups observed by others (Darby et al., 2002; Galvin et al., 2005; Howieson et al., 2008; Jordan, 2014; Machulda et al., 2013). Somewhat surprisingly, no significant differences in practice effects between APOE groups was observed, whereas other authors have found modest evidence for such interaction effects (Donix et al., 2012; Zehnder et al., 2009). Given the reduction in practice effects that is usually observed over time, the between-group differences in total number of visits is an important potential confound – one that represents a feature of the study design, but which may affect the size of practice effects nonetheless. Future analyses should replicate this preliminary finding in a group with more balanced return.
After adjusting for practice effects, genetic risk by age interactions were conspicuous in their absence. Indeed, the only such interaction was in the opposite direction of what might be expected, with low-risk (FH-) subjects displaying worse age-related change on average on a speed and flexibility factor and on two of three specific tests comprising that factor. Examined cross-sectionally, i.e. controlling for practice effects, similarly-unexpected FH by age relationships were observed on all sets of observations with sufficient data. One possible explanation relates to the difference in baseline age between our risk groups (Table 2). Aging is associated with quadratic decreases in performance in both healthy and clinical samples. Although our analyses included a main effect of age, given the complex recruitment design of this study, with variation not only in baseline ages but in between-visit intervals, including it as a covariate might not provide sufficient statistical control. Such an explanation would be in keeping with the change from a marginal cross-sectional FH x age effect at Visit 1 to a significant effect at later visits.
One limitation of this study pertains to age-cohort effects. Trajectories in longitudinal studies are a function of three variables, only two of which one can assess in the same model: within-person aging, which is usually the effect of interest; amount of practice with the assessment, which is usually a confound; and age-cohort, which is another potential confound that can muddy the interpretive waters (Hoffman, Hofer, & Sliwinski, 2011). One clue to the presence of age-cohort effects can be seen when the assumption of convergence is not met – that is, when longitudinal and cross-sectional estimates of the effect of age are dissimilar. In this dataset, the outcome featuring the strongest practice effect, Speed & Flexibility, did not show evidence of this problem: estimated slopes for age were very similar longitudinally and cross-sectionally. This finding encourages confidence that the observed effect of retest is truly a practice effect and not a cohort effect.
Another limitation of these results pertains to their generalizability. As noted, the subgroup that was eligible for inclusion in these analyses is more racially-homogenous and better-educated than the WRAP cohort as a whole. Although this bias is largely administrative, it will be important to reexamine these hypotheses in the coming years, once enough longitudinal data has been collected on our urban sample to estimate their trajectories.
Health and lifestyle in middle age affect AD risk in later years (Barnes & Yaffe, 2011), and there is growing interest in secondary prevention trials that begin in midlife. Our results highlight the importance of controlling for the effects of practice on cognitive outcomes in these trials, for individuals with and without enhanced genetic risk. Although the effect sizes seen in this preclinical group are far from what would be needed to establish practice effects as a clinical screening tool, the fact that such effects are present even with between-visit intervals of several years suggests that they should be taken into account when understanding apparent changes in cognition between clinic visits, because the expected trajectory across visits is not merely nonnegative, but actually weakly positive. Future studies with the WRAP cohort as our participants grow older should investigate whether those who evinced weak practice effects in middle age show higher rates or earlier ages of conversion to MCI or AD.
Acknowledgments
This research was supported by NIA grant R01AG27161 (Wisconsin Registry for Alzheimer Prevention: Biomarkers of Preclinical AD), NIH grant M01RR03186 (University of Wisconsin Clinical and Translational Research Core), the Helen Bader Foundation, Northwestern Mutual Foundation, and Extendicare Foundation. The project described was supported by the Clinical and Translational Science Award (CTSA) program, through the NIH National Center for Advancing Translational Sciences (NCATS), grant UL1TR000427.
The authors gratefully acknowledge the assistance of Shawn Bolin, Maggie Kengott, Gail Lange, Kimberly Mueller, Nia Norris, Janet Rowley, Susan Schroeder, Diane Wilkinson, Pam Winne, and Megan Zuelsdorff for WRAP data collection. We especially thank the WRAP participants.
Footnotes
The content is solely the responsibility of the authors and does not necessarily represent the official views of the NIH.
References
- Barnes DE, Yaffe K. The projected effect of risk factor reduction on Alzheimer’s disease prevalence. The Lancet. Neurology. 2011;10(9):819–828. doi: 10.1016/S1474-4422(11)70072-2. [DOI] [PMC free article] [PubMed] [Google Scholar]
- Calamia M, Markon K, Tranel D. Scoring higher the second time around: meta-analyses of practice effects in neuropsychological assessment. The Clinical Neuropsychologist. 2012;26(4):543–570. doi: 10.1080/13854046.2012.680913. [DOI] [PubMed] [Google Scholar]
- Cohen J, Cohen P, West SG, Aiken LS. Applied multiple regression/correlation analysis for the behavioral sciences. 3. Mahwah, NJ, US: Lawrence Erlbaum Associates Publishers; 2003. Retrieved from http://search.ebscohost.com/login.aspx?direct=true&AuthType=ip,uid&db=psyh&AN=2002-18109-000&site=ehost-live&scope=site. [Google Scholar]
- Cooper DB, Epker M, Lacritz L, Weine M, Rosenberg RN, Honig L, Cullum CM. Effects of practice on category fluency in Alzheimer’s disease. The Clinical Neuropsychologist. 2001;15(1):125–128. doi: 10.1076/clin.15.1.125.1914. [DOI] [PubMed] [Google Scholar]
- Cooper DB, Lacritz LH, Weiner MF, Rosenberg RN, Cullum CM. Category fluency in mild cognitive impairment: reduced effect of practice in test-retest conditions. Alzheimer Disease and Associated Disorders. 2004;18(3):120–122. doi: 10.1097/01.wad.0000127442.15689.92. [DOI] [PubMed] [Google Scholar]
- Darby D, Maruff P, Collie A, McStephen M. Mild cognitive impairment can be detected by multiple assessments in a single day. Neurology. 2002;59(7):1042–1046. doi: 10.1212/wnl.59.7.1042. [DOI] [PubMed] [Google Scholar]
- Donix M, Ercoli LM, Siddarth P, Brown JA, Martin-Harris L, Burggren AC, Bookheimer SY. Influence of Alzheimer disease family history and genetic risk on cognitive performance in healthy middle-aged and older people. The American Journal of Geriatric Psychiatry: Official Journal of the American Association for Geriatric Psychiatry. 2012;20(7):565–573. doi: 10.1097/JGP.0b013e3182107e6a. [DOI] [PMC free article] [PubMed] [Google Scholar]
- Dowling NM, Hermann B, La Rue A, Sager MA. Latent structure and factorial invariance of a neuropsychological test battery for the study of preclinical Alzheimer’s disease. Neuropsychology. 2010;24(6):742–756. doi: 10.1037/a0020176. [DOI] [PMC free article] [PubMed] [Google Scholar]
- Duff K, Beglinger LJ, Schultz SK, Moser DJ, McCaffrey RJ, Haase RF Huntington’s Study Group. Practice effects in the prediction of long-term cognitive outcome in three patient samples: a novel prognostic index. Archives of Clinical Neuropsychology: The Official Journal of the National Academy of Neuropsychologists. 2007;22(1):15–24. doi: 10.1016/j.acn.2006.08.013. [DOI] [PMC free article] [PubMed] [Google Scholar]
- Duff K, Callister C, Dennett K, Tometich D. Practice effects: a unique cognitive variable. The Clinical Neuropsychologist. 2012;26(7):1117–1127. doi: 10.1080/13854046.2012.722685. [DOI] [PubMed] [Google Scholar]
- Duff K, Lyketsos CG, Beglinger LJ, Chelune G, Moser DJ, Arndt S, McCaffrey RJ. Practice effects predict cognitive outcome in amnestic mild cognitive impairment. The American Journal of Geriatric Psychiatry: Official Journal of the American Association for Geriatric Psychiatry. 2011;19(11):932–939. doi: 10.1097/JGP.0b013e318209dd3a. [DOI] [PMC free article] [PubMed] [Google Scholar]
- Frerichs RJ, Tuokko HA. A comparison of methods for measuring cognitive change in older adults. Archives of Clinical Neuropsychology: The Official Journal of the National Academy of Neuropsychologists. 2005;20(3):321–333. doi: 10.1016/j.acn.2004.08.002. [DOI] [PubMed] [Google Scholar]
- Galvin JE, Powlishta KK, Wilkins K, McKeel DW, Xiong C, Grant E, Morris JC. Predictors of preclinical Alzheimer disease and dementia: a clinicopathologic study. Archives of Neurology. 2005;62(5):758–765. doi: 10.1001/archneur.62.5.758. [DOI] [PubMed] [Google Scholar]
- Grice JW. A comparison of factor scores under conditions of factor obliquity. Psychological Methods. 2001;6(1):67–83. doi: 10.1037/1082-989x.6.1.67. [DOI] [PubMed] [Google Scholar]
- Hebert LE, Weuve J, Scherr PA, Evans DA. Alzheimer disease in the United States (2010-2050) estimated using the 2010 census. Neurology. 2013;80(19):1778–1783. doi: 10.1212/WNL.0b013e31828726f5. [DOI] [PMC free article] [PubMed] [Google Scholar]
- Hoffman L, Hofer SM, Sliwinski MJ. On the confounds among retest gains and age-cohort differences in the estimation of within-person change in longitudinal studies: a simulation study. Psychology and Aging. 2011;26(4):778–791. doi: 10.1037/a0023910. [DOI] [PMC free article] [PubMed] [Google Scholar]
- Howieson DB, Carlson NE, Moore MM, Wasserman D, Abendroth CD, Payne-Murphy J, Kaye JA. Trajectory of mild cognitive impairment onset. Journal of the International Neuropsychological Society: JINS. 2008;14(2):192–198. doi: 10.1017/S1355617708080375. [DOI] [PubMed] [Google Scholar]
- Jordan C. Practice gains in episodic memory tests: An assessment of older adults with and without cognitive impairment. ProQuest Information & Learning, US. 2014 Retrieved from psyh. (2014-99120-545) [Google Scholar]
- Kawas C, Segal J, Stewart WF, Corrada M, Thal LJ. A validation study of the Dementia Questionnaire. Archives of Neurology. 1994;51(9):901–906. doi: 10.1001/archneur.1994.00540210073015. [DOI] [PubMed] [Google Scholar]
- Koscik RL, La Rue A, Jonaitis EM, Okonkwo OC, Johnson SC, Bendlin BB, Sager MA. Emergence of mild cognitive impairment in late middle-aged adults in the wisconsin registry for Alzheimer’s prevention. Dementia and Geriatric Cognitive Disorders. 2014;38(1–2):16–30. doi: 10.1159/000355682. [DOI] [PMC free article] [PubMed] [Google Scholar]
- La Rue A, Hermann B, Jones JE, Johnson S, Asthana S, Sager MA. Effect of parental family history of Alzheimer’s disease on serial position profiles. Alzheimer’s & Dementia: The Journal of the Alzheimer’s Association. 2008;4(4):285–290. doi: 10.1016/j.jalz.2008.03.009. [DOI] [PMC free article] [PubMed] [Google Scholar]
- Machulda MM, Pankratz VS, Christianson TJ, Ivnik RJ, Mielke MM, Roberts RO, Petersen RC. Practice effects and longitudinal cognitive change in normal aging vs. incident mild cognitive impairment and dementia in the Mayo Clinic Study of Aging. The Clinical Neuropsychologist. 2013;27(8):1247–1264. doi: 10.1080/13854046.2013.836567. [DOI] [PMC free article] [PubMed] [Google Scholar]
- McCaffrey RJ, Westervelt HJ. Issues associated with repeated neuropsychological assessments. Neuropsychology Review. 1995;5(3):203–221. doi: 10.1007/BF02214762. [DOI] [PubMed] [Google Scholar]
- McKhann G, Drachman D, Folstein M, Katzman R, Price D, Stadlan EM. Clinical diagnosis of Alzheimer’s disease: report of the NINCDS-ADRDA Work Group under the auspices of Department of Health and Human Services Task Force on Alzheimer’s Disease. Neurology. 1984;34(7):939–944. doi: 10.1212/wnl.34.7.939. [DOI] [PubMed] [Google Scholar]
- Rabbitt P, Lunn M, Ibrahim S, McInnes L. Further analyses of the effects of practice, dropout, sex, socio-economic advantage, and recruitment cohort differences during the University of Manchester longitudinal study of cognitive change in old age. Quarterly Journal of Experimental Psychology (2006) 2009;62(9):1859–1872. doi: 10.1080/17470210802633461. [DOI] [PubMed] [Google Scholar]
- Sager MA, Hermann B, La Rue A. Middle-aged children of persons with Alzheimer’s disease: APOE genotypes and cognitive function in the Wisconsin Registry for Alzheimer’s Prevention. Journal of Geriatric Psychiatry and Neurology. 2005;18(4):245–249. doi: 10.1177/0891988705281882. [DOI] [PubMed] [Google Scholar]
- Salthouse TA. Influence of age on practice effects in longitudinal neurocognitive change. Neuropsychology. 2010;24(5):563–572. doi: 10.1037/a0019026. [DOI] [PMC free article] [PubMed] [Google Scholar]
- Schaalje GB, McBride JB, Fellingham GW. Approximations to Distributions of Test Statistics in Complex Mixed Linear Models Using SAS® Proc MIXED. n.d (No. Paper 262–26) [Google Scholar]
- Sperling RA, Aisen PS, Beckett LA, Bennett DA, Craft S, Fagan AM, Phelps CH. Toward defining the preclinical stages of Alzheimer’s disease: recommendations from the National Institute on Aging-Alzheimer’s Association workgroups on diagnostic guidelines for Alzheimer’s disease. Alzheimer’s & Dementia: The Journal of the Alzheimer’s Association. 2011;7(3):280–292. doi: 10.1016/j.jalz.2011.03.003. [DOI] [PMC free article] [PubMed] [Google Scholar]
- Strittmatter WJ, Roses AD. Apolipoprotein E and Alzheimer disease. Proceedings of the National Academy of Sciences of the United States of America. 1995;92(11):4725–4727. doi: 10.1073/pnas.92.11.4725. [DOI] [PMC free article] [PubMed] [Google Scholar]
- Strittmatter WJ, Saunders AM, Schmechel D, Pericak-Vance M, Enghild J, Salvesen GS, Roses AD. Apolipoprotein E: high-avidity binding to beta-amyloid and increased frequency of type 4 allele in late-onset familial Alzheimer disease. Proceedings of the National Academy of Sciences of the United States of America. 1993;90(5):1977–1981. doi: 10.1073/pnas.90.5.1977. [DOI] [PMC free article] [PubMed] [Google Scholar]
- Temkin NR, Heaton RK, Grant I, Dikmen SS. Detecting significant change in neuropsychological test performance: a comparison of four models. Journal of the International Neuropsychological Society: JINS. 1999;5(4):357–369. doi: 10.1017/s1355617799544068. [DOI] [PubMed] [Google Scholar]
- Zehnder AE, Bläsi S, Berres M, Monsch AU, Stähelin HB, Spiegel R. Impact of APOE status on cognitive maintenance in healthy elderly persons. International Journal of Geriatric Psychiatry. 2009;24(2):132–141. doi: 10.1002/gps.2080. [DOI] [PubMed] [Google Scholar]