Abstract
Preparation of porcelain restorations that match the natural dentition has been a subject of great concern for many years. An understanding of the process by which the colour and translucency of fixed restorations are planned and obtained so as to replicate the colour of its adjacent teeth is important for achieving an esthetic restoration. This study was done to study the effect of fabrication procedures such as ceramic thickness and number of firing cycles on the colour of metal ceramic restorations. Metal ceramic samples with three different ceramic thicknesses; 0.5, 1 and 1.5 mm (N = 30, n = 10 per group) were fabricated. A3 shade of [VMK 95, VITA Zahnfabrik, Bad Sackingen, Germany] ceramic was used for the fabrication of samples. Samples were subject to multiple firing cycles and colour was measured after 2nd, 3rd, 4th, 6th, 8th and 10th firing cycle. Colour measurement was done objectively using spectrolino (Gretag Macbeth Inc., Germany) spectrophotometer. ‘Repeated measures ANOVA’ test was used for doing statistical analysis. No significant change was noticed in any of the four colour parameters between the baseline reading after second firing uptil the tenth firing for any of the three groups with different ceramic thicknesses. There was a consistent rise in L* or lightness of colour as the thickness of ceramic increased. Between group I and group III there was a consistent shift of a* axis towards the blue green side and there was a consistent shift in b* axis towards purple–blue with an increase in ceramic thickness. It was observed that there was a change in ΔE with a change in ceramic thickness. There was a change of about two units between group I and group II and a change of about one unit between group II and group III. Change in ΔE between group I and group III was the most significant, being about three units. It was concluded from the study that multiple firing cycles during fabrication of metal ceramic restorations do not have any effect on colour while colour varies with change in ceramic thickness.
Keywords: Metal ceramic restorations, Multiple firings, Colour, Ceramic thickness
Introduction
Dental esthetics is intangible, influenced by the wishes of the patient, experience of the clinician and the artistic and technical skills of the ceramist. It lies in the murky twilight between art and science. Art is not enough to create life like restorations, while science alone is inadequate for pleasing results.
In the patient’s perception of dental attractiveness one of the most important considerations in judging the finished restoration is the shade of the restoration [1]. Patient satisfaction with shade match and reproduction is important when constructing or replacing a restoration and the subject matter has always been a dilemma even for the most eminent practitioner.
Fabricating restorations of shades compatible with those of the adjacent teeth has two aspects to it i.e. shade matching and shade duplication. Despite careful shade selection color of the restoration may be affected by fabrication procedures.
Though there is appreciable amount of literature available on matching shade tabs with adjacent teeth [2–6], the dental profession has long been confronted with the problem of replicating the matched colour.
Preparation of porcelain restorations that match the natural dentition has been a subject of great concern for many years. An understanding of the process by which the colour and translucency of fixed restorations are planned and obtained so as to replicate the colour of its adjacent teeth is important for achieving an esthetic restoration. Errors, especially in the colour replication process, have been a problem for dentists and technicians and may lead to dissatisfaction of the patient [7].
Visually detectable differences between colour of shade tab and fired porcelain are not uncommon. An understanding of the science of colour, colour perception and replication is crucial for success in the ever expanding field of esthetic restorative dentistry. This investigation aimed at studying the effect of repeated firing cycles and thickness of ceramic on the colour of metal ceramic restorations.
Materials and Methods
The samples used in this investigation were in the form of flat discs. Each sample had a flat cylindrical metal base, over which porcelain was baked. A total of 30 samples were made which were divided into three groups of ten samples each.
There were two aspects to the fabrication of samples for colour measurement i.e. fabrication of metal discs and firing of porcelain of three different thicknesses.
A ring of 3.5 mm diameter was cut out from a Delrin plastic syringe which served as a mold for fabricating 30 discs of equal thickness using inlay wax (Fig. 1 mould for fabricating wax discs). All the discs were sprued in a conventional manner and invested in a phosphate bonded investment material (Bellasum, Bego) (Fig. 2 wax samples fabricated for casting). Lost wax technique was followed and the samples were cast into nickel chromium discs using a centrifugal casting machine. After casting, discs were devested and sandblasted with 110 micron alumina and were finished and polished in a usual manner.
Fig. 1.
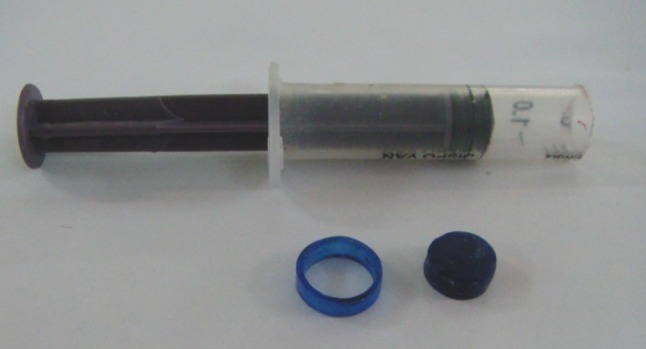
Mould for fabricating wax discs
Fig. 2.
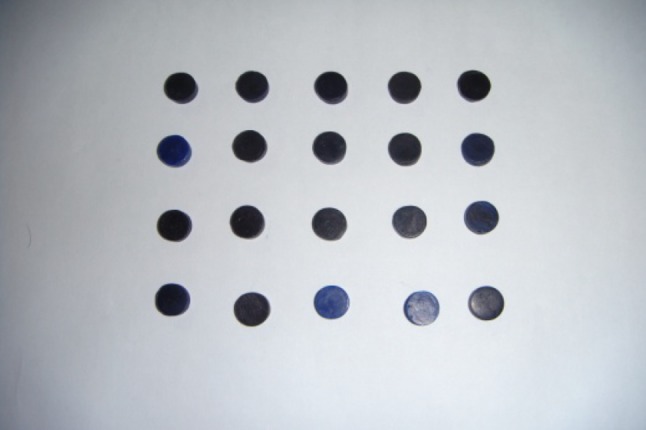
Wax samples fabricated for casting
Porcelain Build Up
Metal discs thus fabricated were degassed in a furnace at a temperature of 920 degree Celsius. Wash opaque powder and liquid ([VMK 95, VITA Zahnfabrik, Bad Sackingen, Germany] was measured and a uniform layer was applied on all the samples using a single stroke of brush. Wash opaque hence applied was fired.
Opaque ceramic (A3 shade) [VMK 95, VITA Zahnfabrik, Bad Sackingen, Germany] was also measured and a uniform layer was applied on all the samples using single stroke of a brush. All the samples were fired.
After this stage samples were divided into three groups of 10 samples each to facilitate build up of different thicknesses of dentine ceramic (A3 shade) (VMK 95, VITA Zahnfabrik, Bad Sackingen, Germany):
Group I (0.5 mm dentine ceramic thickness)
Group II (1 mm dentine ceramic thickness)
Group III (1.5 mm dentine ceramic thickness)
Dentine Ceramic Build Up
Molds were fabricated for the build up of 0.5, 1 and 1.5 mm ceramic thickness. Dentine slurry was formed with measured amount of dentine ceramic and modeling liquid and condensed into the moulds previously formed to fabricate ten samples of each thickness.
Metal discs with dentine build up were carefully taken out from their respective moulds.
Dentine hence built up was subjected to a firing cycle uptil temperature of 920 °C. Same firing cycle was used for subjecting the samples to multiple firings to observe any change in colour with repeated firings.
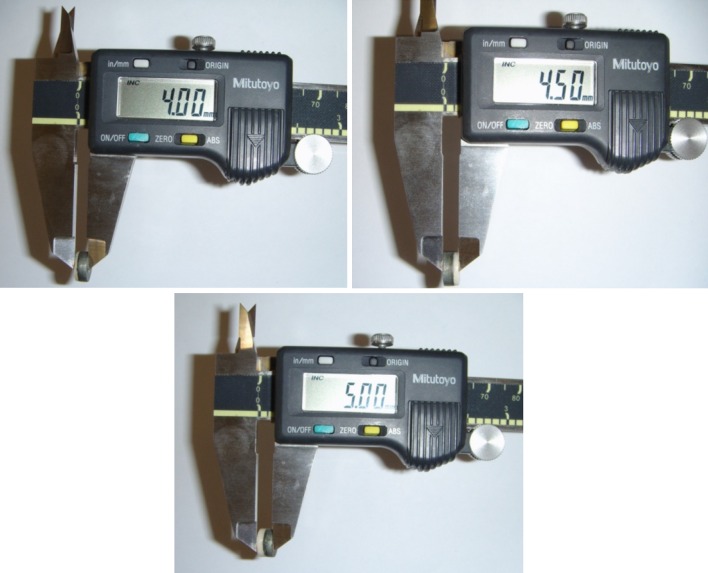
Digital vernier Calliper was used to precisely adjust the thickness of group I samples to 0.5 mm, group II samples to 1 mm and group III samples to 1.5 mm (Fig. 3 digital vernier caliper used to measure thickness of the three groups of samples).
Fig. 3.
Digital vernier caliper used to measure thickness of the three groups of samples
Colour Measurement: Orientation of the Samples for Colour Measurement
Orientation indices were made for all the three groups to precisely place the samples in the same position every time the colour was measured. This ensured recording the same spot on every sample after each firing.
Spectrolino (Gretag MacbethInc., Germany) Spectrophotometer was used to objectively measure the colour of all the samples in terms of CIELAB colour space. This instrument is capable of simulating the same intensity as that of daylight, D50, for every reading that is taken, thereby eliminating the influence of variable external lighting conditions. It also gives a range of observer angles. A standard observer angle of 2° was selected for the entire study (Fig. 4 spectrophotometer used for colour measurement).
Fig. 4.

Spectrophotometer used for colour measurement
Readings were taken after second, third, fourth, sixth, eighth and tenth firing. To take care of human error while taking readings, three readings were taken each time and later a mean of these three readings was calculated for statistical evaluation using the ‘Repeated Measures ANOVA’ test.
Results
Colour of the samples was measured by Spectrolino (Gretag MacbethInc. Germany) Spectrophotometer using CIELAB colour space which measures colour in terms of L*, a*, b* and ∆E co-ordinates. Square root of the sum of squares of L*, a* and b* values gives the value for ∆E.
Tables were formulated for the three groups, representing the change in L*, a*, b* and ∆E co-ordinates of the ten samples of each group with an increase in the number of firing cycles. No significant change was noticed in any of the four colour parameters between the baseline reading after second firing uptil the tenth firing for any of the three groups with different ceramic thicknesses (Tables 1, 2, 3).
Table 1.
Colour variation of group I (0.5 mm) samples after multiple firings
| Firings | L* | a* | b* | ∆E |
|---|---|---|---|---|
| 2 | 70.31 | 1.87 | 14.52 | 18.66 |
| 3 | 70.3 | 1.95 | 14.58 | 19.46 |
| 4 | 70.31 | 1.95 | 14.68 | 19.74 |
| 6 | 70.3 | 1.96 | 14.54 | 19.77 |
| 8 | 70.34 | 1.94 | 14.56 | 19.82 |
| 10 | 70.38 | 1.97 | 14.58 | 19.78 |
Table 2.
Colour variation of group II (1 mm) samples after multiple firings
| Firings | L* | a* | b* | ∆E |
|---|---|---|---|---|
| 2 | 72.78 | 1.56 | 12.74 | 17.23 |
| 3 | 73.13 | 1.4 | 12.49 | 16.89 |
| 4 | 72.82 | 1.15 | 12.66 | 17.1 |
| 6 | 72.85 | 1.53 | 12.69 | 17.55 |
| 8 | 72.83 | 1.76 | 12.78 | 17.86 |
| 10 | 73.98 | 1.28 | 12.73 | 17.69 |
Table 3.
Colour variation of group III (1.5 mm) samples after multiple firings
| Firings | L* | a* | b* | ∆E |
|---|---|---|---|---|
| 2 | 73.81 | 1.7 | 11.85 | 16.4 |
| 3 | 73.84 | 1.58 | 11.81 | 16.3 |
| 4 | 73.21 | 1.53 | 12.01 | 16.74 |
| 6 | 73.84 | 1.42 | 11.96 | 16.87 |
| 8 | 73.96 | 1.18 | 11.82 | 16.72 |
| 10 | 74.18 | 1.26 | 11.88 | 16.59 |
Further analysis was carried out to study the effect of varying ceramic thickness on the four colour parameters for the three groups of 0.5, 1 and 1.5 mm ceramic thicknesses.
Effect of Ceramic Thickness on L* Parameter
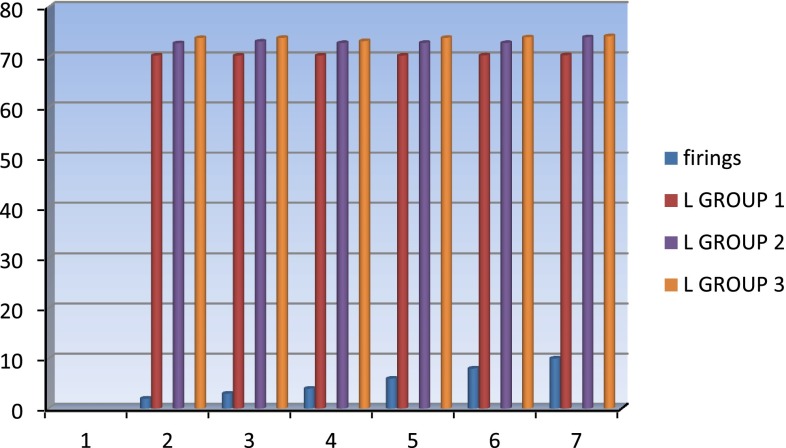
It was observed that there was a consistent rise in L* or lightness of colour as the thickness of ceramic increased. Since L* parameter of none of the groups was affected by increase in number of firing cycles, this increase in L* value between the three groups remained consistent throughout the ten firing cycles. (Table 4; Fig. 5).
Table 4.
Comparison of L* variant amongst the three groups after multiple firings
| Firings | L* Group I | L* Group II | L* Group III |
|---|---|---|---|
| 2 | 70.31 | 72.78 | 73.81 |
| 3 | 70.3 | 73.13 | 73.84 |
| 4 | 70.31 | 72.82 | 73.21 |
| 6 | 70.3 | 72.85 | 73.84 |
| 8 | 70.34 | 72.83 | 73.96 |
| 10 | 70.38 | 73.98 | 74.18 |
Fig. 5.
Comparison of ‘L’ value for the three groups
Effect of Ceramic Thickness on a* Parameter
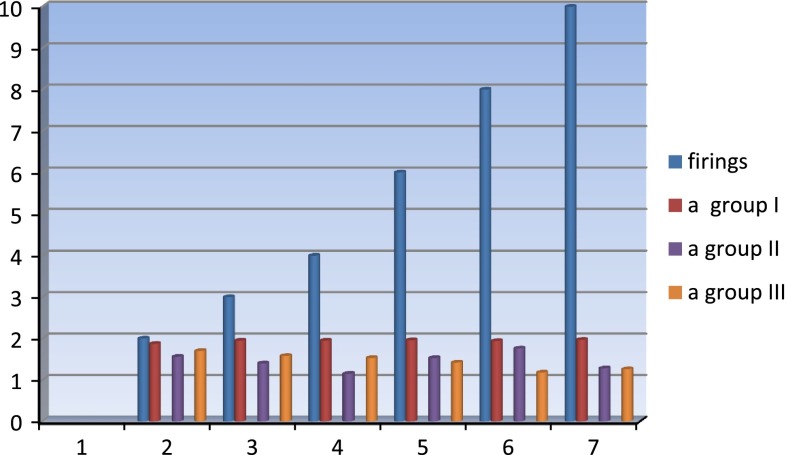
It was observed that between group I and group II colour axis consistently moved towards the blue green side with increase in ceramic thickness though this shift towards blue–green was not very significant. Between group II and III colour axis inconsistently shifted towards either red–purple or the blue–green side. Between group I and group III there was a consistent shift of a* axis towards the blue green side. (Table 5; Fig. 6).
Table 5.
Comparison of a* variant amongst the three groups after multiple firings
| Firings | a* Group I | a* Group II | a* Group III |
|---|---|---|---|
| 2 | 1.87 | 1.56 | 1.7 |
| 3 | 1.95 | 1.4 | 1.58 |
| 4 | 1.95 | 1.15 | 1.53 |
| 6 | 1.96 | 1.53 | 1.42 |
| 8 | 1.94 | 1.76 | 1.18 |
| 10 | 1.97 | 1.28 | 1.26 |
Fig. 6.
Comparison of ‘a’ variant for the three groups
Effect of Ceramic Thickness on b* Parameter
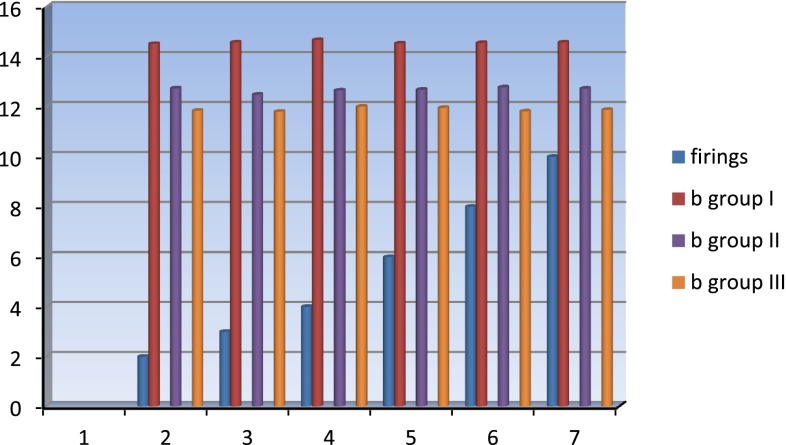
There was a consistent shift in b* axis towards purple- blue with an increase in ceramic thickness. On an average there was a difference of about two units between group I and group II and a difference of about one unit between group II and group III. Difference between the b* co-ordinate of group I and group III was about three units. This difference in b* co-ordinate between the three groups remained consistent through the multiple firing cycles as none of the groups showed any significant change in their b* parameter with multiple firings (Table 6; Fig. 7).
Table 6.
Comparison of b* variant amongst the three groups after multiple firings
| Firings | b* Group I | b* Group II | b* Group III |
|---|---|---|---|
| 2 | 14.52 | 12.74 | 11.85 |
| 3 | 14.58 | 12.49 | 11.81 |
| 4 | 14.68 | 12.66 | 12.01 |
| 6 | 14.54 | 12.69 | 11.96 |
| 8 | 14.56 | 12.78 | 11.82 |
| 10 | 14.58 | 12.73 | 11.88 |
Fig. 7.
Comparison of ‘b’ variant for the three groups
Effect of Ceramic Thickness on ∆E
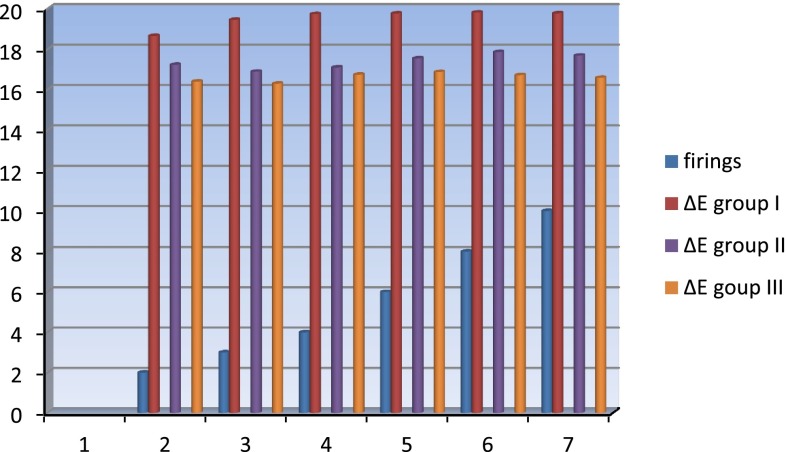
This co-ordinate depicts in nutshell a total change in colour as it involves the change in any of the three parameters. It was observed that there was a change in ∆E with a change in ceramic thickness. There was a change of about two units between group I and group II and a change of about one unit between group II and group III. Change in ∆E between group I and group III was the most significant, being about three units. (Table 7; Fig. 8).
Table 7.
Comparison of ∆E variant amongst the three groups after multiple firings
| Firings | ∆E Group I | ∆E Group II | ∆E Group III |
|---|---|---|---|
| 2 | 18.66 | 17.23 | 16.4 |
| 3 | 19.46 | 16.89 | 16.3 |
| 4 | 19.74 | 17.1 | 16.74 |
| 6 | 19.77 | 17.55 | 16.87 |
| 8 | 19.82 | 17.86 | 16.72 |
| 10 | 19.78 | 17.69 | 16.59 |
Fig. 8.
Comparison of ΔE for the three groups
Discussion
Metal ceramic restorations first became commercially available during the late 1950s [8]. Today this technique is considered a routine procedure in dentistry although it may not fulfill the esthetic requirements especially pertaining to colour in many patients. Despite the ever increasing additions to the list of dental ceramics with improved mechanical and esthetic properties, dentists often face the difficulty of replicating the colour of natural teeth. Many factors such as porcelain brand, amount of tooth reduction, thickness of metal substructure, condensation technique & number of firing cycles might effect the final colour of the restoration. Considering the popularity of metal ceramic restorations in dentistry on account of their affordable cost and esthetic potential, this study was carried out to study the effect of two variables i.e. thickness of dentine ceramic and number of firing cycles on the colour of porcelain fused to metal restorations.
Clinicians and technicians often avoid repeated firing of ceramometal restorations fearing a shift in the colour from that matched with the shade tab. This study was aimed at finding a solution to this dilemma by firing the samples uptil ten firing cycles and measuring the colour change with increase in the number of firing cycles.
The CIELAB colour system is used almost exclusively for colour research in dentistry around the world [9]. It was introduced in 1976 and recommended by the international commission on illumination. The CIELAB color scale is an approximately uniform colour scale. In a uniform colour scale, the differences between points plotted in the colour space correspond to visual differences between the colours. The CIELAB color space is organized in a cube form. The L* axis runs from top to bottom. The maximum for L* is 100, which represents a perfect reflecting diffuser. The minimum for L* is zero which represents black. The a* and b* axes have no specific numerical limits. Positive a* is red and negative a* is green. Positive b* is yellow and negative b* is blue.
Four firings of the samples were selected to represent the typical number of firings used technically to make a ceramometal restoration (two opaque, one boby & one staining & glazing). Subsequently six, eight and ten firings were performed to examine the effect of repeated firings on colour stability. No significant change in colour was there for any ceramic thickness with multiple firings. Results of the study were in accordance with those of [9] who reported that repeated firings up to nine times did not noticeably effect the colour stability of any shade tested.
A significant increase in the L* co-ordinate of CIELAB system was found with an increase in thickness of ceramic. This finding of the study is important and can be interpreted by the fact that with increasing thickness, the value increases as there is a decrease in the lower value effect of the opaque layer and also the effect of porcelain’s translucency increases with an increase in thickness.
Increase in L* co-ordinate is also in accordance with the Lambert’s and Beer’slaws of light and absorption. Lambert’s law states that equal amounts of absorption result when light passes through equal thicknesses of material. Therefore, if the thickness of porcelain increases, more light will be absorbed in the porcelain layer and less in the opaque layer. The result is an increase in value.
Beer’s law states that equal amounts of absorption result when light passes through equal amounts of absorbing material. Thus the increased thickness of porcelain, which means increased units of porcelain colorants will absorb more incident light than thinner layers. This means that less incident light will be absorbed by the opaque layer with increased thickness of porcelain. The resultant effect is an increase in value.
∆E differences among various thicknesses of ceramic were below the perceivable level (∆E < 3). Yap AUJ [10] compared the difference in colour matching between human eye assessment and computerized colorimetry. They reported that the human eye could detect shade changes when ∆E value was greater than three. Hence these results demonstrated that there were visually undetectable colour differences with change in dentine ceramic thickness. Although statistically significant differences were observed in L* a* and b* parameters, the magnitude of mean colour differences caused by various dentine thicknesses were at a clinically acceptable perception level.
Summary
Colour stability is an important factor to ensure the long term clinical success of metal ceramic restorations. Therefore it is important to minimize the factors that influence the processing of the shade of ceramometal restorations.
It is the hope and desire of this study to add to the knowledge of factors effecting colour pertaining to ceramometal restorations and to provide useful guidelines concerning the trends of colour shift. Consistently predictable esthetics and longevity is possible if the factors studied are considered in the fabrication of metal ceramic restorations.
References
- 1.Dunn WJ, Murchinson DF, Broome J. Esthetics-patient’s perception of dental attractiveness. J Prosthodont. 1996;5(3):166–171. doi: 10.1111/j.1532-849X.1996.tb00292.x. [DOI] [PubMed] [Google Scholar]
- 2.Saleski CG. Colour, light & shade matching. J Prosthet Dent. 1972;27:263. doi: 10.1016/0022-3913(72)90033-9. [DOI] [PubMed] [Google Scholar]
- 3.Sproul RC. Colour matching in dentistry, practical applications of the organization of colour. J Prosthet Dent. 1973;29:556. doi: 10.1016/0022-3913(73)90036-X. [DOI] [PubMed] [Google Scholar]
- 4.Okubo SR, et al. Evaluation of visual & instrumental shade matching. J Prosthet Dent. 1998;80:642. doi: 10.1016/S0022-3913(98)70049-6. [DOI] [PubMed] [Google Scholar]
- 5.Wyszecki G, Shees WS. Colour science: concepts and methods, quantitative data and formulae. 2. New York: Wiley; 1982. p. 840. [Google Scholar]
- 6.Preston JD. Light & lighting in the dental office. DCNA. 1978;22:431. [PubMed] [Google Scholar]
- 7.Rosenstiel, Land, Fujimoto . Contemporary fixed prosthodontics. 4. St. Louis: Mosby; 2006. p. 709. [Google Scholar]
- 8.Johnston JE. Porcelain veneers bonded to gold castings. J Prosthet Dent. 1958;8:120. doi: 10.1016/0022-3913(58)90021-0. [DOI] [Google Scholar]
- 9.Seghi RR. Colorimetric analysis of colour difference between porcelain systems. J Prosthet Dent. 1986;56:35. doi: 10.1016/0022-3913(86)90279-9. [DOI] [PubMed] [Google Scholar]
- 10.Yap AUJ, Sim CPC, Loh WL, Teo JH. Human eye versus computerized colour matching. Oper Dent. 1999;24:358–363. [PubMed] [Google Scholar]


