Abstract
Bone height restrictions are more common in the posterior regions of the mandible, because of either bone resorption resulting from tooth loss or even anatomic limitations, such as the position of the inferior alveolar nerve. In situations where adequate bone height is not available in the posterior mandible region, smaller lengths of implants may have to be used but it has been reported that the use of long implants (length ≥10 mm) is a positive factor in osseointegration and authors have reported failures with short implants. Hence knowledge about the stress generated on the bone with different lengths of implants needs scientific evaluation. The purpose of this study was to compare and evaluate the influence of different lengths of implants on stress upon bone in mandibular posterior area. A 3 D finite element model was made of the posterior mandible using the details from a CT scan, using computer software (ANSYS 12). Four simulated implants with lengths 6 mm, 8 mm, 10 mm and 13 mm were placed in the centre of the bone. A static vertical force of 250 N and a static horizontal force of 100 N were applied. The stress generated in the cortical and cancellous bone around the implant were recorded and evaluated with the help of ANSYS. In this study, Von Mises stress on a 6 mm implant under a static vertical load of 250 N appeared to be almost in the same range of 8 and 10 mm implant which were more as compared to 13 mm implant. Von Mises stress on a 6mm implant under a static horizontal load of 100 N appeared to be less when compared to 8, 10 and 13 mm implants. From the results obtained it may be inferred that under static horizontal loading conditions, shorter implants receive lesser load and thus may tend to transfer more stresses to the surrounding bone. While under static vertical loading the shorter implants bear more loads and comparatively transmit lesser load to the surrounding bone.
Keywords: Finite element analysis, Implant length, Posterior mandible
Introduction
Osseointegrated dental implants are considered to be a viable treatment option for restoring partially and completely edentulous jaws [1, 2].
The predictability of implant treatment is supported by many clinical studies reporting survival and success rates higher than 90 % for many implant systems. However, marginal bone loss around implants has also been reported. The occurrence of marginal bone loss is often attributed to poor oral hygiene and biomechanical factors, which may be related mostly to the implant (e.g.: shape, length, diameter, material, surface characteristics) and to the patient (e.g.: bone quality, occlusal force, medical condition) [3].
Since implant length correlates with the area of implant- bone interface, shorter implants could be assumed to generate higher stress in the bone. Although implant loss has rarely been found with implants longer than 13 mm, shorter implants seem to be more often related to implant failure [3].
In general, the use of short implants has not been recommended because it is believed that occlusal forces must be dissipated over a large implant area for the bone to be preserved. A recent clinical study concluded that short implants are possible when the peri-implant tissues are in good condition [4].
To verify the hypothesis that bone stress is influenced by implant length, a finite element analysis was performed to investigate the stress on bone and compare the results of a 6 mm implant model with those of 8, 10 and 13 mm implant models.
Materials and Methods
A three dimensional model of posterior mandibular segment in the molar region with an implant and its abutment was constructed on a personal computer with specification Pentium Dual Core, 500 MB RAM, using a computer software program (ANSYS 12.0) for the following situations:
An implant of 4.3 mm diameter and 6 mm length
An implant of 4.3 mm diameter and 8 mm length
An implant of 4.3 mm diameter and 10 mm length
An implant of 4.3 mm diameter and 13 mm length
Steps involved in the study:
-
I.Finite element modelling
- Construction of geometric model
- Modelling of the bone
- Modelling of the implant with abutment
- Mesh generation
- Specifying materials properties
- Applying boundary conditions
- Application of loads
-
II.Finite element analysis
- Von Mises stress analysis
Model Geometry
A CT scan was used as a reference to model the geometry of posterior mandibular region [5, 6].
The bone encountered in the posterior mandible, classified as Type 2 bone, was described by Lekholm and Zarb [7, 8] as a thick layer of compact bone surrounding a core of dense trabecular bone. The thickness of the cortical bone was kept 2 mm and a uniform layer of cortical bone was modelled on the outer surface of the cancellous core [7, 8].
Implants with similar diameter of 4.3 mm but of different lengths, 6, 8,10 and 13 mm were simulated and made of titanium alloy (Ti-6Al-4 V) were used for this study. The implant was opposed by cortical bone in the crestal region and by cancellous bone for the remainder of the implant bone interface. A simulated abutment of 5 mm height made of the same alloy was also used.
Since the primary goal of this study was not to evaluate stress distribution at the implant- abutment or the abutment- prosthesis interface, the implant abutment complex was modeled as one piece structure and the crown restoration was omitted. The implant abutment complex was placed in the middle of the molar region of the mandible. The platform of the implant was modeled as being flush with the alveolar ridge surface to mimic effectively a real clinical situation [7].
Mesh Generation of the Model
After placement of the implant abutment complex in the bone model, automatic mesh generation was done and the model was divided into large number of elements and nodes. As a general rule, the larger the number of nodes and elements, the more accurate is the finite element solution [9]. The three-dimensional finite element model corresponding to the geometric model was meshed using ANSYS Pre-processor (ANSYS 12.0).
The number of elements and nodes for each model is given in Table 1.
Table 1.
Number of elements and nodes for each model
| Model | Elements | Nodes |
|---|---|---|
| Model 1 | 337,413 | 60,273 |
| Model 2 | 325,651 | 59,876 |
| Model 3 | 318,965 | 57,877 |
| Model 4 | 309,765 | 55,765 |
Specifying Material Properties
For the accurate analysis of the problem and interpretation of the results, two material properties were utilized i.e. Young’s Modulus (elastic modulus) and Poisson’s Ratio. The cortical bone, cancellous bone and implant with abutment were presumed to be linearly elastic, homogenous and isotropic. Although cortical bone has anisotropic material characteristics and possesses regional stiffness variation, they were modelled isotropically due to the unavailability of sufficient data and difficulty in establishing the principle axis of anisotropy. The corresponding elastic properties such as Young’s Modulus and Poisson’s Ratio of cortical bone, cancellous bone and implant were determined according to literature survey [10] (Table 2).
Table 2.
Mechanical properties of different materials used in the model
| Material | Elastic modulus | Poisson’s ratio |
|---|---|---|
| Cortical bone | 13.4 GPa | 0.30 |
| Cancellous bone | 1.37 GPa | 0.31 |
| Titanium alloy | 110 GPa | 0.33 |
Imposing Boundary Conditions
The boundary conditions were applied to have enough fixed nodal displacements to prevent the structure from moving in space as a rigid body when external loads were applied.
Interface Condition
The bone implant interface was assumed to be perfect, simulating complete osseointegration. The implant and abutment were assumed to be connected as a single unit.
Load Application
This is a part of the procedure to simulate actual clinical situation. The lateral force component along the bucco-lingual axis was assumed to be 100 N and the vertical intrusive component was 250 N [5].
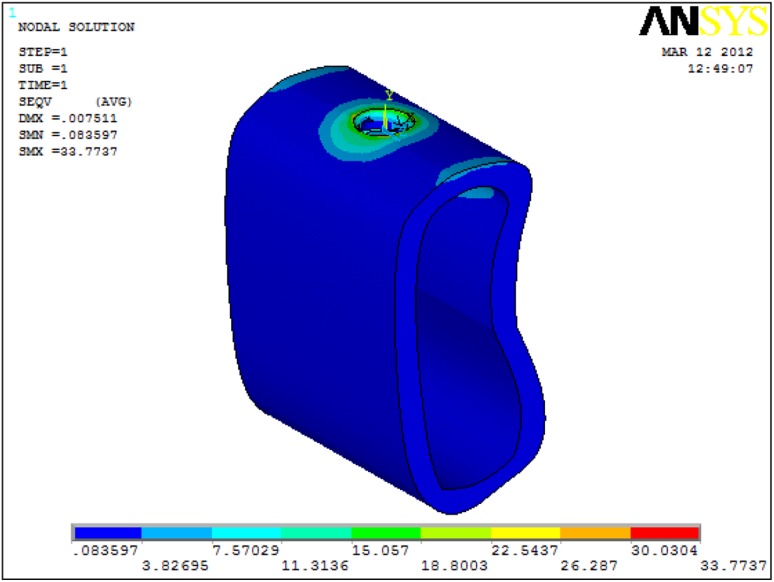
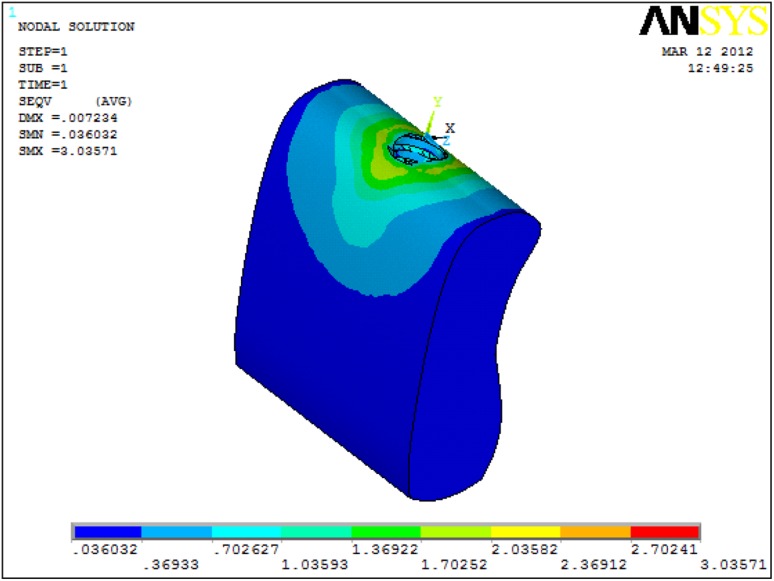
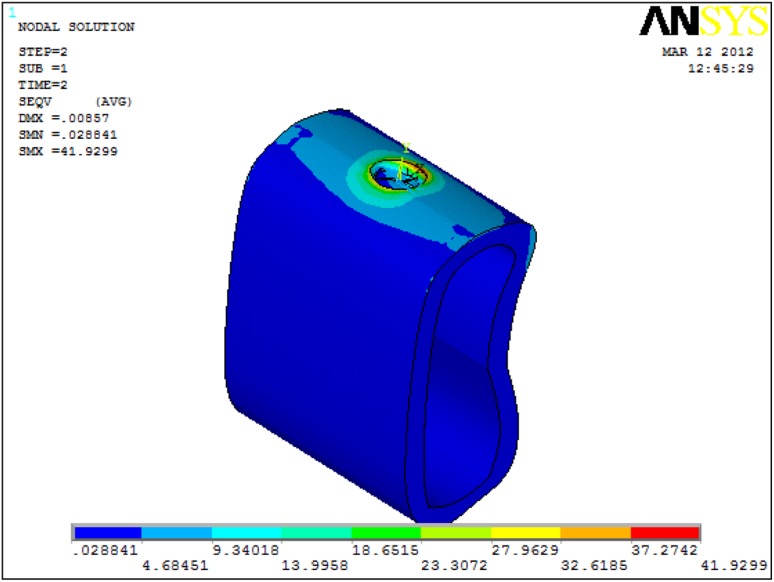
After applying load on each model, a record of the patterns and values of stress developing around the implant in the bone were displayed using different colours (Fig. 1) showing different range of stress in cortical and cancellous bone (Fig. 2).
Fig. 1.
Different colours indicate the amount of stress around the implant region
Fig. 2.
Von Mises stress only in cortical bone with 6 mm Implant under 250 N vertical load
Results
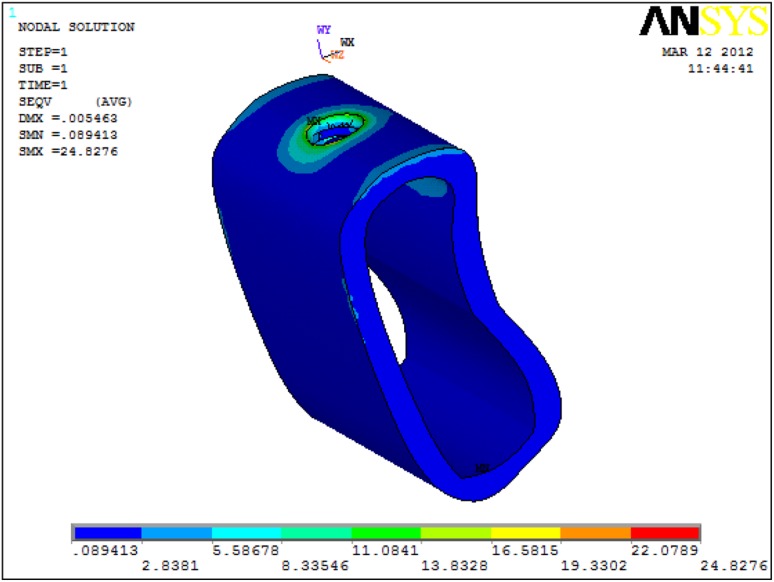
The present study was conducted to analyse the distribution and values of stress in the bone around an implant placed in posterior mandible using different implant lengths. Stress was calculated using Von Mises criteria, which represented the distribution of stress in colour-coded figures (Fig. 3).
Fig. 3.
Von Mises stress only in cortical bone with 13 mm Implant under 250 N vertical load
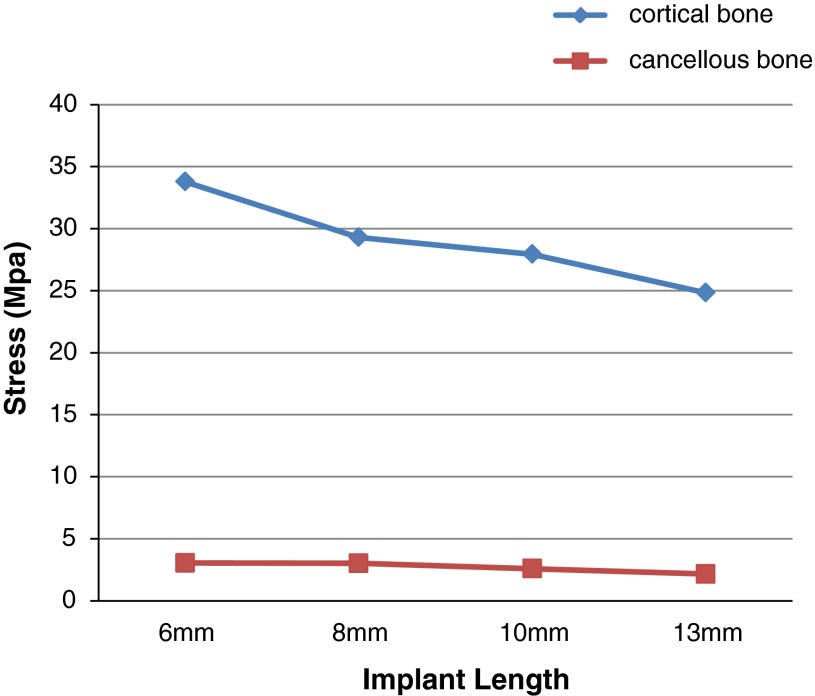
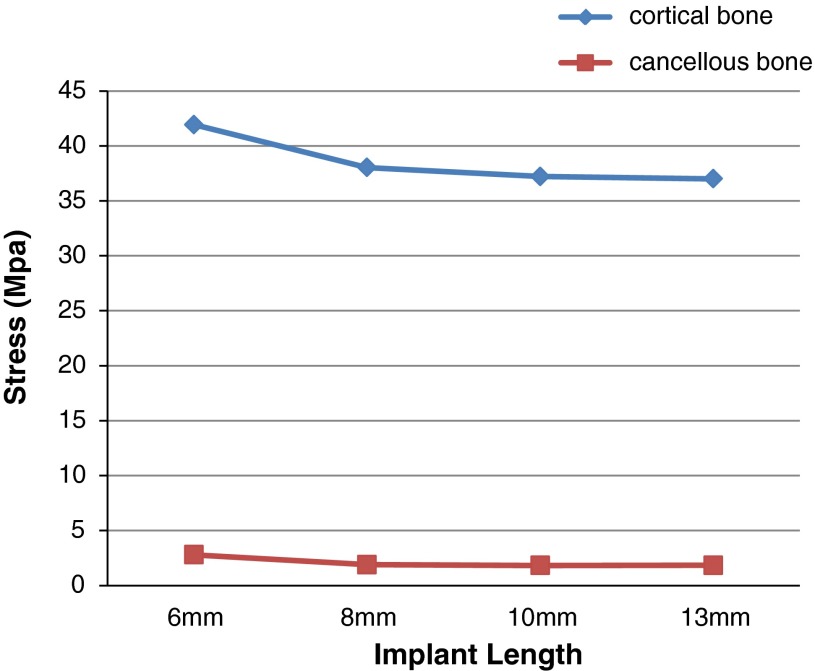
Table 3 and Graph 1 shows stress distribution in cortical and cancellous bone around four different lengths of implants i.e 6, 8, 10 and 13 mm implants under 250 N vertical load. Table 4 and Graph 2 shows stress distribution in cortical and cancellous bone around four different lengths of implants i.e. 6, 8, 10 and 13 mm implants under 100 N horizontal load (Fig. 4).
Table 3.
Von Mises stresses in cortical and cancellous bone under 250 N load
| Implant length | Cortical bone | Cancellous bone |
|---|---|---|
| 6 mm | 33.7737 | 3.03571 |
| 8 mm | 29.2947 | 3.01212 |
| 10 mm | 27.9385 | 2.5869 |
| 13 mm | 24.8276 | 2.15062 |
Graph 1.
Von Mises stress on cortical and cancellous bone under 250 N vertical load
Table 4.
Von Mises stresses in cortical and cancellous bone under 100 N load
| Implant length | Cortical bone | Cancellous bone |
|---|---|---|
| 6 mm | 41.9299 | 2.80048 |
| 8 mm | 38.0361 | 1.8968 |
| 10 mm | 37.2119 | 1.83095 |
| 13 mm | 37.002 | 1.8413 |
Graph 2.
Von Mises stress on cortical and cancellous bone under 100 N horizontal load
Fig. 4.
Von Mises stress only in cancellous bone with 6 mm Implant under 250 N vertical load
Stress Distribution
Maximum Von Mises stress appeared to be located in the cortical bone under 250 N vertical and 100 N horizontal loads when 6 mm long implant was used (Fig. 5).
Fig. 5.
Von Mises stress only in cancellous bone with 13 mm Implant under 250 N vertical load
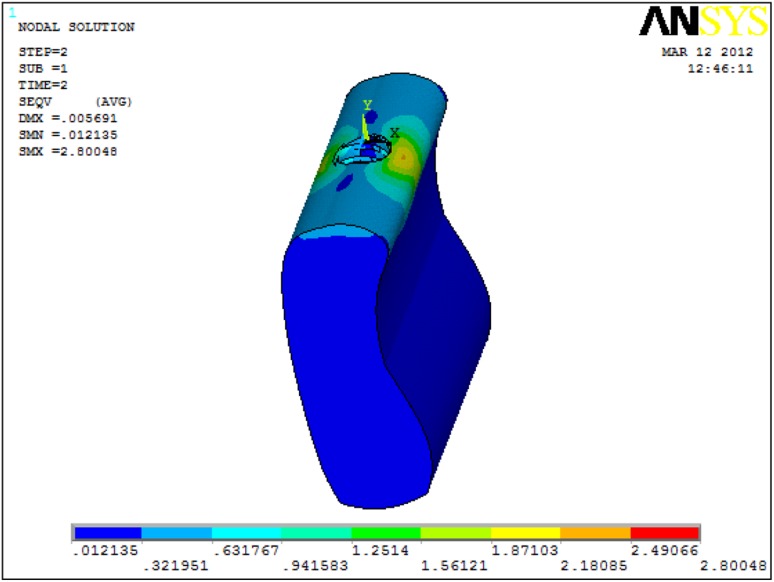
As the implant length decreased from 13 mm to 6 mm, the stress increased in both cortical and cancellous bone with 250 N vertical and 100 N horizontal loads. The maximum and minimum stress in the cortical bone was 33.77 MPa (6 mm implant) and 24.83 (13 mm implant) respectively under 250 N vertical load. The maximum and minimum stress in the cancellous bone was 3.04 MPa (6 mm implant) and 2.15 MPa (13 mm implant) respectively under 250 N vertical loads. The maximum and minimum stress in the cortical bone was 41.93 MPa (6 mm implant) and 37.00 MPa (13 mm implant) respectively under 100 N horizontal loads. The maximum and minimum stress in the cancellous bone was 2.80 MPa (6 mm implant) and 1.83 MPa (10 mm implant) respectively under 100 N horizontal loads (Fig. 6).
Fig. 6.
Von Mises stress only in cortical bone with 6 mm Implant under 100 N horizontal load
Discussion
The success rate for dental implants suggests that tissues are capable of sustaining a long term positive response to implant loading. This implies that bony architectural strength and the direction in which stresses are transferred to the surrounding bone are typically favourable as regards to bone survival and implant stability [11] (Fig. 7).
Fig. 7.
Von Mises stress only in cortical bone with 13 mm Implant under 100 N horizontal load
Load transfer from implants to surrounding bone depends on the type of loading, the bone–implant interface, the diameter and length of the implants, the shape and characteristics of the implant surface, the prosthesis type, and the quantity and quality of the surrounding bone [12] (Fig. 8).
Fig. 8.
Von Mises stress only in cancellous bone with 6 mm Implant under 100 N horizontal load
Several investigators have attempted to minimize crestal bone loss by increasing the contact area of bone–implant interface and therefore reducing stress at the cortical alveolar crest. Attempts to increase the contact area of bone–implant interface have focused on increasing the diameter and/or the length of the implant, or altering the implant design/shape [13, 14, 20] (Fig. 9).
Fig. 9.
Von Mises stress only in cancellous bone with 13 mm Implant under 100 N horizontal load
Bone height restrictions are more common in the posterior regions of the mandible, because of either bone resorption resulting from tooth loss or even anatomic limitations, such as the position of the inferior alveolar nerve [15].
In cases of reduced alveolar bone height, implants of short length (10 mm or less) may be employed although there is a perceived risk that because of their small stature they will be unable to tolerate occlusal loads and will fail to osseointegrate. This concern is based on the premise that occlusal forces are best dissipated over a large implant area to preserve alveolar bone [16].
A study that reviewed finite element modeling analysis showed, however, that the use of short-length implants might be efficacious because occlusal forces are transferred primarily to crestal bone. If these occlusal forces transmitted to the bone are within the physiologic limits, then short-length implants are not at risk as routinely perceived [17].
As the length of the implant increases, the surface area increases. It has been suggested that the stress levels for a given applied load is reduced on longer implants because of greater surface area. This also improves the mechanical resistance to masticatory forces. The implant length depends entirely upon the amount of available bones [18].
The relationship between implant length and survival, however, is limited [10, 19]. These studies indicated that the use of longer implants did not necessarily relieve the stress concentration in the bone around the implants.
In the present study, the bone implant interface was assumed to be completely osseointegrated and the bone was modelled as homogenous and isotropic. But varying degree of osseointegration occurs clinically and bone is actually anisotropic [14, 20]. Higher stress can be observed with decrease in the percentage of osseointegration. The stress/strain patterns differ if there is no complete osseointegration between the bone and implant [14]. Also gingival soft tissues were not modelled.
In finite element models, bone is frequently modeled as isotropic when in fact it is anisotropic. The assignment of proper material properties to a finite element model is a necessary step to ensure predictive accuracy [21].
To ensure that implant and abutment did not separate upon the application of force, the two were connected physically and modeled as a single unit.
The results of this study show that maximum Von Mises stress appeared to be located in the cortical bone under 250 N vertical and 100 N horizontal loads when 6 mm long implant was used and also as the implant length decreased from 13 mm to 6 mm, the stress increased in both cortical and cancellous bone with 250 N vertical and 100 N horizontal loads.
In a study [22] it was stated that length favoured stress distribution more than diameter in both the jaw bones under an axial load, thus, under axial load, the maximum equivalent stresses in cortical and cancellous bones decreased with an increase in length in type 2 bone. Length significantly increased the implant stability of an axial load, while diameter enhanced that of the buccolingual load. Diameter exceeding 4.0 mm and length over 11 mm are the best combination for optimal biomechanical properties in immediate loading implants in the type B/2 bone.
Increased implant length results in stress reduction on the implant in both immediate and delayed loading. For a given implant length, the stresses are lower after the phase of osseointegration [23].
Finite Element Analysis has been used extensively in the prediction of biomechanical performance of dental implant systems. Assumptions made in the use of Finite Element Method in implant dentistry should be more accurate. To achieve more realistic situation, advanced digital imaging techniques can be used to model bone geometry in greater detail; the anisotropic and non- homogenous nature of the material needs to be considered; and applied boundary conditions must be refined. In addition, modelling of bone- implant interface should incorporate the actual osseointegration contact area in cortical bone as well as the detailed 3-dimensional trabecular bone contact pattern.
Conclusion
Within the limitations of the methodology that considered the bone homogenous and isotropic, the results of static load and linear analysis support the following conclusion:
Von Mises stress on a 6 mm implant under a static vertical load of 250 N appeared to be almost in the same range of 8 and 10 mm implant which were more as compared to 13 mm implant. From this we may infer that under vertical forces short implants receive more stress thus transferring lesser stresses to the surrounding bone.
Von Mises stress on a 6 mm implant under a static horizontal load of 100 N appeared to be less when compared to 8, 10 and 13 mm implants. From this we may infer that under horizontal load short implants receive lesser stress, thus transferring more stress to the surrounding bone.
Clinical Significance
A well-planned and well-executed prosthesis is essential to avoid excessive and unnecessary forces on bone and implant components. Predicting how bone and implant components would behave, considering each patient’s unique jaw anatomy, quality of bone, and amount of occlusal force exerted on the prosthesis, demands full comprehension of both mechanical and biologic events.
Finite Element Analysis has been used extensively in the prediction of biomechanical performance of dental implant systems.
Thus, the results obtained from this study can be used to predict the outcomes in the clinical situations and help us to achieve a successful prognosis. Short implants can be successfully placed in atrophied mandibles-where bone height is less. But, it needs to be proven clinically on a long term basis.
Limitations of Finite Element Method
Even though Finite Element Method is an accurate and precise method for analysing structures, the present study had certain limitations:
Firstly no movement was allowed between the implant and the bone during loading from different directions which may not represent a real clinical situation.
The implant was also assumed to be 100 % osseointegrated, which is never found in clinical situation. This would alter forces transmitted to the supporting structures.
Next, the cortical bone, cancellous bone and the implant were considered to be isotropic and homogenous. The bone in reality is anisotropic and inhomogeneous.
The static loads that were applied differed from the dynamic loading encountered during function.
The loads were applied only at point locations.
The implant-abutment complex was considered as one unit.
The duration of force applied was very less and this differs from the duration of loads the implants are subjected to in the oral cavity.
References
- 1.Papavasiliou G, Kamposiora P, Bayne SC, Felton DA. Three dimensional finite element analysis of stress distribution around single tooth implants as a function of bony support, prosthesis type, and loading during function. J Prosthet Dent. 1996;76:633–640. doi: 10.1016/S0022-3913(96)90442-4. [DOI] [PubMed] [Google Scholar]
- 2.Chang SH, Lin CL, Chang WJ, Kuo YC. Factorial analysis of variables influencing mechanical characteristics of a single tooth implant placed in the maxilla using finite element analysis and the statistics based Taguchi method. Eur J Oral Sci. 2007;115:408–416. doi: 10.1111/j.1600-0722.2007.00473.x. [DOI] [PubMed] [Google Scholar]
- 3.Tada S, Stegaroiu R, Kitamura E, Miyakawa O, Kusakari H. Influence of implant design and bone quality on stress/ strain distribution in bone around implants: a 3-dimensional finite element analysis. Int J Oral Maxillofac Implants. 2003;18:357–368. [PubMed] [Google Scholar]
- 4.Geng JP, Tan KB, Liu GR. Application of finite element analysis in implant dentistry: a review of literature. J Prosthet Dent. 2001;85:585–598. doi: 10.1067/mpr.2001.115251. [DOI] [PubMed] [Google Scholar]
- 5.Baggi L, Cappelloni I, Di Girolamo M, Maceri F, Vairo G. The influence of implant diameter and length on stress distribution of osseointegrated implants related to crestal bone geometry: a three-dimensional finite element analysis. J Prosthetic Dent. 2008;100(6):422–431. doi: 10.1016/S0022-3913(08)60259-0. [DOI] [PubMed] [Google Scholar]
- 6.Li T, Kong L, Wang Y, Hu K, Song L, Liu B, Li D, Shao J, Ding Y. Selection of optimal dental implant diameter and length in type IV bone: a three-dimensional finite element analysis. Int J Oral Maxillofacial Surg. 2009;38(10):1077–1083. doi: 10.1016/j.ijom.2009.07.001. [DOI] [PubMed] [Google Scholar]
- 7.Norton MR, Gamble C. Bone classification: an objective scale of bone density using the computerized tomography scan. Clin Oral Imp Res. 2001;12:79–84. doi: 10.1034/j.1600-0501.2001.012001079.x. [DOI] [PubMed] [Google Scholar]
- 8.Katranji A, Misch K, Wang HL. Cortical bone thickness in dentate and edentulous human cadavers. J Periodontol. 2007;78:874–878. doi: 10.1902/jop.2007.060342. [DOI] [PubMed] [Google Scholar]
- 9.Van Zyl Paul P, Grundling NL, Jooste CH, Terblanche E. Three dimensional finite element model of a human mandible incorporating six osseointegrated implants for stress analysis of mandibular cantilever prosthesis. Int J Oral Maxillofac Implants. 1995;10:51–57. [PubMed] [Google Scholar]
- 10.Meijer HJA, Kuiper JH, Starmans FJM, Bosman F. Stress distribution around dental implants: influence of superstructure, length of implants, and height of mandible. J Prosthet Dent. 1992;68:96–102. doi: 10.1016/0022-3913(92)90293-J. [DOI] [PubMed] [Google Scholar]
- 11.Hsu ML, Ching Chen F, Kao HC, Kung Cheng C. Influence of off axis loading of an anterior maxillary implant. A 3-dimensional finite element analysis. Int J Oral Maxillofac Implants. 2000;15:819–823. [PubMed] [Google Scholar]
- 12.Ding X, Liao SH, Zhu XH, Zhang XH, Zhang L. Effect of diameter and length on stress distribution of the alveolar crest around immediate loading implants. Clin Implant Dent Relat Res. 2009;11(4):279–287. doi: 10.1111/j.1708-8208.2008.00124.x. [DOI] [PubMed] [Google Scholar]
- 13.Holmgren EP, Seckinger RJ, Kilgren LM, Mante F. Evaluating parameters of osseointegrated dental implants using finite element analysis–a two-dimensional comparative study examining the effects of implant diameter, implant shape, and load direction. J Oral Implantol. 1998;24(2):80–88. doi: 10.1563/1548-1336(1998)024<0080:EPOODI>2.3.CO;2. [DOI] [PubMed] [Google Scholar]
- 14.Chun H.J et al (2002) Evaluation of design parameters of osseointegrated dental implants using finite element analysis. J Oral Rehab 29:565–574 [DOI] [PubMed]
- 15.Starr NL. The distal extension case: an alternative restorative design for implant prosthetics. Int J Periodontics Restorative Dent. 2001;21(1):61–67. [PubMed] [Google Scholar]
- 16.Sylvan F, Nicolas B, Dietmar W, Sean SK, Rene´e MS. Five- year survival distribution of short- length (10 mm or less) machined surface or Osteotite implants. Clin Implant Dent Rel Res. 2004;6(1):16–23. doi: 10.1111/j.1708-8208.2004.tb00023.x. [DOI] [PubMed] [Google Scholar]
- 17.Lum LB. A biomechanical rationale for the use of short implants. J Oral Implantol. 1991;17:126–131. [PubMed] [Google Scholar]
- 18.Hoon LJ, Frias V, Woo LK, Wright RF. Effect of implant size and shape on implant success rates: a literature review. J Prosthet Dent. 2005;94:377–381. doi: 10.1016/j.prosdent.2005.04.018. [DOI] [PubMed] [Google Scholar]
- 19.Akca K, Iplikcioglu H. Comparative evaluation of the effect of diameter, length and number of implants supporting three unit fixed prosthesis on stress distribution in the bone. J Dent. 2002;30:41–46. doi: 10.1016/S0300-5712(01)00057-4. [DOI] [PubMed] [Google Scholar]
- 20.Geramy A, Morgano SM. Finite element analysis of three designs of an implant supported molar crown. J Prosthet Dent. 2004;92:434–440. doi: 10.1016/j.prosdent.2004.08.011. [DOI] [PubMed] [Google Scholar]
- 21.O’ Mahony AM, Williams JL, Spencer P. Anisotropic elasticity of cortical and cancellous bone in the posterior mandible increases periimplant stress and strain under oblique loading. Cin Oral Imp Res. 2001;12:648–657. doi: 10.1034/j.1600-0501.2001.120614.x. [DOI] [PubMed] [Google Scholar]
- 22.Kong L, Li T, Wu J, Hu K, Liu Y, Zhou H, Liu B. Biomechanical optimization of implant diameter and length for immediate loading: a nonlinear finite element analysis. Int J Prosthodont. 2009;22:607–615. [PubMed] [Google Scholar]
- 23.Georgiopoulos B, Kalioras K, Provatidis C, Manda M, Koidis P. The effects of implant length and diameter prior to and after osseointegration: a 2-D finite element analysis. J Oral Implantol. 2007;33(5):243–256. doi: 10.1563/1548-1336(2007)33[243:TEOILA]2.0.CO;2. [DOI] [PubMed] [Google Scholar]


