

ABSTRACT
Perturbations to the gut microbiota can result in a loss of colonization resistance against gastrointestinal pathogens such as Clostridium difficile. Although C. difficile infection is commonly associated with antibiotic use, the precise alterations to the microbiota associated with this loss in function are unknown. We used a variety of antibiotic perturbations to generate a diverse array of gut microbiota structures, which were then challenged with C. difficile spores. Across these treatments we observed that C. difficile resistance was never attributable to a single organism, but rather it was the result of multiple microbiota members interacting in a context-dependent manner. Using relative abundance data, we built a machine learning regression model to predict the levels of C. difficile that were found 24 h after challenging the perturbed communities. This model was able to explain 77.2% of the variation in the observed number of C. difficile per gram of feces. This model revealed important bacterial populations within the microbiota, which correlation analysis alone did not detect. Specifically, we observed that populations associated with the Porphyromonadaceae, Lachnospiraceae, Lactobacillus, and Alistipes were protective and populations associated with Escherichia and Streptococcus were associated with high levels of colonization. In addition, a population affiliated with the Akkermansia indicated a strong context dependency on other members of the microbiota. Together, these results indicate that individual bacterial populations do not drive colonization resistance to C. difficile. Rather, multiple diverse assemblages act in concert to mediate colonization resistance.
IMPORTANCE
The gastrointestinal tract harbors a complex community of bacteria, known as the microbiota, which plays an integral role preventing its colonization by gut pathogens. This resistance has been shown to be crucial for protection against Clostridium difficile infections (CDI), which are the leading source of hospital-acquired infections in the United States. Antibiotics are a major risk factor for acquiring CDI due to their effect on the normal structure of the indigenous gut microbiota. We found that diverse antibiotic perturbations gave rise to altered communities that varied in their susceptibility to C. difficile colonization. We found that multiple coexisting populations, not one specific population of bacteria, conferred resistance. By understanding the relationships between C. difficile and members of the microbiota, it will be possible to better manage this important infection.
INTRODUCTION
The microbiota, or the diverse community of microorganisms living in and on the body, has an integral role in deterring pathogen colonization and infection (1). This native protection by the microbiota from invasive pathogenic species is termed colonization resistance. It is well established that the gut bacterial microbiota is critical in the host’s defense against the pathogen Clostridium difficile (2–4). Perturbations to this indigenous community often lead to a loss of resistance. This is especially important in many hospital settings where patients are not only exposed to various types and degrees of perturbations, such as antibiotics, diet changes, and chemotherapy, but they are also exposed to C. difficile spores from their environment (5). C. difficile infections (CDI) are the most reported hospital-acquired infection in the United States and are responsible for 14,000 deaths a year (6).
It is not completely understood how different perturbations to the gut microbiota result in a loss of colonization resistance to C. difficile. There is a clear need to better understand the ecology of C. difficile and its interactions with members of the microbiota. In mouse models of CDI, the unperturbed, untreated murine microbiome is completely resistant to C. difficile colonization. It was previously shown that C57BL/6 mice treated with cefoperazone (3, 7), tigecycline (8), clindamycin (9), or clindamycin in combination with a five-antibiotic cocktail (2) had decreased colonization resistance. These studies suggest that a loss of Lachnospiraceae and Barnesiella and a bloom of Lactobacillaceae and Enterobacteriaceae are responsible for the loss of colonization resistance. These results are largely supported by human association studies (10, 11). We previously observed significant differences between the gut microbiota of hospitalized individuals with and without C. difficile and nonhospitalized controls (10). In addition, fecal microbiota transplants have been shown to increase the relative abundance of Bacteroidetes and decrease the relative abundance of Proteobacteria and result in a successful restoration of colonization resistance in patients (12). The mechanisms involved in restoring colonization resistance are not fully understood, but this treatment emphasizes the importance of the overall gut microbiota in protecting against C. difficile.
Because the gut microbiota is a complex community, we need tools that enable us to dissect the interactions within the community and with C. difficile. One approach is the use of mathematical models to identify associations between members of the microbiota and C. difficile. Mathematical models have been used to predict C. difficile (10, 13) and Citrobacter infection (14), colon cancer (15), and psoriasis (16) based on the composition of the gut microbiota. We similarly sought to identify the subset of the normal murine microbiota that is responsible for colonization resistance by using mathematical models to explain the relationship between members of the gut microbiota.
The purpose of this investigation was to expand our current knowledge of the effects of various perturbations on colonization resistance against C. difficile. Through the administration of different antibiotic classes, doses, and recovery times, we altered the murine gut microbiota and challenged the communities with C. difficile spores to quantify differences in colonization resistance. We then used 16S rRNA gene sequencing to identify structural changes within the microbiota that would be predictive of colonization resistance. Using these data, we built a random forest regression model to predict C. difficile colonization levels. Through this analysis, we have identified groups of related bacteria that are associated with C. difficile colonization resistance. This model revealed that the interactions giving rise to colonization resistance were nonlinear and context dependent. These findings show that we can successfully apply modeling techniques to accurately predict the colonization resistance of a given microbiota.
RESULTS
Antibiotics differentially alter the structure of the microbiota and their colonization resistance to C. difficile.
We selected a panel of seven antibiotics from six classes with the goal of differentially altering the microbiota and assessing their resistance to C. difficile colonization (Table 1). Following the cessation of antibiotics, each treatment group was given 1 day of recovery prior to challenge with C. difficile spores. One day after challenge, we determined the density of C. difficile in the animals’ feces. We observed reproducibly high levels of C. difficile colonization in mice treated with cefoperazone, metronidazole, and streptomycin (Fig. 1; see Fig. S1 in the supplemental material). We observed the most variation in the levels of C. difficile colonization in mice treated with ampicillin. None of the mice that received ciprofloxacin were colonized. In addition to administering ciprofloxacin by oral gavage, we provided ciprofloxacin by intraperitoneal injection (10 mg/ml). For both approaches, we provided 1 or 2 days of recovery from the antibiotic treatment. Regardless of the method, the resulting communities were resistant to C. difficile colonization. Only one of six mice receiving vancomycin was colonized with C. difficile. We suspected that this was due to residual vancomycin repressing C. difficile growth. In fact, 2 days after C. difficile challenge, C. difficile bloomed in this treatment group to a median of 9.1 × 10⁷ (interquartile range, 7.6 × 10⁷ to 1.1 × 10⁸) CFU/g feces. Furthermore, given 2 days of recovery after vancomycin treatment, there was no delay in C. difficile colonization to high levels, and on day 1 postchallenge, we observed a median of 3.0 × 10⁷ (interquartile range, 2.6 × 10⁷ to 3.6 × 10⁷ [n = 4]) CFU/g feces. These results suggest that although the gut tissue does not absorb vancomycin, the absence of C. difficile in the remaining five vancomycin-treated mice may have been due to residual antibiotics lingering in the environment. Overall, these antibiotic perturbations provided different levels of colonization by C. difficile, which led us to hypothesize that the resulting communities varied in their composition.
Table 1 .
Description of antibiotics used in this study
| Antibiotic | Administration | Class | Mechanism | Target |
|---|---|---|---|---|
| Ampicillin | Ad libitum in drinking water, 5 days | β-Lactam, penicillin | Inhibits peptidoglycan synthesis | Gram-positive or -negative bacteria |
| Cefoperazone | Ad libitum in drinking water, 5 days | β-Lactam, cephalosporin | Inhibits peptidoglycan synthesis | Gram-positive or -negative bacteria |
| Ciprofloxacin | Oral gavage, one time | Fluoroquinolone | Inhibits DNA gyrase | Gram-positive or -negative bacteria |
| Clindamycin | Intraperitoneal injection, one time | Lincosamide | Inhibits protein synthesis | Anaerobes |
| Metronidazole | Ad libitum in drinking water, 5 days | Nitromidazole | Destabilizes bacterial DNA | Anaerobes |
| Streptomycin | Ad libitum in drinking water, 5 days | Aminoglycoside | Inhibits protein synthesis | Gram-positive or -negative bacteria |
| Vancomycin | Ad libitum in drinking water, 5 days | Glycopeptide | Inhibits peptidoglycan synthesis | Gram-positive bacteria |
FIG 1 .
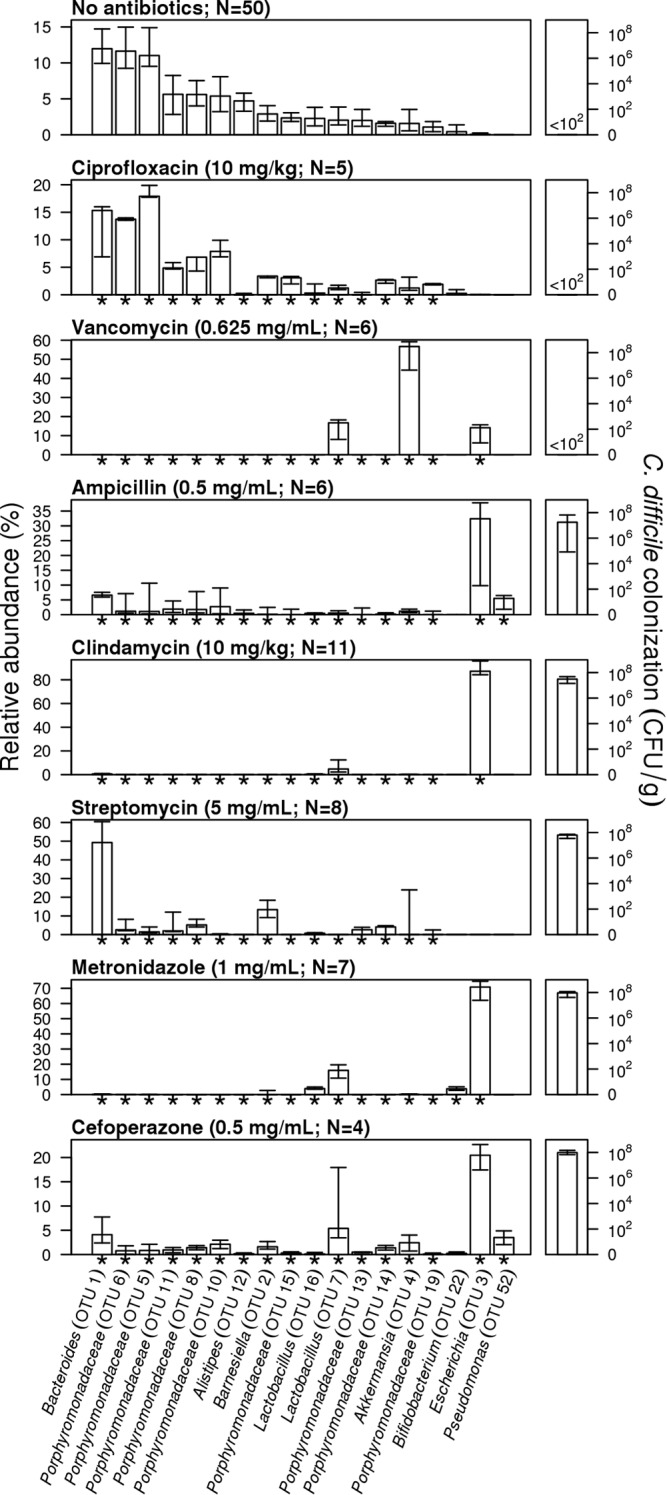
Antibiotic treatments result in significant alterations to the structure of the microbiota and variation in colonization resistance. Bars indicate the median percent relative abundance of those selected OTUs from all treatment groups on the day of C. difficile challenge. Asterisks along the x axis indicate those OTUs that were significantly different from untreated mice for that antibiotic treatment after correcting for multiple comparisons. The error bars indicate the interquartile range. The median level C. difficile colonization found 24 h after microbiota sampling is plotted on the right for each treatment, with error bars indicating the interquartile range. The dose of antibiotic and the number of animals used in each treatment group are indicated for each antibiotic treatment group. The treatment groups are shown in order of the level of C. difficile colonization.
To test this hypothesis, we sequenced the 16S rRNA genes from the fecal communities of treated and untreated mice prior to C. difficile challenge to identify populations within the microbiota that conferred colonization resistance. All of the antibiotic treatments, except for the ciprofloxacin-treated mice (P = 0.09 by analysis of molecular variance [AMOVA]), resulted in distinct and reproducible changes to the structure of the microbiota relative to the untreated animals (P < 0.001 by AMOVA). The similarity in the structure of the microbiota in ciprofloxacin-treated and untreated mice suggests that a higher dose of ciprofloxacin may have been necessary to significantly perturb the microbiota to allow C. difficile to overcome colonization resistance. Comparisons of the microbiota between antibiotic classes indicated that their structures were significantly different from each other (P < 0.03 by AMOVA). The community structures of mice receiving β-lactams (i.e., cefoperazone and ampicillin) were not significantly different from each other (P = 0.37 by AMOVA). These results indicate that perturbing the gut microbiota with antibiotics resulted in nonoverlapping community structures that yielded significant variation in susceptibility to colonization when challenged with C. difficile.
Reduced perturbations result in altered levels of colonization.
On the basis of the C. difficile colonization levels in our seven antibiotic treatments, we hypothesized that titrating the dose of antibiotics that the mice received would result in smaller perturbations to the microbiota. Consequently, we expected a greater maintenance of resistance against C. difficile colonization in these titrated treatment groups. In addition to the previous treatments, we treated mice with lower concentrations of cefoperazone, streptomycin, and vancomycin (see Fig. S2 in the supplemental material). These antibiotics were selected because they are thought to target a broad spectrum of bacteria (i.e., cefoperazone), Gram-negative (i.e., streptomycin), and Gram-positive (i.e., vancomycin) bacteria. As expected in all mice receiving titrated doses of cefoperazone, C. difficile colonization levels decreased significantly (P < 0.02; Fig. 2). Titrating the dose of cefoperazone in the animals’ drinking water resulted in significant decreases in the relative abundance of an operational taxonomic unit (OTU) associated with the genus Escherichia (OTU 3) and a number of rare OTUs. We also observed increases in the relative abundances of OTUs associated with the family Porphyromonadaceae (OTU 5, 10, 11, 13, and 21; Fig. 2). Reducing the dose of streptomycin significantly reduced the colonization levels (P < 0.01; Fig. 2). Titrating the dose of streptomycin in the drinking water resulted in significant changes in the relative abundance of OTUs associated with the Porphyromonadaceae family (OTUs 2, 5, 6, 10, and 11), Alistipes genus (OTU 12), and Bacteroidales order (OTU 17). In addition to its anti-Gram-positive activity, vancomycin was also selected because although the community was quite different from untreated mice, we observed high levels of C. difficile colonization in only one mouse. We anticipated that lower doses might result in a community structure that would result in colonization. In fact, the 0.3- and 0.1-mg/ml doses of vancomycin resulted in similarly high levels of C. difficile colonization (P = 0.96). Seven OTUs were differentially represented across the three doses of vancomycin. Surprisingly, even though the colonization levels of C. difficile did not differ significantly between the mice receiving 0.1 and 0.3 mg/ml of vancomycin in their drinking water, four of the OTUs that had significantly different relative abundances were found only in mice receiving the lower dose. Three of these four OTUs were affiliated with members of the Porphyromonadaceae (OTUs 2, 5, and 6), and one was affiliated with a member of the genus Bacteroides (OTU 1). Two OTUs affiliated with the Akkermansia (OTU 6) and Lactobacillus (OTU 8) genera increased with increasing dose, and a third OTU affiliated with Escherichia (OTU 4) had a mixed response to the dose level. These results suggest that the context in which specific members of the microbiota are found is important in determining the overall resistance to C. difficile. For example, the relationship between the Bacteroides-affiliated OTU (OTU 1) and C. difficile colonization was positive in streptomycin-treated mice, and it was negative in cefoperazone-treated mice. In addition, cefoperazone- and streptomycin-treated mice had high levels of C. difficile, although the former had significantly higher levels of an Escherichia-affiliated OTU (OTU 3), which were absent in the streptomycin-treated mice. Together, these results suggest that individual populations were not sufficient to consistently predict colonization resistance. In light of such results, resistance is likely a product of the overall composition of the community.
FIG 2 .

Titration of antibiotic perturbations results in altered community structures and C. difficile colonization resistance. Bars indicate the median percent relative abundance of those selected OTUs from all treatment groups on the day of C. difficile challenge. Asterisks along the x axis indicate those OTUs that varied significantly across doses of the same antibiotic after correcting for multiple comparisons. The error bars indicate the interquartile range. The number of animals used in each treatment group is indicated in the legend, which also gives the dose of each antibiotic that was used. The median level C. difficile colonization found 24 h after microbiota sampling is plotted on the right for each treatment, with error bars indicating the interquartile range. Letters above colonization levels indicate statistical differences between groups. Values that are not significantly different (NS) are indicated.
Allowing recovery of the microbiota restores colonization resistance.
In the experiments we have described thus far, we allowed the gut microbiota to recover for 24 h before challenging them with C. difficile. Several studies have demonstrated that perturbed communities can return to a “healthy” state in which resistance to C. difficile is restored (3, 17). To test the effect of recovery on colonization and gain greater insights into the populations that confer colonization resistance, we allowed the microbiota of the mice that received the full metronidazole and ampicillin treatment to recover for an additional 5 days (see Fig. S3 in the supplemental material). Among the metronidazole-treated mice, those with extended recovery had a 1.86 × 10⁶-fold reduction in colonization (P < 0.001; Fig. 3). In addition, 7 of the 14 mice given the longer recovery period had no detectable C. difficile 24 h after challenge. We detected six OTUs that were differentially represented in the two sets of metronidazole-treated mice (Fig. 3). Most notable among these six OTUs were two OTUs that affiliated with a member of the Barnesiella (OTU 2) and Escherichia (OTU 3). The relative abundance of this Barnesiella-affiliated OTU increased with extended recovery, and the relative abundance of this Escherichia-affiliated OTU decreased. Similar to the metronidazole-treated mice, the ampicillin-treated mice that were allowed to recover for an additional 5 days before challenge had a significant decrease in C. difficile colonization (P = 0.03). As before, we observed a similar increase and decrease in relative abundances for Barnesiella (OTU 2)- and Escherichia (OTU 3)-affiliated OTUs. However, untreated, fully resistant mice harbored significantly lower levels of the Barnesiella-affiliated OTU (OTU 2). Rather, untreated mice had high levels of various Porphyromonadaceae-affiliated OTUs (Fig. 1). These findings further confirm the context dependency of colonization resistance suggested by the results of our titration experiments.
FIG 3 .

Increasing the recovery time following antibiotic perturbation restores colonization resistance. Bars indicate the median percent relative abundance of those selected OTUs from all treatment groups on the day of C. difficile challenge. Asterisks along the x axis indicate those OTUs that varied significantly between those mice that were allowed 1 or 6 days of recovery after correcting for multiple comparisons. The error bars indicate the interquartile range. The median level C. difficile colonization found 24 h after microbiota sampling is plotted on the right for each recovery period and antibiotic, with error bars indicating the interquartile range. The number of mice used in each treatment group is indicated above the C. difficile colonization data. The dose of each antibiotic is indicated next to the name of the antibiotic.
Correlation analysis reveals potentially protective bacteria.
To identify bacterial taxa that could be associated with resistance or susceptibility to C. difficile across the three sets of experiments, we measured the correlation between the relative abundance of each OTU on the day of inoculation with the level of C. difficile colonization 24 h later (Fig. 4). OTUs associated with providing resistance against C. difficile (n = 22) outnumbered those associated with susceptibility (n = 9). The Porphyromonadaceae-affiliated OTUs (ρaverage = −0.52; n = 11 OTUs) were consistently associated with low levels of C. difficile colonization. Among the three Proteobacteria-affiliated OTUs with a significant positive association with C. difficile colonization, the strongest was affiliated with the Escherichia (OTU 3; ρ = 0.54). By performing an OTU-based analysis, we were able to observe intrafamily and genus differences in association with C. difficile colonization. For example, the Lachnospiraceae have been associated with protection against C. difficile (18). Although within the Lachnospiraceae family we observed three OTUs that were associated with low levels of C. difficile colonization, one OTU was associated with high levels of C. difficile. In addition, we observed three significantly correlated Lactobacillus-affiliated OTUs (family Lactobacillaceae), two of which were associated with low levels of C. difficile and one was associated with high levels. The broad taxonomic representation of OTUs associated with low levels of C. difficile again suggests that a diverse community may be advantageous in preventing C. difficile colonization.
FIG 4 .
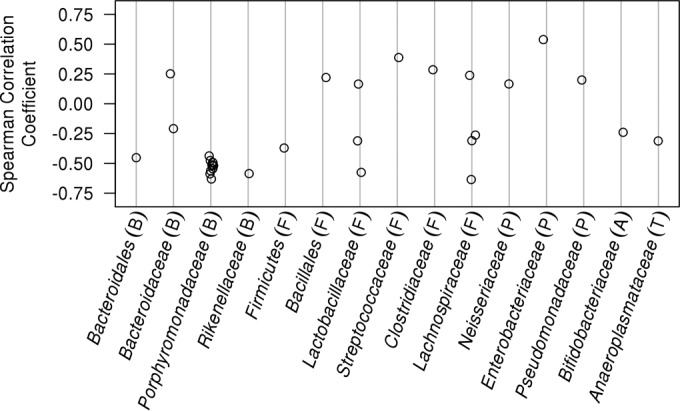
Diverse taxonomic groups are associated with low levels of C. difficile colonization. Spearman correlation coefficients were calculated using the relative abundance of OTUs found on the day that mice were challenged with C. difficile spores and the amount of C. difficile observed 24 h later. Only significant correlations are presented after correcting for multiple comparisons. OTUs are grouped by the taxonomic family. The phylum that the taxa belong to are indicated by letters within parentheses as follows: B, Bacteroidetes; F, Firmicutes; P, Proteobacteria; A; Actinobacteria; T, Tenericutes.
The composition of the disturbed gut microbiota is predictive of C. difficile colonization levels.
These three sets of experiments demonstrated that in certain contexts, individual OTUs could be associated with C. difficile colonization, but in other contexts, those OTUs had the opposite or no association. This suggests that colonization is a phenotype that is driven by multiple populations that act independently and possibly in concert to resist colonization. Correlation-based analyses cannot predict these types of context dependencies because they do not take into account the nonlinearity and statistical interactions between populations. Therefore, we used a regression-based random forest machine learning algorithm to predict the level of C. difficile colonization observed in the three sets of experiments using the composition of the microbiota at the time of challenge as predictor variables. The model explained 77.2% of the variation in the observed C. difficile colonization levels (Fig. 5). When we included only the top 12 OTUs based on the percent increase in the mean squared error when each OTU was removed, the resulting model explained 77.1% of the variation in the observed C. difficile colonization levels. The OTUs that were ranked as being the most important in defining the random forest model further validated the observations from the correlation-based analysis (see Fig. S4 in the supplemental material). According to the random forest model, colonization resistance was associated with OTUs that affiliated with the Porphyromonadaceae (OTU 15, 10, 6, 18, and 11), Lachnospiraceae (OTU 25), Lactobacillus (OTU 23), Alistipes (OTU 12), and Turicibacter (OTU 9) (Fig. 6). A loss in these populations, concurrently with a gain in OTUs affiliated with the Escherichia (OTU 3) or Streptococcus (OTU 90), was associated with an increased susceptibility to infection (Fig. 6). As we observed in the titration experiments, the relationship between an Akkermansia-affiliated OTU (OTU 4) and C. difficile indicated that wide variation in the relative abundance of Akkermansia was associated with different levels of C. difficile. There were different abundances of the Akkermansia-affiliated OTU in mice regardless of the level of C. difficile colonization. Finally, as indicated by the number of OTUs with relative abundances below the limit of detection, those mice could harbor different levels of C. difficile. These observations bolster the hypothesis that colonization resistance is context dependent.
FIG 5 .

The random forest regression model predicts C. difficile colonization levels based on the structure of the microbiota. The overall model explained 77.2% of the variation in the data. Each panel shows antibiotic treatment groups in color and the other points as gray circles. The panels are shown in order of the level of C. difficile colonization when mice were treated with the highest dose of their respective antibiotic.
FIG 6 .

Relationship between OTU relative abundance and C. difficile colonization levels indicates nonlinearity and context dependency. The 12 OTUs that resulted in the greatest change in percent mean squared error when removed from the random forest regression model are shown in each panel and together explain 77.1% of the variation in the data. The Spearman correlation value between that OTU’s abundance and C. difficile levels are shown for each panel when the corrected P value was significant. The color and symbols represent the same antibiotic dose and recovery period as in Fig. 5. N.S., not significant.
DISCUSSION
Previous attempts to study the role of the gut microbiota in colonization resistance against C. difficile infection have utilized a single perturbation to the community. Here, we used seven antibiotics from six classes that were given to mice in different doses and with different postantibiotic recovery periods. The result was a combination of 15 different perturbations and the nonperturbed microbiota, which allowed us to generate distinct community profiles that displayed a range of susceptibilities to C. difficile colonization. Our findings demonstrated that colonization resistance was not driven by individual populations but by a consortium of organisms. Others have demonstrated that Barnesiella or Lachnospiraceae are partially protective against C. difficile (9, 18). Although we observed similar results in a subset of our perturbations, by using a large number of perturbations, we were able to demonstrate that a varied collection of populations was important for complete colonization resistance. Thus, colonization resistance can be described as an emergent property of the microbiome, in which individual bacterial populations integrated in a community contribute to the overall resistance to C. difficile (19).
There is clear need for more efficient therapies for treatment of C. difficile infections in humans aimed at restoration of the microbiota. Current first-line treatments of CDI include regimens of either metronidazole or vancomycin, which further perturb the microbiota. As such, relapse rates for CDI are typically around 25 to 30% (20). Interestingly, we observed that treatment with either antibiotic induced susceptibility to C. difficile in mice. This result has implications for understanding the causes of recurrent infections. Previous efforts to restore the microbiota and reestablish colonization resistance also support our findings. For instance, association of germ-free mice with a Lachnospiraceae isolate reduced the level of C. difficile colonization by only 10- to 100-fold (18). Using conventional mice, mixtures of bacteria rather than individual populations have been shown to restore colonization resistance and mediate clearance of C. difficile (21, 22). Fecal transplants, which represent a diverse collection of bacterial populations, have been highly effective in treating humans with recurrent C. difficile infections (12, 23, 24). By generating a varied collection of communities that were challenged with C. difficile, we have identified a subset of populations using random forest modeling that could be used as a probiotic cocktail to provide colonization resistance. These would include members of the Porphyromonadaceae, Lachnospiraceae, Lactobacillus, and Alistipes. Several of these populations have been examined for their potential as a probiotic for preventing C. difficile infection. A six-species cocktail, including isolates of Porphyromonadaceae, Lachnospiraceae, Lactobacillus, Coriobacteriaceae, Staphylococcus, and Enterococcus, successfully resolved CDI in mice (22). In humans, Lactobacillus-based probiotics have been coadministered with antibiotics to deter the onset of antibiotic-associated diarrhea (AAD) and C. difficile infection (22). A more diverse probiotic, which contained 33 bacterial species, including Porphyromonadaceae, Lachnospiraceae, Ruminococcaceae, Eubacteriaceae, and Lactobacillus isolates, successfully restored colonization resistance in recurrent C. difficile infection and eliminated diarrhea up to 6 months posttreatment (25). Given this evidence, we feel confident that an effective probiotic mixture could be designed based on our findings to recover colonization resistance against C. difficile. Moreover, this line of study will be useful toward the development of personalized treatments based on an individual’s specific gut microbiota, which may be a more efficient strategy for preventing and treating CDI. Further examination of the bacterial populations identified in this study is necessary to identify causal relationships and assess the specific mechanisms of colonization resistance. Additional investigations into the importance of taxonomic diversity of the microbiota in colonization resistance may highlight its underlying connection to functional redundancy, which is hypothesized to contribute to overall functional stability of the community, known as the “insurance hypothesis” (26). Such research will further advance the development of protocols to prevent and treat CDI.
Random forest regression models allowed us to describe community resistance as a byproduct of an assemblage of bacterial populations rather than as individual populations. A correlation-based analysis was unable to identify populations that had a context-dependent or nonlinear association with C. difficile colonization. Although the murine and human microbiota do not fully overlap, our previous analysis of humans infected with C. difficile supports the populations that we associated with colonization (10). For instance, Escherichia was previously associated with infected individuals, and Lachnospiraceae, Ruminococcaceae, and Alistipes were absent from infected individuals. The overlap between the results from the current study and past human studies along with the power of random forest models suggest that it should be possible to model a patient’s risk of developing a C. difficile infection on the basis of their gut microbiota composition at admission. As a demonstration of this, we generated a random forest model to predict the binary outcome of whether a mouse would become colonized, regardless of C. difficile abundance. With this model, which used the same OTUs as the regression model, we observed an error rate of 10.7%. This suggests that such an approach would be valuable and could perhaps be improved by incorporating other clinical data (10). Overall, these findings demonstrate the significance of the microbiota as an interconnected bacterial community in assessing resistance to pathogen colonization.
MATERIALS AND METHODS
Animal care.
We used 5- to 8-week-old C57BL/6 mice obtained from a single breeding colony maintained at the University of Michigan for all of our experiments. These mice were reared under specific-pathogen-free (SPF) conditions within the animal facility at the University of Michigan. All animal-related protocols and experiments were approved by the University Committee on Use and Care of Animals at the University of Michigan and carried out in accordance with the approved guidelines.
Antibiotic administration.
Mice were administered one of seven different antibiotics, including cefoperazone, vancomycin, metronidazole, streptomycin, ciprofloxacin, ampicillin, and clindamycin (Table 1). The route of administration depended on the specific antibiotic. Cefoperazone (0.5, 0.3, or 0.1 mg/ml), vancomycin (0.625, 0.3, or 0.1 mg/ml), streptomycin (5, 0.5, or 0.1 mg/ml), metronidazole (0.5 mg/ml), and ampicillin (0.5 mg/ml) were all administered in the mouse drinking water for 5 days. Ciprofloxacin (10 mg/kg of body weight) was administered via oral gavage, and clindamycin (10 mg/kg) was administered via intraperitoneal injection. Mice that had not received antibiotics were used as negative controls for these experiments, because C. difficile is unable to colonize mice that are not perturbed by antibiotics. The “No antibiotics” group in Fig. 1 and Fig. S1 in the supplemental material collectively refer to the microbiota of these untreated animals prior to their challenge with C. difficile, as well as the microbiota of animals prior to treatment with their respective antibiotic (i.e., the baseline for antibiotic-treated mice).
C. difficile preparation and challenge.
All antibiotic-treated mice were given 24 h to recover with untreated drinking water prior to C. difficile challenge. C. difficile strain 630Δerm spores were used in all experiments. Spores were prepared from a single large batch whose concentration was determined in the week prior to each C. difficile challenge (27). Spores were stored long term at 4°C. On the day of challenge, 103 C. difficile spores were administered to mice via oral gavage. Immediately following this challenge, the remaining C. difficile inoculum was diluted in a series and plated to confirm the correct dosage.
Sample collection and plating.
Fecal samples were freshly collected for each mouse on the day of C. difficile challenge. On the day after challenge, another fecal sample was weighed and diluted under anaerobic conditions with anaerobic phosphate-buffered saline (PBS). The number of CFU was counted following 24-h growth on TCCFA plates at 37°C under anaerobic conditions (28).
DNA extraction and sequencing.
Total bacterial DNA was extracted from each stool sample collected prior to challenge using the MOBIO PowerSoil-htp 96-well soil DNA isolation kit. We generated amplicons of the V4 region within the 16S rRNA gene and sequenced the fragments using an Illumina MiSeq as previously described (29).
Sequence curation.
These sequences were curated using mothur (v.1.35) as previously described (29, 30). Briefly, sequences were binned into operational taxonomic units (OTUs) using a 3% dissimilarity cutoff. Taxonomic assignments were determined by using a naive Bayesian classifier with the Ribosomal Database Project (RDP) training set (version 10) requiring an 80% bootstrap confidence score (31). In parallel to the fecal samples, we also sequenced a mock community where we knew the true sequence of the 16S rRNA gene sequences. Analysis of the mock community data indicated that the error rate following our curation procedure was 0.02%.
Statistical analysis and modeling.
Complete scripts for regenerating our analysis and this paper are available at the online repository for this study (https://github.com/SchlossLab/Schubert_AbxD01_mBio_2015). Comparisons between the antibiotic-treated communities were made by calculating dissimilarity matrices based on the metric of Yue and Clayton (32). To avoid biases due to uneven sampling, the dissimilarity matrices were calculated by rarefying the samples to 1,625 sequences per sample. We then used analysis of molecular variance (AMOVA) to test for differences in community structure using 10,000 permutations (33). OTU-based analyses were performed using R (v.3.1.2). After subsampling the OTU frequency data to 1,625 sequences per sample, OTUs were considered for analysis if their average relative abundance within any treatment group was at least 1% (n = 38 OTUs). All OTU-by-OTU comparisons were performed using the Kruskal-Wallis rank sum test, followed by pairwise Wilcoxon rank sum tests. Comparison of log (base 10)-transformed C. difficile CFU/g feces between experimental groups was calculated using the Kruskal-Wallis rank sum test, followed by pairwise Wilcoxon rank sum tests. Spearman rank correlation analysis was performed between OTU counts and C. difficile CFU/g feces. All P values were corrected using a Benjamini and Hochberg adjustment with an experiment-wide type I error rate of 0.05 (34). Random forest regression models were constructed using the randomForest R package using 10,000 trees (35). To construct each tree, two-thirds of the samples were randomly selected to train the model, and one-third of the samples were selected to test the model. The regression was performed using the log (base 10) transformation of the number of CFU/g fecal material as the dependent variable and the 38 OTUs as predictor variables.
Sequence data accession number.
All 16S rRNA gene sequence data and metadata are available through the Sequence Read Archive under accession no. SRP057386.
SUPPLEMENTAL MATERIAL
Effect of antibiotic perturbations on phylum-level representation of communities on the day of the C. difficile challenge. Bars depict the median relative abundance across mice within the treatment group, and error bars indicate the interquartile range. Download
Effect of titrated antibiotic treatments on phylum-level representation of communities on the day of the C. difficile challenge. Bars depict the median relative abundance across mice within the treatment group, and error bars indicate the interquartile range. Download
Effect of recovery period following antibiotic treatments on phylum-level representation of communities on the day of the C. difficile challenge. Bars depict the median relative abundance across mice within the treatment group, and error bars indicate the interquartile range. Download
The change in percent mean squared error when each OTU was removed from the random forest regression model. The top 12 OTUs with the highest percent increase in mean square error are indicated in red and are depicted in Fig. 6. Download
ACKNOWLEDGMENTS
We thank Vincent Young for providing a critical review of an earlier version of the manuscript.
This work was supported by several grants from the National Institutes for Health R01GM099514, R01HG005975, U19AI090871, and P30DK034933.
The funding agencies had no role in study design, data collection and analysis, decision to publish, or preparation of the manuscript.
Footnotes
Citation Schubert AM, Sinani H, Schloss PD. 2015. Antibiotic-induced alterations of the murine gut microbiota and subsequent effects on colonization resistance against Clostridium difficile. mBio 6(4):e00974-15. doi:10.1128/mBio.00974-15.
REFERENCES
- 1.Vollaard EJ, Clasener HA. 1994. Colonization resistance. Antimicrob Agents Chemother 38:409–414. doi: 10.1128/AAC.38.3.409. [DOI] [PMC free article] [PubMed] [Google Scholar]
- 2.Chang JY, Antonopoulos DA, Kalra A, Tonelli A, Khalife WT, Schmidt TM, Young VB. 2008. Decreased diversity of the fecal microbiome in recurrent Clostridium difficile-associated diarrhea. J Infect Dis 197:435–438. doi: 10.1086/525047. [DOI] [PubMed] [Google Scholar]
- 3.Reeves AE, Theriot CM, Bergin IL, Huffnagle GB, Schloss PD, Young VB. 2011. The interplay between microbiome dynamics and pathogen dynamics in a murine model of Clostridium difficile infection. Gut Microbes 2:145–158. doi: 10.4161/gmic.2.3.16333. [DOI] [PMC free article] [PubMed] [Google Scholar]
- 4.Wilson KH, Sheagren JN, Freter R. 1985. Population dynamics of ingested Clostridium difficile in the gastrointestinal tract of the Syrian hamster. J Infect Dis 151:355–361. doi: 10.1093/infdis/151.2.355. [DOI] [PubMed] [Google Scholar]
- 5.Bauer MP, Kuijper EJ. 2015. Potential sources of Clostridium difficile in human infection. Infect Dis Clin North Am 29:29–35. doi: 10.1016/j.idc.2014.11.010. [DOI] [PubMed] [Google Scholar]
- 6.Lessa FC, Mu Y, Bamberg WM, Beldavs ZG, Dumyati GK, Dunn JR, Farley MM, Holzbauer SM, Meek JI, Phipps EC, Wilson LE, Winston LG, Cohen JA, Limbago BM, Fridkin SK, Gerding DN, McDonald LC. 2015. Burden of Clostridium difficile infection in the United States. N Engl J Med 372:825–834. doi: 10.1056/NEJMoa1408913. [DOI] [PMC free article] [PubMed] [Google Scholar]
- 7.Theriot CM, Koumpouras CC, Carlson PE, Bergin II, Aronoff DM, Young VB. 2011. Cefoperazone-treated mice as an experimental platform to assess differential virulence of Clostridium difficile strains. Gut Microbes 2:326–334. doi: 10.4161/gmic.19142. [DOI] [PMC free article] [PubMed] [Google Scholar]
- 8.Bassis CM, Theriot CM, Young VB. 2014. Alteration of the murine gastrointestinal microbiota by tigecycline leads to increased susceptibility to Clostridium difficile infection. Antimicrob Agents Chemother 58:2767–2774. doi: 10.1128/AAC.02262-13. [DOI] [PMC free article] [PubMed] [Google Scholar]
- 9.Buffie CG, Jarchum I, Equinda M, Lipuma L, Gobourne A, Viale A, Ubeda C, Xavier J, Pamer EG. 2012. Profound alterations of intestinal microbiota following a single dose of clindamycin results in sustained susceptibility to Clostridium difficile-induced colitis. Infect Immun 80:62–73. doi: 10.1128/IAI.05496-11. [DOI] [PMC free article] [PubMed] [Google Scholar]
- 10.Schubert AM, Rogers MA, Ring C, Mogle J, Petrosino JP, Young VB, Aronoff DM, Schloss PD. 2014. Microbiome data distinguish patients with Clostridium difficile infection and non-C. difficile-associated diarrhea from healthy controls. mBio 5(3):e01021-14. doi: 10.1128/mBio.01021-14. [DOI] [PMC free article] [PubMed] [Google Scholar]
- 11.Vincent C, Stephens DA, Loo VG, Edens TJ, Behr MA, Dewar K, Manges AR. 2013. Reductions in intestinal Clostridiales precede the development of nosocomial Clostridium difficile infection. Microbiome 1:18. doi: 10.1186/2049-2618-1-18. [DOI] [PMC free article] [PubMed] [Google Scholar]
- 12.Seekatz AM, Aas J, Gessert CE, Rubin TA, Saman DM, Bakken JS, Young VB. 2014. Recovery of the gut microbiome following fecal microbiota transplantation. mBio 5(3):e00893-14. doi: 10.1128/mBio.00893-14. [DOI] [PMC free article] [PubMed] [Google Scholar]
- 13.Stein RR, Bucci V, Toussaint NC, Buffie CG, Rätsch G, Pamer EG, Sander C, Xavier JB. 2013. Ecological modeling from time-series inference: insight into dynamics and stability of intestinal microbiota. PLoS Comput Biol 9:e1003388. doi: 10.1371/journal.pcbi.1003388. [DOI] [PMC free article] [PubMed] [Google Scholar]
- 14.Belzer C, Gerber GK, Roeselers G, Delaney M, DuBois A, Liu Q, Belavusava V, Yeliseyev V, Houseman A, Onderdonk A, Cavanaugh C, Bry L. 2014. Dynamics of the microbiota in response to host infection. PLoS One 9:e95534. doi: 10.1371/journal.pone.0095534. [DOI] [PMC free article] [PubMed] [Google Scholar]
- 15.Zackular JP, Baxter NT, Iverson KD, Sadler WD, Petrosino JF, Chen GY, Schloss PD. 2013. The gut microbiome modulates colon tumorigenesis. mBio 4(6):e00692-13. doi: 10.1128/mBio.00692-13. [DOI] [PMC free article] [PubMed] [Google Scholar]
- 16.Statnikov A, Alekseyenko AV, Li Z, Henaff M, Perez-Perez GI, Blaser MJ, Aliferis CF. 2013. Microbiomic signatures of psoriasis: feasibility and methodology comparison. Sci Rep 3:2620. doi: 10.1038/srep02620. [DOI] [PMC free article] [PubMed] [Google Scholar]
- 17.Theriot CM, Koenigsknecht MJ, Carlson PE Jr, Hatton GE, Nelson AM, Li B, Huffnagle GB, Li JZ, Young VB. 2014. Antibiotic-induced shifts in the mouse gut microbiome and metabolome increase susceptibility to Clostridium difficile infection. Nat Commun 5:3114. doi: 10.1038/ncomms4114. [DOI] [PMC free article] [PubMed] [Google Scholar]
- 18.Reeves AE, Koenigsknecht MJ, Bergin IL, Young VB. 2012. Suppression of Clostridium difficile in the gastrointestinal tracts of germfree mice inoculated with a murine isolate from the family Lachnospiraceae. Infect Immun 80:3786–3794. doi: 10.1128/IAI.00647-12. [DOI] [PMC free article] [PubMed] [Google Scholar]
- 19.Novikoff AB. 1945. The concept of integrative levels and biology. Science 101:209–215. doi: 10.1126/science.101.2618.209. [DOI] [PubMed] [Google Scholar]
- 20.Wilcox MH, Fawley WN, Settle CD, Davidson A. 1998. Recurrence of symptoms in Clostridium difficile infection—relapse or reinfection? J Hosp Infect 38:93–100. doi: 10.1016/S0195-6701(98)90062-7. [DOI] [PubMed] [Google Scholar]
- 21.Buffie CG, Bucci V, Stein RR, McKenney PT, Ling L, Gobourne A, No D, Liu H, Kinnebrew M, Viale A, Littmann E, van den Brink MR, Jenq RR, Taur Y, Sander C, Cross JR, Toussaint NC, Xavier JB, Pamer EG. 2015. Precision microbiome reconstitution restores bile acid mediated resistance to Clostridium difficile. Nature 517:205–208. doi: 10.1038/nature13828. [DOI] [PMC free article] [PubMed] [Google Scholar]
- 22.Lawley TD, Clare S, Walker AW, Stares MD, Connor TR, Raisen C, Goulding D, Rad R, Schreiber F, Brandt C, Deakin LJ, Pickard DJ, Duncan SH, Flint HJ, Clark TG, Parkhill J, Dougan G. 2012. Targeted restoration of the intestinal microbiota with a simple, defined bacteriotherapy resolves relapsing Clostridium difficile disease in mice. PLoS Pathog 8:e1002995. doi: 10.1371/journal.ppat.1002995. [DOI] [PMC free article] [PubMed] [Google Scholar]
- 23.Kassam Z, Lee CH, Yuan Y, Hunt RH. 2013. Fecal microbiota transplantation for Clostridium difficile infection: systematic review and meta-analysis. Am J Gastroenterol 108:500–508. doi: 10.1038/ajg.2013.59. [DOI] [PubMed] [Google Scholar]
- 24.Weingarden A, González A, Vázquez-Baeza Y, Weiss S, Humphry G, Berg-Lyons D, Knights D, Unno T, Bobr A, Kang J, Khoruts A, Knight R, Sadowsky MJ. 2015. Dynamic changes in short- and long-term bacterial composition following fecal microbiota transplantation for recurrent Clostridium difficile infection. Microbiome 3:10. doi: 10.1186/s40168-015-0070-0. [DOI] [PMC free article] [PubMed] [Google Scholar]
- 25.Petrof EO, Gloor GB, Vanner SJ, Weese SJ, Carter D, Daigneault MC, Brown EM, Schroeter K, Allen-Vercoe E. 2013. Stool substitute transplant therapy for the eradication of Clostridium difficile infection: ‘RePOOPulating’ the gut. Microbiome 1:1–12. doi: 10.1186/2049-2618-1-3. [DOI] [PMC free article] [PubMed] [Google Scholar]
- 26.Yachi S, Loreau M. 1999. Biodiversity and ecosystem productivity in a fluctuating environment: the insurance hypothesis. Proc Natl Acad Sci U S A 96:1463–1468. doi: 10.1073/pnas.96.4.1463. [DOI] [PMC free article] [PubMed] [Google Scholar]
- 27.Sorg JA, Dineen SS. 2009. Laboratory maintenance of Clostridium difficile. Curr Protoc Microbiol Chapter 9:Unit 9A.1. doi: 10.1002/9780471729259.mc09a01s12. [DOI] [PubMed] [Google Scholar]
- 28.Buggy BP, Wilson KH, Fekety R. 1983. Comparison of methods for recovery of Clostridium difficile from an environmental surface. J Clin Microbiol 18:348–352. [DOI] [PMC free article] [PubMed] [Google Scholar]
- 29.Kozich JJ, Westcott SL, Baxter NT, Highlander SK, Schloss PD. 2013. Development of a dual-index sequencing strategy and curation pipeline for analyzing amplicon sequence data on the MiSeq Illumina sequencing platform. Appl Environ Microbiol 79:5112–5120. doi: 10.1128/AEM.01043-13. [DOI] [PMC free article] [PubMed] [Google Scholar]
- 30.Schloss PD, Westcott SL, Ryabin T, Hall JR, Hartmann M, Hollister EB, Lesniewski RA, Oakley BB, Parks DH, Robinson CJ, Sahl JW, Stres B, Thallinger GG, Van Horn DJ, Weber CF. 2009. Introducing mothur: open-source, platform-independent, community-supported software for describing and comparing microbial communities. Appl Environ Microbiol 75:7537–7541. doi: 10.1128/AEM.01541-09. [DOI] [PMC free article] [PubMed] [Google Scholar]
- 31.Wang Q, Garrity GM, Tiedje JM, Cole JR. 2007. Naive Bayesian classifier for rapid assignment of rRNA sequences into the new bacterial taxonomy. Appl Environ Microbiol 73:5261–5267. doi: 10.1128/AEM.00062-07. [DOI] [PMC free article] [PubMed] [Google Scholar]
- 32.Yue JC, Clayton MK. 2005. A similarity measure based on species proportions. Commun Stat Theory Methods 34:2123–2131. doi: 10.1080/STA-200066418. [DOI] [Google Scholar]
- 33.Anderson MJ. 2001. Permutation tests for univariate or multivariate analysis of variance and regression. Can J Fish Aquat Sci 58:626–639. doi: 10.1139/f01-004. [DOI] [Google Scholar]
- 34.Benjamini Y, Hochberg Y. 1995. Controlling the false discovery rate—a practical and powerful approach to multiple testing. J Roy Stat Soc B Met 57:289–300. [Google Scholar]
- 35.Cutler DR, Edwards TC Jr, Beard KH, Cutler A, Hess KT, Gibson J, Lawler JJ. 2007. Random forests for classification in ecology. Ecology 88:2783–2792. doi: 10.1890/07-0539.1. [DOI] [PubMed] [Google Scholar]
Associated Data
This section collects any data citations, data availability statements, or supplementary materials included in this article.
Supplementary Materials
Effect of antibiotic perturbations on phylum-level representation of communities on the day of the C. difficile challenge. Bars depict the median relative abundance across mice within the treatment group, and error bars indicate the interquartile range. Download
Effect of titrated antibiotic treatments on phylum-level representation of communities on the day of the C. difficile challenge. Bars depict the median relative abundance across mice within the treatment group, and error bars indicate the interquartile range. Download
Effect of recovery period following antibiotic treatments on phylum-level representation of communities on the day of the C. difficile challenge. Bars depict the median relative abundance across mice within the treatment group, and error bars indicate the interquartile range. Download
The change in percent mean squared error when each OTU was removed from the random forest regression model. The top 12 OTUs with the highest percent increase in mean square error are indicated in red and are depicted in Fig. 6. Download