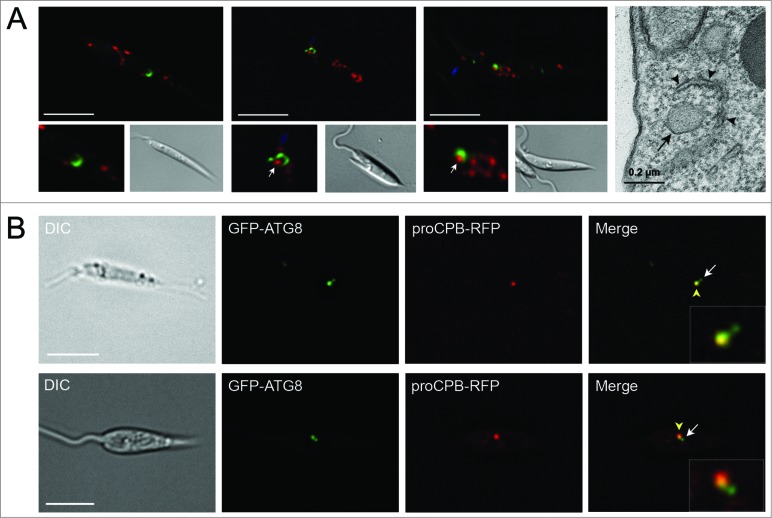
Figure 4.
Visualization of autophagosome formation and fusion with lysosomes. (A) L. major promastigotes coexpressing GFP-ATG8 and RFP-SQL were imaged by fluorescence microscopy. Panels at lower left show enlarged images of cup-shaped autophagosomes. Panel on far right shows a section of a TEM of a stationary phase parasite. Arrows mark glycosomes that are being surrounded by autophagosomes. Arrowheads in TEM image show double-membrane forming around glycosome (marked with arrow). (B) Stationary phase L. major coexpressing GFP-ATG8 and proCPB-RFP. Enlarged images of autophagosome-lysosome fusion are displayed in insets. White arrow indicates autophagosome; yellow arrowhead marks lysosome containing GFP-ATG8 and proCPB-RFP. Images show a single slice from a 3-μm Z-stack. Scale bar = 5 μm.

