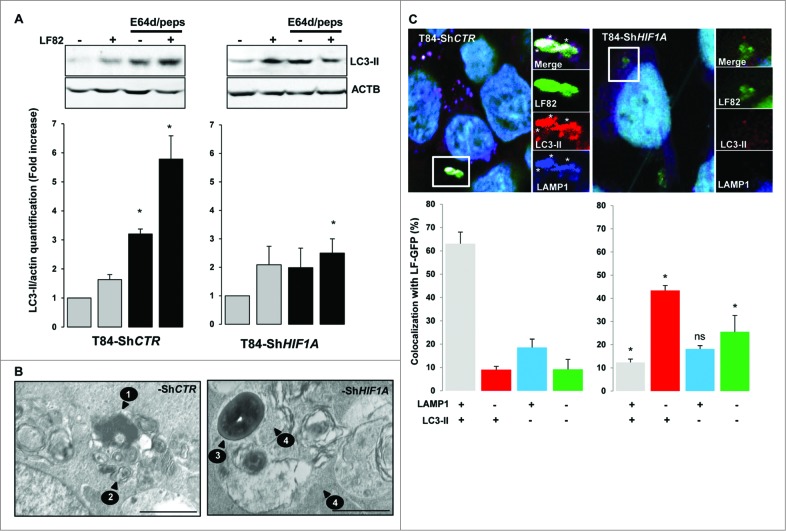
Figure 2.
Inhibition of autophagic flux in cells silenced for HIF1A. Control and HIF1A-silenced T84 cells were infected with AIEC LF82 at a MOI of 10 for 2 h then gentamicin (100 μg/ml) was added for 4 h. Cells were processed for immunoblotting (A), ultra-structural TEM analysis (B) and immunofluorescence (C). (A) Autophagic flux was analyzed by immunoblot analysis with LC3-II antibody in cells infected for 6 h (2 + 4) with AIEC LF82 bacteria (MOI 10) in the absence or in the presence of E64d and pepstatin A. ACTB was used as a loading control. Results from 4 independent experiments were quantified as described in Materials and Methods; the values of untreated T84-ShCTR and ShHIF1A cell samples were then set to 1 and the fold increase was calculated. *P < 0.05 as compared to uninfected conditions. (B) Representative electron micrographs of T84-ShCTR and T84-ShHIF1A cells infected with AIEC LF82 (MOI of 10) 16 h in presence of gentamycin. Arrows denoted degraded bacteria characterized by loss of bacterial membrane and regular round shape (1), vesicle containing partially degraded rough endoplasmic reticulum (2), intact healthy bacteria (3) and intact cytoplasm (4). (C) Representative confocal microscopy examinations of GFP-LF82 infected ShCTR and ShHIF1A cells stained with anti-LC3-II (red, marker of autophagy vesicles) and anti-LAMP1 (blue, marker of mature lysosomes) antibodies showing that LF82 bacteria remained within LC3-II-positive vesicles in cells invalidated for HIF1A. Quantification was performed as described in the Materials and Methods section. Results from 3 independent experiments are shown. *P < 0.05 as compared to T84-ShCTR cells in the same condition.

