Abstract
We previously reported that long-term hypoxia (LTH) increases expression of brown adipose tissue (BAT) genes in the perirenal adipose in the ovine fetus. The mechanisms with which hypoxia mediates the enhanced BAT phenotype are unresolved. This study was designed to examine the effects of LTH on (1) the expression of endothelial cell nitric oxide synthase (eNOS) and (2) indicators of mitochondrial biogenesis (transcription factors mitochondrial transcription factor A (mtTFA), nuclear respiratory factor (NRF) 1, and NRF-2; cytochrome c oxidase (COX) I, II, and IV and mitochondrial DNA content). Pregnant ewes were maintained at high altitude (3820 m) from ∼40 to 137 to 140 days of gestation and perirenal adipose was collected from normoxic control and LTH fetuses. There was no effect of LTH on fetal body weight or perirenal adipose mass. Long-term hypoxia increased (P < .05) perirenal eNOS and phospho-eNOS, messenger RNA (mRNA) for NRF1, NRF-2, mtTFA as well as COX-I, COX-II, and COX-IV mRNA. In contrast, mRNA for 2 markers for cellular proliferation (Ki67 and proliferating cell nuclear antigen [PCNA]) was lower in perirenal adipose from LTH fetuses compared to controls (P < .05), while mitochondrial to nuclear DNA ratio did not differ between groups. In conclusion, nitric oxide may function as a mechanism via which LTH enhances the BAT phenotype in fetal sheep prior to birth. Although there is an apparent increase in genes supporting mitochondrial function and adaptive thermogenesis in response to LTH, there does not appear to be an increased mitochondrial biogenesis per se. Such adaptive changes may provide a mechanism for the prominence of the BAT phenotype observed in the late gestation LTH fetus.
Keywords: ovine, sheep, fetus, adipose, hypoxia, mitochondria
Introduction
There is a significant deposition of perirenal adipose tissue from mid-gestation through term pregnancy in both sheep and human fetuses.1,2 This fetal adipose tissue has characteristics of both brown and white fat, with the brown fat phenotype predominating at birth.1 After birth, the perirenal fat rapidly transitions to a white fat phenotype, although recent studies show that a small number of brown adipocytes persist into adulthood in this fat deposit.3 A major function of fetal perirenal fat is to provide for effective thermoregulation immediately after birth and through the early neonatal period. Critical to this function, brown fat expresses high levels of uncoupling protein 1 (UCP1), a mitochondrial protein that catalyzes adaptive thermogenesis via increasing the proton conductance of the inner mitochondrial membrane.4-6 Perirenal fat also provides the neonate with an essential component of energy homeostasis and storage during the early neonatal period.
Gestational hypoxia, defined as moderate sustained hypoxia over the course of gestation, represents a common major threat to the fetus, occurring in situations such as preeclampsia,7,8 maternal heart disease,9,10 obesity,11 placental insufficiency,12,13 smoking,14 and high altitude.15 We have shown that long-term (from ∼40 days of gestation, term is ∼147 days) moderate (decline in fetal PO2 from ∼23 to ∼18 mm Hg) gestational hypoxia (LTH) in sheep has a significant impact on perirenal adipose in the ovine fetus resulting in increased expression of UCP1.16,17 In this regard, we reported increased expression of genes regulating brown adipose differentiation, including expression of UCP1, PPARγ, PGC1α, PRDM16, and proteins regulating local tissue concentration of hormones essential for differentiation and function of this brown fat source in the ovine fetus, such as 11β hydroxysteroid dehydrogenase type I (HSD11B1; cortisol production), deiodinase type II (T3 production), and the β3 adrenergic receptor (sympathetic activation of brown fat at birth).17,18 Thus, development under conditions of sustained moderate hypoxia impacts fetal perirenal fat differentiation reinforcing the brown fat phenotype.
The mechanism via which LTH mediates and maintains the noted changes in fetal perirenal adipose is presently unknown. However, using the endothelial cell nitric oxide synthase (eNOS) null mouse, Nisoli et al19 demonstrated that nitric oxide (NO) regulates PPARγ, PGC1α, and UCP1 expression in brown adipose tissue. In addition, transcription factors regulating mitochondrial biogenesis and function, nuclear respiratory factor 1 (NRF1), and mitochondrial transcription factor A (mtTFA) were suppressed in eNOS null mice, as was mitochondrial biogenesis. The brown fat deposits of eNOS-deficient mice also had notably less multilocular adipocytes with a shift toward unilocular adipocytes. We demonstrated that eNOS expression is upregulated in the adrenal cortex of the LTH sheep fetus20,21 and circulating levels of NO were also reported to be elevated in LTH fetal sheep.22
In the present study, we explore the possibility that LTH increases expression of eNOS as well as key transcription factors (mtTFA, NRF1, and NRF2), governing expression of the mitochondrial genome and mitochondrial biogenesis. We also assessed the expression of mitochondrial and genomic genes under regulation by these transcription factors involved in mitochondrial electron transport chain (the mitochondrial genome-encoded gene, COX-1, and the nuclear genome-encoded gene, COX-IV). Finally, we examined the effect of LTH on markers of cellular proliferation and mitochondrial biogenesis (Ki67 and proliferating cell nuclear antigen; PCNA) as well as adipose structure (multi- vs unilocular fat) in the perirenal adipose of the late-gestation ovine fetus.
Methods
Animals
All procedures involving animals were conducted with approval of the Institutional Animal Care and Use Committee (Loma Linda University School of Medicine). Pregnant ewes (n = 6) were maintained at the Barcroft Laboratory White Mountain Research Station (elevation 3820 m) from ∼40 days of gestation (40 dG) through 137 to 138 dG (term = ∼147 days). Upon arrival at Loma Linda University Medical Center Animal Research Facility (elevation: 346 m), arterial and nonocclusive tracheal catheters were surgically placed as we previously described.23-25 Maternal PO2 was maintained at ∼60 mm Hg for the LTH ewes by adjusting the flow of humidified nitrogen (N2) gas through the maternal tracheal catheter. Normoxic control ewes (n = 6) were maintained near sea level (∼300 m) throughout gestation. For both groups, food and water were ad libitum and of the same nutritional plane; unlike rodents, sheep do not exhibit altitude-induced anorexia as both LTH and control ewes have a similar body composition.
Between 139 and 140 dG, control and LTH ewes were sedated with pentobarbital and maintained under general anesthesia with halothane (1.5% to 2%) in oxygen. Fetuses were delivered through a midline laparotomy and immediately euthanized by exsanguination. Perirenal adipose tissue was collected from the anterior pole of the kidney and immediately frozen in liquid nitrogen and stored at –80°C until analyzed. There was an even distribution of male and female fetuses in each group (n = 3 male; n = 3 female fetuses/group).
An additional cohort of LTH and control fetuses (age 139 to 141 dG) was used to collect and weigh perirenal fat. We did not collect tissue from these animals for molecular and biochemical analysis due to the length of time needed to collect the entire perirenal fat mass.
Quantification of messenger RNA via Real-Time Polymerase Chain Reaction
Real-time quantitative reverse-transcription polymerase chain reaction (pRT-PCR) was used to quantify messenger RNAs (mRNAs) for both the nuclear-expressed genes: transcription factors regulating mitochondrial transcription (mtTFA, NRF1, and NRF2), cytochrome oxidase IV (COX-IV), NOS-1 (nNOS), NOS-2 (iNOS), NOS-3 (eNOS), and cellular proliferation markers, Ki67, PCNA as well as the mitochondrial expressed cytochrome oxidases I and II (COX-I and COX-II). The primer sequences are provided in Table 1. We have previously described and validated the methods for qRT-PCR for a variety of genes in our laboratory.17,24,26 Total RNA was prepared from perirenal adipose tissue (n = 6 per group for control and LTH fetal sheep) with an RNA preparation kit as per manufacturer’s instructions (Qiagen, Inc, Valencia, California). Prior to reverse transcription, residual genomic DNA was removed from total RNA with DNase I (1 unit, 60 minutes at 37°C; Ambion, Inc, Austin, TX, USA). The DNase I was subsequently removed from the RNA samples via PCR clean-up columns (Qiagen, Inc). An initial denaturation step was performed for 5 minutes at 95°C prior to first strand synthesis at 42°C for 50 minutes. Reverse transcription was then performed using 1 μg total RNA, with oligo dT as the primer, and Superscript II as reverse transcriptase; the reaction was terminated by heating to 70°C for 15 minutes.
Table 1.
Primer Sequences for Genes Studied.
| Gene | NCBI Acc No | Primer Sequence (5′-3′) |
|---|---|---|
| NOS1 | XM_867630 (Bt) | Forward: AAACCACCAGCACCTACCAG |
| Reverse: TCTGAGGTTCCCTTTGTTGG | ||
| NOS2 | NM_001076799 (Bt) | Forward: AAGGCAGCCTGTGAGACATT |
| Reverse: CAGATTCTGCTGCGATTTGA | ||
| NOS3 | NM_181037 (Bt) | Forward: TCTTCCACCAGGAGATGGTC |
| Reverse: AGAGGCGTACAGGATGGTTG | ||
| NRF-1 | XM_004008056.1 (Oa) | Forward: AAACACAAACACAGGCCACA |
| Reverse: CACCGCCGAATAATTCACTT | ||
| NRF-2 | AY369137.1 (Oa) | Forward: GCAGCCGGTGTGAGTAGAGATG |
| Reverse: TGGTGTTGCAGCATGTATCGTC | ||
| mtTFA | GAAI01000507.1(Oa) | Forward: CAAATGATGGAAGTTGGACG |
| Reverse: AGCTTCCGGTATTGAGACC | ||
| COX-I | NC_001941.1 (Oa) | Forward: GAACTCTGCTCGGAGACGAC |
| Reverse: GGGGTGTCCAAAGAATCAGA | ||
| COX-II | NC_001941.1 (Oa) | Forward: TTCCAAGATGCAACATCACC |
| Reverse: GGGCAGAATGGTTCAGATTG | ||
| COX-IV | XM_004014950.1 (Oa) | Forward: AGGAGAAGATGCCTCCCTACA |
| Reverse: GGTTCATCTCTGCGAAGGTC | ||
| Ki67 | XM_004004769.1 (Oa) | Forward: TCAGTGAGCAGGAGGCAGTA |
| Reverse: GGAAATCCAGGTGACTTGCT | ||
| PCNA | XM_004014340.1 (Oa) | Forward: GTGTTTTGCCTCTCGCTCTC |
| Reverse: GAAGGGTTAGCTGCACCAAG | ||
| GR | NC_007305.5 (Bt) | Forward: GTGCAGAATCTCATAGGCTGCC |
| Reverse: TGTGTGGTACGCCTTCTGATT | ||
| Cyclophilin | BT020966 (Bt) | Forward: CCATCGTGTCATCAAGGACTTCAT |
| Reverse: CTTGCCATCCAGCCAGGAGGTCTT |
Abbreviations: NOS1, neuronal nitric oxide synthase; NOS2, inducible nitric oxide synthase; NOS3, endothelial nitric oxide synthase; NRF-1, nuclear respiratory factor 1; NRF-2, nuclear respiratory factor 2; mtTFA/TFAM, mitochondrial transcription factor A; COX-1, cytochrome c oxidase subunit I; COX-II, cytochrome c oxidase subunit II; COX-IV, cytochrome c oxidase subunit IV; Ki67, MKI67 (FHA domain) interacting nucleolar phophoprotein; PCNA, proliferating cell nuclear antigen; GR, glucocorticoid receptor; Bt, Bos taurus; Oa, Ovis aries.
Real-time PCR was performed using 50 ng of complementary DNA (cDNA; assumed equal to input RNA) per PCR. All PCR were performed in triplicate. Initial qRT-PCRs were performed using serial dilutions of cDNA ranging from 250 to 15.625 ng (250, 125, 62.5, 31.25, and 15.625 ng) to determine that the quantity of cDNA used for analysis of each specific mRNA was within the linear range of amplification for each primer. For each mRNA, the starting amount of cDNA for qRT-PCR used was within the linear amplification range. For each primer set, the amplicon was directly sequenced by Sanger dideoxysequencing (Oklahoma Medical Research Foundation Sequencing Core, Oklahoma City, Oklahoma) to confirm amplicon identity. Sybr Green (1 X Sybr green master mix; Biorad, Hercules, California) was utilized as the fluorophore and PCR was performed utilizing a Biorad iCycler equipped with the real-time optical fluorescent detection system. The primer sequences were derived from ovine or bovine cDNA sequences obtained from the National Center for Biotechnology Information (NCBI). The NCBI accession numbers used are listed in Table 1. A three-step PCR was used: 95°C for 45 seconds, annealing (primer specific ranging between 55°C and 60°C) for 30 seconds, and 72°C extension for 30 seconds. A total of 35 cycles were performed. A melt curve analysis was conducted on each sample after the final cycle to ensure that a single product was obtained, and agarose gel electrophoresis confirmed that the single PCR product was of the expected size. We used cyclophilin as a “house-keeping” mRNA, using the identical first-strand cDNA used for quantification of specific mRNAs of interest and in the same PCR run as for the gene of interest to circumvent any between run variation. As we previously reported,25-27 cyclophilin and GAPDH are equally efficacious when used as internal housekeeping mRNAs in our real-time PCR application and, unlike GAPDH, cyclophilin is not subject to glucocorticoid regulation. Control PCR for each primer pair and RNA source included (1) elimination of reverse transcriptase during first-strand cDNA synthesis (assures that PCR product depends upon RNA) and (2) no RNA/cDNA in reverse-transcription reaction (assures that no amplicon contamination has occurred). Primers were utilized that provided (1) a single PCR product (identity confirmed by sequencing), (2) dilution curve of cDNA exhibited a slope of 100% ± 10% “efficiency” where 100% = ▵3 Ct/log cDNA input (Ct is the threshold PCR cycle at which fluorescence is detected above baseline), and (3) the melt curve analysis post-PCR must demonstrate 1 product. For quantification purposes, a synthetic single-stranded DNA standard was used to generate a standard curve (100, 10, 1, 0.1, 0.01, and 0.001 pg of standard DNA) for extrapolation of starting cDNA concentrations per reaction. Each standard point was run in duplicate and in the same PCR block as the unknowns. Linear regression was used to quantify starting RNA (cDNA) based on Ct values as extrapolated from the standard curve. The efficiency of the standard and primers was 100% based on the above-mentioned criteria.
Polymerase Chain Reaction Quantification of Mitochondrial and Genomic DNA
Total DNA (nuclear genomic and mitochondrial) was prepared from perirenal adipose using a commercial kit that extracts both genomic and mitochondrial DNA (DNA preparation kit #51306; Qiagen, Inc). DNA (1 ng for mitochondrial DNA and 10 ng for genomic DNA) was subjected to PCR using primers for the mitochondrial gene COX-I and nuclear gene, the glucocorticoid receptor (GR). A DNA standard curve was used to quantify the mass of DNA present for both mitochondrial and nuclear genes. The ratio of mitochondrial DNA to genomic DNA was compared as indices of mitochondrial genomic DNA in the fetal perirenal adipose tissue. We also determined the relative amounts of genomic and mitochondrial DNA per input mass (gram) of adipose tissue to assess differences in cellularity.
Western Analysis
Frozen adipose was mechanically homogenized in ice-cold RIPA buffer (50 mmol/L Tris HCl, pH 7.4; 1% NP-40; 0.25% sodium deoxycholate; 150 mmol/L sodium chloride; 1 mmol/L EDTA; 1 mmol/L sodium orthovanadate; 1 mmol/L pepstatin, 0.4 mmol/L pefablock, 1 μg/mL leupeptin). Total protein concentrations per sample were determined using the Biorad Protein Assay (BioRad laboratories, Hercules, California). Samples were diluted (1:1) with LDS sample buffer (4×) and reduced by boiling in NuPAGE sample-reducing agent (10×; Invitrogen, Carlsbad, California) prior to running on a 4% to 12% Bis-Tris protein gel (Invitrogen). Proteins were transferred to nitrocellulose membranes (Bio-Rad) and after blocking (1 hour with 10 mmol/L Tris-HCl, pH 7.2; 100 mmol/L sodium borate [TTBS]; 0.1% Tween-20 and 10% nonfat dry milk [NFDM]) were incubated overnight at 4oC (in TTBS with 5% NFDM) with the primary antibodies against eNOS or phospho-Ser 1177 eNOS at concentrations specified by primary antibody suppliers (Cell Signaling, Inc, Danvers, Massachusetts). We were not able to find commercial antibodies that recognized ovine NRF-1, NRF-2, or mtTFA. Membranes were then washed extensively with TTBS and detection was performed using horseradish peroxidase conjugated secondary antibodies (Perkin-Elmer, Boston, Massachusetts) and an enhanced chemiluminescence (Western lightning chemiluminescent reagents) detection system (Perkin Elmer) and finally exposed to X-ray film (Bioexpress, Kaysville, Utah). We have previously published this methodology in our laboratories for NOS isoforms and other proteins.20,23,25
Locule Size and Distribution
Tissue fixation and sectioning methods were similar to those we previously described.20 Briefly, perirenal adipose tissue was collected and fixed in 4% paraformaldehyde. Following fixation, the tissue was washed in multiple changes of phosphate-buffered saline (0.01mol/L) for 48 hours followed by 70% ethanol for 24 hours. Tissues were then embedded in paraffin and 5 μM sections were cut, followed by staining with hematoxylin and eosin. Images were captured at 20× magnification using a Zeiss microscope and SPOT advanced camera equipment. For each specimen, 4 separate quadrants (area = 3.5 × 106 µm2) were examined and locule number and area were determined using Image Pro Analysis software. An average value was then determined for each sample. The cross-sectional area of the dominant locules (μm2) was categorized based on the size parameters previously outlined by Yuen et al28 and the distribution of size ranges (percentage of total area) was determined.
Statistical Analysis
Differences between normoxic control and LTH fetuses in mRNA and protein for each gene of interest were compared using Student’s 2-tailed t test (GraphPad/Prism Software, vs 4.0; GraphPad Software, San Diego, California). Significance was set at the .05 level; all data are presented as mean ± standard error of the mean (SEM).
Results
Fetal Anthropometrics
Fetal weights between LTH (3.52 ± 0.4 kg; mean ± SEM; n = 6) and normoxic control (3.88 ± 0/33 kg; n = 6) were not different. When analyzed by fetal sex, there were no differences between LTH (3.03 ± 0.2 kg; n = 3) and normoxic control fetuses (3.606 ± 0.184 kg; n = 3) for female fetuses nor between male LTH fetuses (4.015 ± 0.723 kg; n = 3) and male normoxic control fetuses (4.167 ± 0.660 kg; n = 3). We also found that the perirenal fat mass between normoxic control (n = 15; 18.1 ± 1.3 g) vs LTH (n = 17; 19.3 ± 1.2 g) were not different.
Expression of NOS
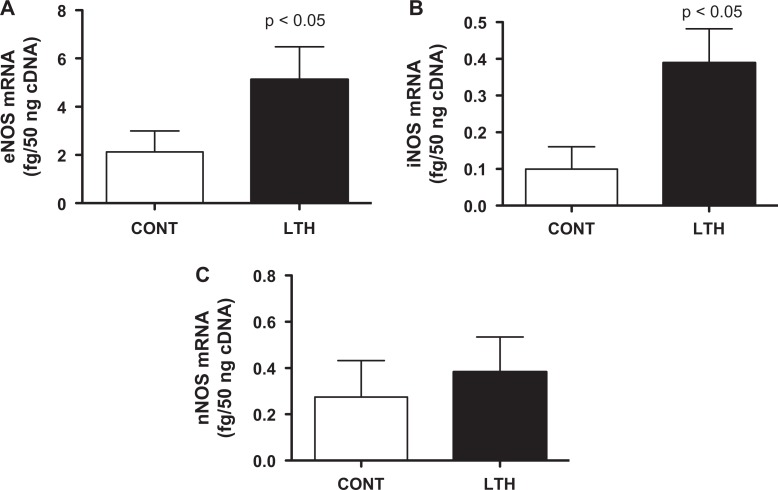
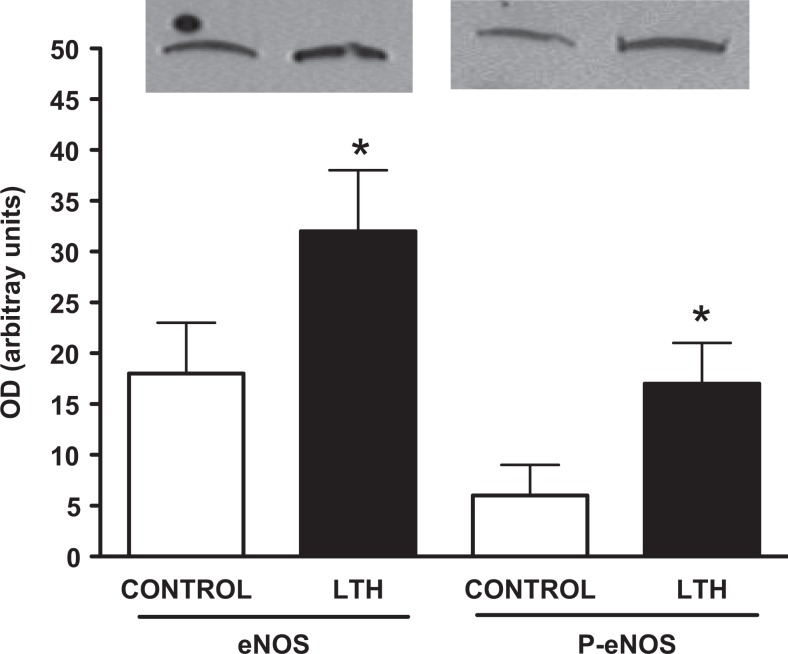
Development under conditions of LTH resulted in a significant (P < .05) elevation in mRNA for eNOS compared to control fetuses (Figure 1A). Levels of mRNA for iNOS (Figure 1B) and nNOS (Figure 1C) were ∼10-fold less abundant compared to eNOS. Levels of mRNA for iNOS were higher in LTH compared to control fetal perirenal adipose (P < .05) while nNOS mRNA levels were similar between the 2 groups. Protein levels of eNOS were also significantly (P < .05) elevated in the perirenal adipose of LTH fetuses compared to control fetuses as were levels of phosphorylated serine 1177-eNOS (P < .05; Figure 2). The ratios of phosphorylated eNOS to eNOS were similar between LTH and control perirenal adipose indicating that the increased phosphorylation state reflected increases in eNOS protein rather than signaling pathways governing eNOS activation.
Figure 1.
Quantity of mRNA for eNOS (1A), iNOS (1B), and nNOS (1C) in perirenal adipose of late gestation control (CONT) and long-term hypoxic (LTH) fetal sheep. eNOS mRNA was approximately 10-fold more abundant compared to iNOS or nNOS. Both eNOS and iNOS mRNA were significantly elevated (P < .05) in the perirenal adipose of the LTH fetus. (n = 6 per group; mean ± SEM). eNOS indicates endothelial cell nitric oxide synthase; mRNA, messenger RNA; SEM, standard error of the mean.
Figure 2.
Western analysis for eNOS and phosphorylated serine 1177 eNOS in long-term hypoxic (LTH) and control (CONT) late gestation fetal sheep. Both eNOS and phosphorylated eNOS were significantly (P < .05) higher in the perirenal adipose of LTH fetuses. A representative sample for controls and LTH for both eNOS and phospho-eNOS are provided for comparison. eNOS indicates endothelial cell nitric oxide synthase.
NRF-1, NRF-2, and mtTFA and COX-I, II, and IV mRNA
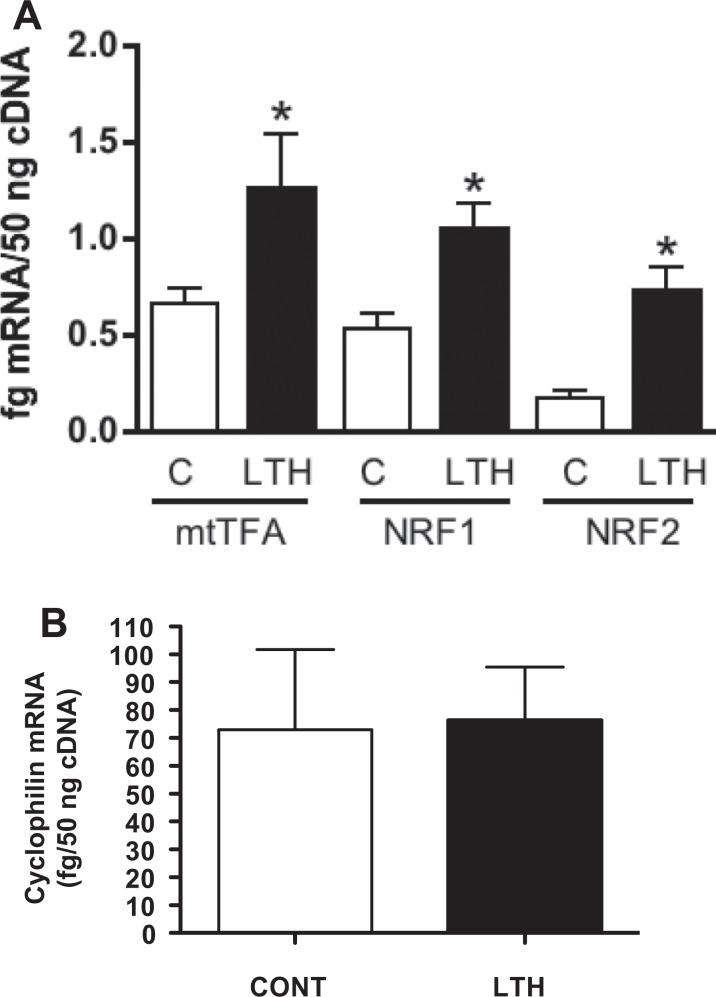
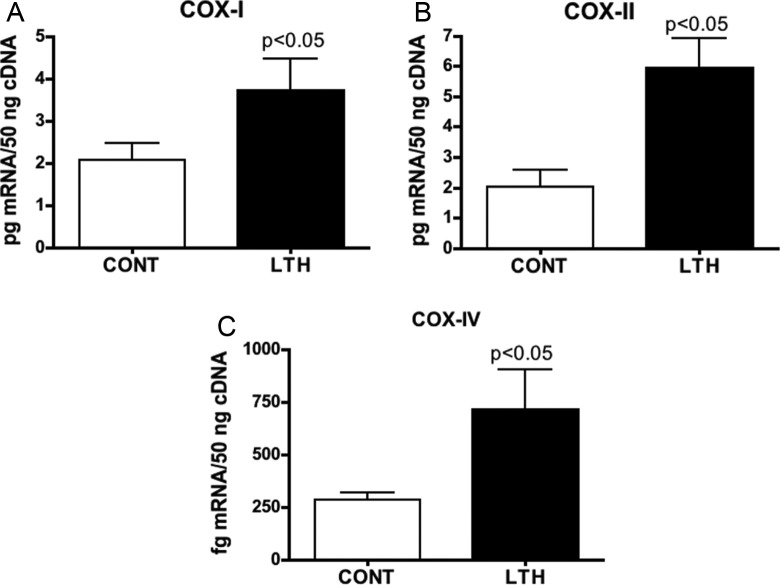
Concentrations of mRNA for both NRF-1 and NRF-2 were significantly (P < .05) elevated in LTH compared to control perirenal adipose (Figure 3A). Similarly, concentrations of mRNA for mtTFA were elevated in the perirenal adipose of LTH fetal sheep (P < .05; Figure 3A). Messenger RNA for the mitochondrial genes, COX-I and COX-II, as well as the nuclear COX-IV were elevated (P < .05) in the perirenal adipose of LTH fetal sheep (Figure 4A-C). The LTH had no effect on mRNA for the housekeeping gene, cyclophilin, in adipose tissue compared to controls (Figure 3B).
Figure 3.
Quantity of mRNA for mtTFA, NRF-1, and NRF-2 (Figure 3A) in perirenal adipose of late gestation control (CONT) and long-term hypoxic (LTH) fetal sheep. All 3 transcription factors were significantly elevated (*P < .05) in the perirenal adipose of the LTH fetus. Messenger RNA for the housekeeping gene, cyclophilin (Figure 3B), was not different between the 2 groups. (n = 6 per group; mean ± SEM). mtTFA indicates mitochondrial transcription factor A; NRF, nuclear respiratory factor; SEM, standard error of the mean.
Figure 4.
Quantity of mRNA for COX-I (A), COX-2 (B), and COX-IV (C) in perirenal adipose of late gestation control (CONT) and long-term hypoxic (LTH) fetal sheep. All 3 cytochrome oxidases were significantly elevated (*P < .05) in the perirenal adipose of the LTH fetus. (n = 6 per group; mean ± SEM). COX indicates cytochrome c oxidase; SEM, standard error of the mean.
Mitochondrial and Chromosomal DNA and Cellular Proliferation Markers
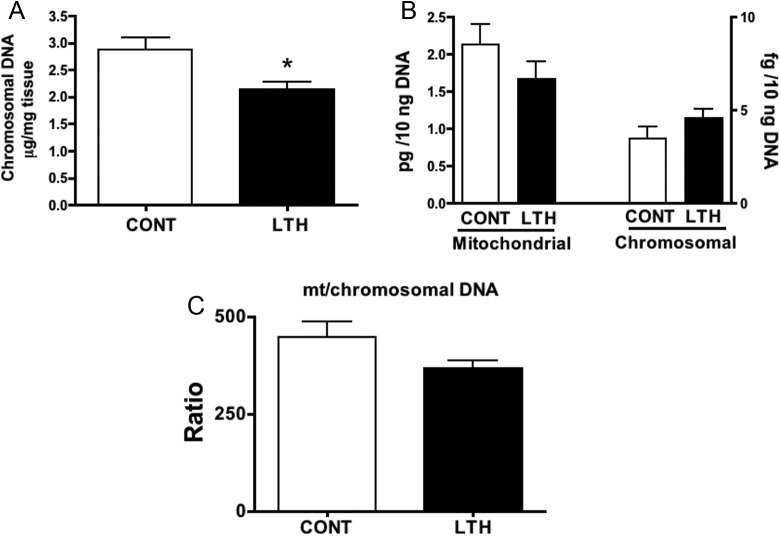
Levels of chromosomal DNA on a per gram wet weight basis were lower in the perirenal adipose of LTH fetuses compared to control fetuses (Figure 5A). When comparing mitochondrial DNA and chromosomal DNA based on total DNA input, there were no differences between LTH and control perirenal adipose, and the ratio of mitochondrial: chromosomal DNA was not different between the 2 groups (Figure 5B and C). Messenger RNA levels for both Ki67 and PCNA were significantly (P < .05) lower in perirenal adipose from LTH fetuses compared to control fetuses indicative of lower levels of cellular proliferation (Figure 6).
Figure 5.
Chromosomal DNA content (μg DNA/mg tissue) in perirenal adipose obtained from control (CONT) and long-term hypoxic (LTH) late gestation fetal sheep (A). Chromosomal DNA content was significantly (*P < .05) lower in the perirenal fat of LTH fetuses indicative of decreased cellularity. Mitochondrial and chromosomal DNA concentrations were not different in the perirenal adipose of CONT and LTH fetuses (5B) nor were the ratios of mitochondrial (mt) to chromosomal DNA (C), indicative of similar mitochondrial numbers in the 2 groups. (n = 6 per group; mean ± SEM). SEM indicates standard error of the mean.
Figure 6.
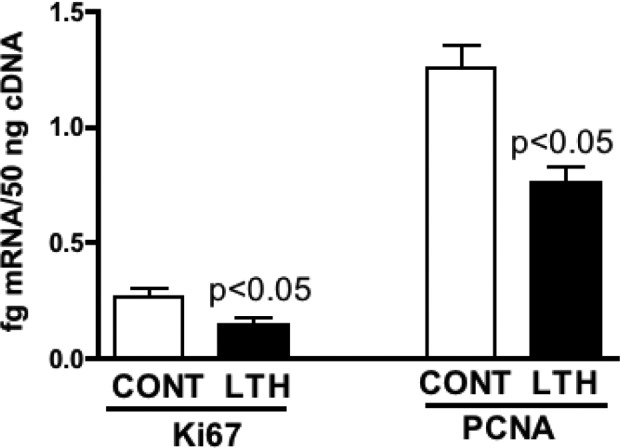
Quantity of mRNA for 2 markers for cell division (Ki67 and PCNA) were significantly lower (*P < .05) in the perirenal adipose of the late gestation LTH fetus (n = 6 per group; mean ± SEM). mRNA indicates messenger RNA; SEM, standard error of the mean; PCNA, proliferating cell nuclear antigen.
Locule Size and Distribution
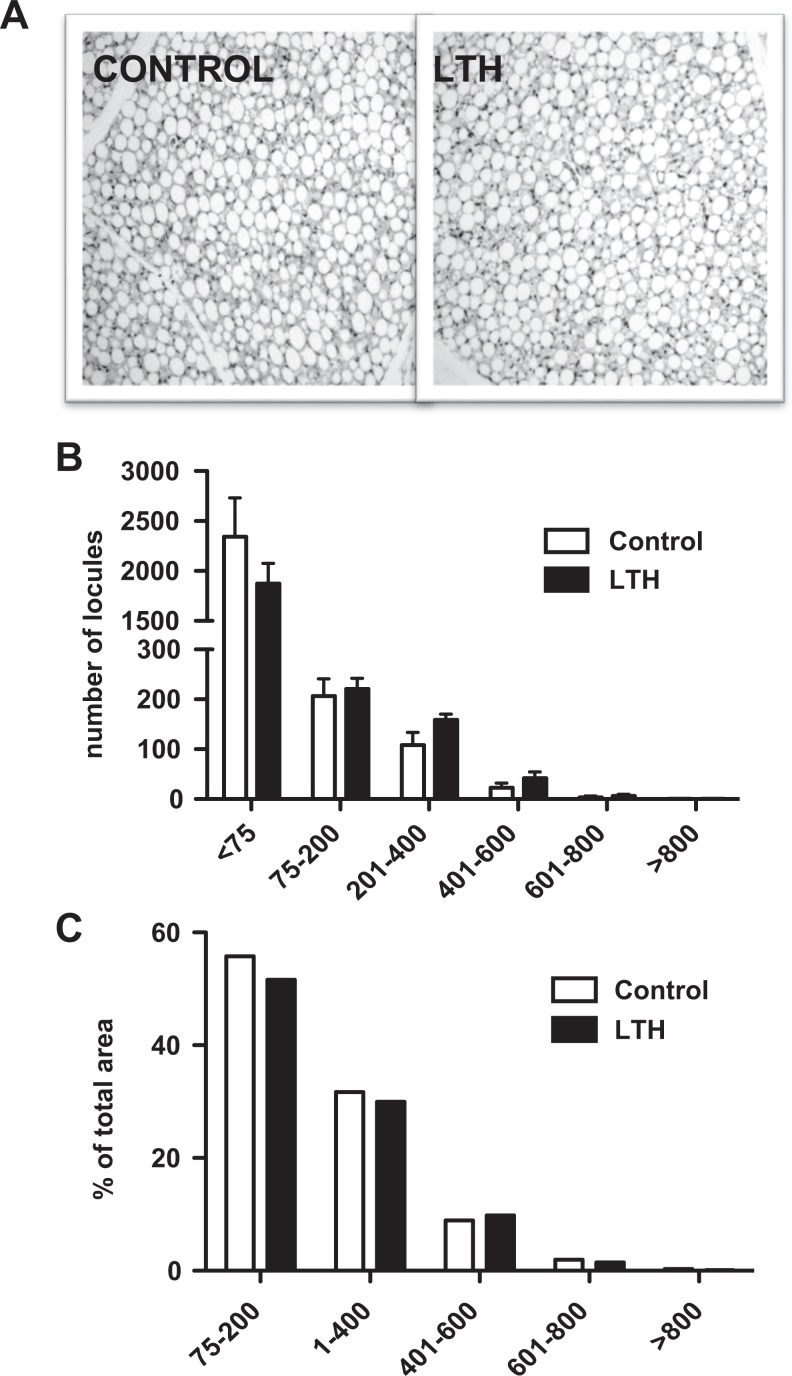
Figure 7A illustrates the uni- and multilocular makeup of the perirenal adipose tissue from control and LTH fetuses. In both groups, the largest number of dominant locules was in the >75 μmol/L2 category (Figure 7B) but there was no difference in the locule number between control and LTH tissues. Likewise, the percentage of locule area occupied by each locule size category did not differ between groups (Figure 7C).
Figure 7.
Hematoxylin and eosin staining of perirenal adipose tissue from control and long-term hypoxic (LTH) fetuses (A; 20× magnification). No differences were observed in the number of dominant locules by locular area (μmol/L2; B) or percentage of total locular area (C) between control and LTH perirenal adipose samples.
Discussion
We previously reported that the perirenal adipose of the late gestation LTH fetus has increased expression of a variety of genes consistent with an increase in the brown fat phenotype of this tissue, including UCP1, a mitochondrial protein integral in nonshivering thermogenesis in the newborn. PGC1α, a master regulator of the brown fat phenotype, was also increased in fetal adipose in the late gestation LTH fetus providing a potential mechanism via which LTH alters expression of a cassette of genes governing the differentiation and function of this important tissue. Previous studies in sheep have also identified a fundamental role for the exponential rise in fetal plasma cortisol during late gestation in the attainment of the brown fat phenotype of fetal perirenal adipose.29 Although LTH does not alter the ontogenic increase in fetal plasma cortisol during late gestation, we did observe a significant increase in expression of both HSD11B1 and DIO2 in the perirenal adipose of LTH fetuses. Thus, enhanced local cortisol and T3 production may also promote the increased brown fat phenotype in the LTH fetal perirenal fat.
Since adaptive thermogenesis is based on uncoupling of the mitochondrial electron transport chain via UCP-1 and the well-noted observation that brown fat has elevated numbers of mitochondria compared to white adipose tissue,5,30 the present study focused on the question of whether or not LTH increased indices of mitochondrial biogenesis and/or expression of both nuclear and mitochondrial genes that support mitochondrial function. It was noted in mice that eNOS played an important role in mitochondrial biogenesis in brown fat and that the role of eNOS was upstream from PGCα1.19 We found that eNOS was the major NOS isoform expressed in the perirenal adipose of both LTH and control fetuses during late gestation. Expression of eNOS (both mRNA and protein) and phosphorylated eNOS (Ser 1177) were elevated in the perirenal adipose of the late gestation LTH fetus. However, the ratio of eNOS to phospho-eNOS was similar indicating that the increased phosphorylation of eNOS reflected the increased expression of this NO synthase and not upstream signaling pathways and/or kinase activity that phosphorylates eNOS.
In mouse brown adipocytes, NO generation is associated with increased expression of PGC1α, as well as NRF-1 and mtTFA, and that cGMP likely mediates the effects of NO on this expression.19 We previously reported increased expression of PGC1α, which, in turn, has been shown to increase expression of NRF-1 and mtTFA. In the present study, we observed elevated expression of NRF-1, NRF-2, and mtTFA, key transcription factors governing expression of both genomic and mitochondrial genes necessary for mitochondrial function, including both mitochondrial (COX-I and COX-II) and nuclear (COX-IV) cytochrome oxidases in the perirenal adipose of late gestation LTH fetuses. As anticipated from the observed increase in NRF-1 and mtTFA, COX-I, II, and IV expression was increased as well.
Considering that PGC1α and mtTFA also govern mitochondrial DNA synthesis and biogenesis, we addressed mitochondrial DNA content relative to nuclear DNA. Surprisingly, despite other indicators of enhanced mitochondrial biogenesis (increased expression of COX-I, COX-II, and COX-IV), we noted no differences in the quantity and/or ratio of mitochondrial to nuclear DNA in the perirenal adipose between control and LTH fetal sheep. We did find that per gram input of perirenal adipose tissue that the amount of nuclear DNA was less in the LTH fetuses indicative of a decreased cellularity. Commensurate with these observations, expression of 2 markers for cellular division, Ki67 and PCNA, were significantly lower in the perirenal adipose of the late gestation LTH fetus. We also found that the locule size and distribution in the perirenal adipose are similar between control normoxic and LTH fetuses. However, there could be a decrease in cellularity, either through reduced recruitment of additional preadipocytes or other cell types supporting adipose function such as endothelial cells. An additional hallmark of brown fat is an increased vascular supply compared to other nonthermogenic (white fat) deposits.
Although we did not find an increase in mitochondrial DNA, the increase in cytochrome oxidases as well as the transcription factors governing mitochondrial function (mtTFA and NRF-1 and NRF-2) implicates an enhanced thermogenic potential of LTH perirenal adipose. Further, mitochondrial fusion may also be increased in the LTH fetal perirenal adipose that would enhance the thermogenic potential of this tissue; however, we did not attempt to isolate mitochondria or perform electron microscopy to pursue this possibility. The increased brown fat phenotype (eg, UCP-1, PGC1a, COX-I, II, and IV) observed in the perirenal fat in response to LTH, and thus enhanced potential for thermogenesis or energy expenditure from this tissue at birth seems paradoxical considering the hypoxic state in which oxygen is limiting. However, Nisoli et al31 reported that caloric restriction in mice was accompanied with increased mitochondrial biogenesis in various tissues, including adipose, as well as oxygen consumption. This too seems counterintuitive since energy substrate in caloric restriction is limited. However, enhanced mitochondrial biogenesis is associated with increased β-oxidation of fats as an energy source and thus in the LTH fetus, enhanced mitochondrial function may be a means of preparing the fetuses to use perirenal fat as an energy source postbirth. Further, Nisoli et al31 noted that NO was a key player in the increased mitochondrial biogenesis in response to caloric restriction.
In the LTH fetus, the increased brown fat phenotype of perirenal fat we have previously reported as well as the findings of the present study are likely due to the hypoxic environment and not cold activation. The lower critical temperature (LCT) is the air temperature at which a homeotherm must increase its heat production to prevent hypothermia. At some temperature below the LCT, animals experience a drop in body temperature. The ewe’s body temperature would have to drop first in order for the fetus to observe a decrease in body temperature. For a sheep on full feed, the LCT is −20°C.32 The average daytime temperature at White Mountain Climate Station No. 2 (ie, the Barcroft facility at 3800m) is 11.1°C while the nighttime temperature is 1.1°C for the summer months that the ewes are maintained at the station. Thus, the ewes are 20° to 30°C above their LCT. Thus, the changes in gene expression we have observed in the perirenal fat in the LTH fetus are the result of LTH and not a cold stimulus due to a decrease in environmental temperature.
There has been recent debate about whether or not the perirenal adipose of larger mammalian fetuses such as sheep or humans reflects a true BAT per se, or is a fetal version of the recently described “beige” adipose.1 Indeed, unlike true BAT (eg, suprascapular), fetal perirenal adipose exhibits characteristics of not only BAT but that of white adipose tissue (WAT).33,34 The beiging of WAT in response to thermogenic stimuli refers to the noted induction of UCP-1 and other genes of BAT (eg, DIO2 and PGC1α) in white adipose. It still remains unclear if the beiging response is due to the transdifferentiation of white adipocytes to beige adipocytes or via the induction of so-called brown-in-white (BRITE) adipocytes that reside within WATs. The noted dramatic loss of the BAT phenotype in perirenal adipose during the first 7 days postbirth in lambs, while retaining and expanding the WAT phenotype support the concept that this fat deposit is not a true BAT, but rather a “beiged” WAT deposit.1 Thus, our findings that LTH induces PGC1α, NRF-1/2, and mtTFA but not indices of increased mitochondrial biogenesis would support that fetal perirenal adipose is a WAT deposit that does not respond to these factors in a manner reflective of BAT.
Clearly, fetal perirenal adipose tissue represents a unique adipose deposit by virtue of its ability to express a robust BAT phenotype. Considering the potential for BAT or beige fat induction in adults as a means of ameliorating obesity and metabolic disorders, understanding the means via which BAT genes in perirenal adipose are induced may provide a way to reinduce their expression in adults to combat the obesity epidemic.
Footnotes
Declaration of Conflicting Interests: The author(s) declared no potential conflicts of interest with respect to the research, authorship, and/or publication of this article.
Funding: The author(s) disclosed receipt of the following financial support for the research, authorship, and/or publication of this article: (Supported by NIH HD31226 and HD33147).
References
- 1. Pope M, Budge H, Symonds ME. The developmental transition of ovine adipose tissue through early life. Acta Physiol (Oxf). 2014;210 (1):20–30. [DOI] [PubMed] [Google Scholar]
- 2. Poissonnet CM, Burdi AR, Garn SM. The chronology of adipose tissue appearance and distribution in the human fetus. Early Hum Dev. 1984;10 (1-2):1–11. [DOI] [PubMed] [Google Scholar]
- 3. Clarke L, Buss DS, Juniper DT, Lomax MA, Symonds ME. Adipose tissue development during early postnatal life in ewe-reared lambs. Exp Physiol. 1997;82 (6):1015–1027. [PubMed] [Google Scholar]
- 4. Aquila H, Link TA, Klingenberg M. The uncoupling protein from brown fat mitochondria is related to the mitochondrial adp/atp carrier. Analysis of sequence homologies and of folding of the protein in the membrane. EMBO J. 1985;4 (9):2369–2376. [DOI] [PMC free article] [PubMed] [Google Scholar]
- 5. Cannon B, Nedergaard JAN. Brown adipose tissue: Function and physiological significance. Physiol Rev. 2004;84 (1):277–359. [DOI] [PubMed] [Google Scholar]
- 6. Nicholls DG, Locke RM. Thermogenic mechanisms in brown fat. Physiol Rev.1984;64 (1):1–64. [DOI] [PubMed] [Google Scholar]
- 7. Jouppila P, Kirkinen P. Umbilical vein blood flow as an indicator of fetal hypoxia. Br J Obstet Gynaecol. 1984;91 (2):107–110. [DOI] [PubMed] [Google Scholar]
- 8. Kingdom JC, Kaufmann P. Oxygen and placental villous development: Origins of fetal hypoxia. Placenta. 1997;18(8):613–621; discussion 623-616. [DOI] [PubMed] [Google Scholar]
- 9. Siu SC, Colman JM, Sorensen S, et al. Adverse neonatal and cardiac outcomes are more common in pregnant women with cardiac disease. Circulation. 2002;105 (18):2179–2184. [DOI] [PubMed] [Google Scholar]
- 10. Siu SC, Sermer M, Colman JM, et al. Prospective multicenter study of pregnancy outcomes in women with heart disease. Circulation. 2001;104 (5):515–521. [DOI] [PubMed] [Google Scholar]
- 11. Sheffer-Mimouni G, Mimouni FB, Dollberg S, Mandel D, Deutsch V, Littner Y. Neonatal nucleated red blood cells in infants of overweight and obese mothers. J Am Coll Nutr. 2007;26 (3):259–263. [DOI] [PubMed] [Google Scholar]
- 12. Danielson L, McMillen IC, Dyer JL, Morrison JL. Restriction of placental growth results in greater hypotensive response to alpha-adrenergic blockade in fetal sheep during late gestation. J Physiol. 2005;563 (pt 2):611–620. [DOI] [PMC free article] [PubMed] [Google Scholar]
- 13. Gagnon R, Challis J, Johnston L, Fraher L. Fetal endocrine responses to chronic placental embolization in the late-gestation ovine fetus. Am J Obstet Gynecol.1994;170 (3):929–938. [DOI] [PubMed] [Google Scholar]
- 14. Socol ML, Manning FA, Murata Y, Druzin ML. Maternal smoking causes fetal hypoxia: Experimental evidence. Am J Obstet Gynecol.1982;142 (2):214–218. [DOI] [PubMed] [Google Scholar]
- 15. Moore LG, Charles SM, Julian CG. Humans at high altitude: Hypoxia and fetal growth. Respir Physiol Amp Neurobiol. 2011;178 (1):181–190. [DOI] [PMC free article] [PubMed] [Google Scholar]
- 16. Myers DA, Ducsay CA. Adrenocortical and adipose responses to high-altitude-induced, long-term hypoxia in the ovine fetus. J Pregnancy. 2012;2012:681306. [DOI] [PMC free article] [PubMed] [Google Scholar]
- 17. Myers DA, Hanson K, Mlynarczyk M, Kaushal KM, Ducsay CA. Long-term hypoxia modulates expression of key genes regulating adipose function in the late-gestation ovine fetus. Am J Physiol Regul Integr Comp Physiol. 2008;294:R1312–R1318. [DOI] [PubMed] [Google Scholar]
- 18. Ducsay CA, Newby E, Cato C, Singleton K, Myers DA. Long term hypoxia during gestation alters perirenal adipose tissue in the lamb: a trigger for adiposity? J Dev Origins Health Dis. 2013;4(suppl 2):DOHaD13–1194, s62. [Google Scholar]
- 19. Nisoli E, Clementi E, Paolucci C, et al. Mitochondrial biogenesis in mammals: the role of endogenous nitric oxide. Science. 2003;299 (5608):896–899. [DOI] [PubMed] [Google Scholar]
- 20. Monau TR, Vargas VE, King N, Yellon SM, Myers DA, Ducsay CA. Long-term hypoxia increases endothelial nitric oxide synthase expression in the ovine fetal adrenal. Reprod Sci. 2009;16 (9):865–874. [DOI] [PMC free article] [PubMed] [Google Scholar]
- 21. Monau TR, Vargas VE, Zhang L, Myers DA, Ducsay CA. Nitric oxide inhibits acth-induced cortisol production in near-term, long-term hypoxic ovine fetal adrenocortical cells. Reprod Sci. 2010;17 (10):955–962. [DOI] [PMC free article] [PubMed] [Google Scholar]
- 22. Williams JM, White CR, Chang MM, Injeti ER, Zhang L, Pearce WJ. Chronic hypoxic decreases in soluble guanylate cyclase protein and enzyme activity are age dependent in fetal and adult ovine carotid arteries. J Appl Physiol. 2006;100 (6):1857–1866. [DOI] [PubMed] [Google Scholar]
- 23. Ducsay CA, Furuta K, Vargas VE, et al. Leptin receptor antagonist treatment ameliorates the effects of long-term maternal hypoxia on adrenal expression of key steroidogenic genes in the ovine fetus. Am J Physiol Regul Integr Comp Physiol. 2013;304 (6):R435–R442. [DOI] [PMC free article] [PubMed] [Google Scholar]
- 24. Ducsay CA, Hyatt K, Mlynarczyk M, Root BK, Kaushal KM, Myers DA. Long-term hypoxia modulates expression of key genes regulating adrenomedullary function in the late gestation ovine fetus. Am J Physiol Regul Integr Comp Physiol. 2007;293 (5):R1997–R2005. [DOI] [PubMed] [Google Scholar]
- 25. Myers DA, Bell PA, Hyatt K, Mlynarczyk M, Ducsay CA. Long-term hypoxia enhances proopiomelanocortin processing in the near-term ovine fetus. Am J Physiol Regul Integr Comp Physiol. 2005;288 (5):R1178–R1184. [DOI] [PubMed] [Google Scholar]
- 26. Myers DA, Hyatt K, Mlynarczyk M, Bird IM, Ducsay CA. Long-term hypoxia represses the expression of key genes regulating cortisol biosynthesis in the near-term ovine fetus. Am J Physiol Regul Integr Comp Physiol. 2005;289 (6):R1707–R1714. [DOI] [PubMed] [Google Scholar]
- 27. Ducsay CA, Hyatt K, Mlynarczyk M, Kaushal KM, Myers DA. Long-term hypoxia increases leptin receptors and plasma leptin concentrations in the late-gestation ovine fetus. Am J Physiol Regul Integr Comp Physiol. 2006;291:R1406–R1413. [DOI] [PubMed] [Google Scholar]
- 28. Yuen BS, Owens PC, Muhlhausler BS, et al. Leptin alters the structural and functional characteristics of adipose tissue before birth. FASEB J. 2003;17 (9):1102–1104. [DOI] [PubMed] [Google Scholar]
- 29. Mostyn A, Pearce S, Budge H, et al. Influence of cortisol on adipose tissue development in the fetal sheep during late gestation. J Endocrinol. 2003;176 (1):23–30. [DOI] [PubMed] [Google Scholar]
- 30. Cannon B, Nedergaard J. Studies of thermogenesis and mitochondrial function in adipose tissues. Methods Mol Biol. 2008;456:109–121. [DOI] [PubMed] [Google Scholar]
- 31. Nisoli E, Tonello C, Cardile A, et al Calorie restriction promotes mitochondrial biogenesis by inducing the expression of enos. Science. 2005;310 (5746):314–317. [DOI] [PubMed] [Google Scholar]
- 32. Nicol AM, Young BA. Effect of feed temperature on cold susceptibility of cattle and sheep. Can J Anim Sci. 1990;70 (1):191–197. [Google Scholar]
- 33. Casteilla L, Forest C, Robelin J, Ricquier D, Lombet A, Ailhaud G. Characterization of mitochondrial-uncoupling protein in bovine fetus and newborn calf. Am J Physiol Endocrinol Metab. 1987;252 (5 pt 1):E627–E636. [DOI] [PubMed] [Google Scholar]
- 34. Devaskar SU, Anthony R, Hay W., Jr Ontogeny and insulin regulation of fetal ovine white adipose tissue leptin expression. Am J Physiol Regul Integr Comp Physiol. 2002;282 (2):R431–R438. [DOI] [PubMed] [Google Scholar]


