

Abstract
Background:
Macrosomia is defined as an infant’s birth weight of more than 4000 g. Although microRNAs (miRNAs) have been implicated in the pathogenesis of various diseases, the associations between serum miRNAs and macrosomia have been rarely reported.
Methodology:
We used the Taqman Low Density Array followed by quantitative reverse transcriptase polymerase chain reaction assays to screen for miRNAs associated with macrosomia using serum samples collected 1 week before delivery.
Results:
Profiling results showed that 1 miRNA was significantly upregulated and 10 miRNAs were significantly downregulated in serum samples of macrosomia (ΔΔCt > 3-fold). The expression levels of miR-21 were significantly decreased in macrosomia as compared to the controls in the third trimester. Receiver operating characteristic (ROC) curve analyses showed that the area under the ROC curve for miR-21 was 67.7% (sensitivity = 66.7% and specificity = 70.0%).
Conclusions:
miR-21 in maternal serum is differentially expressed between macrosomia and controls, and miR-21 could be used as a candidate biomarker to predict macrosomia.
Keywords: microRNA, serum, macrosomia, TLDA, biomarker
Introduction
Macrosomia is defined as an infant’s birth weight of more than 4000 g at term due to excessive intrauterine fetal growth occurrence. It has been reported that the incidence rate of macrosomia is 7.83% in 2005 in Southeast China and is 6.5% in 2006 in China, respectively.1 Furthermore, the rapid increase in the rate of macrosomia is a worldwide problem,2 and macrosomia is a challenge in current obstetrics. Fetal macrosomia is associated with increased risk of complications both for the mother and the newborn. Macrosomia is associated with higher rates of cesarean section2 and sequential use of vacuum and obstetric forceps for vaginal delivery for the mother.3 In addition, the association between macrosomia and subsequent obesity in the offspring also has been confirmed.4 Increasing prevalence of obesity in women and offspring overweight/obesity in many parts of the world could be associated with a parallel increase in macrosomic births. In China, from 1992 to 2010, the prevalence of overweight in women aged 18 to 44 years increased from 16.8% to 26.4%, and that of obesity increased from 3.1% to 9.0%, respectively.5 Meanwhile, the prevalence of overweight and obesity among Chinese children and adolescents has increased steadily from 5.2% in 1991 to 13.2% in 2006.6 It is a vicious circle.
The causes of macrosomia include both genetic and environmental factors. Previous research focused on the rapid increase in the prevalence of macrosomia has identified the underlying environmental factors such as prenatal nutrients, maternal body mass index (BMI) at early pregnancy, and gestational weight gain.7-10
In recent years, more and more evidence has supported that the intrauterine environment is critical in “programming” the fetus, leading to diverse health and disease outcomes throughout its life.11 The intrauterine environment can influence gene expression, resulting into epigenetic alterations.12
MicroRNAs (miRNAs) are short (19-25 nucleotides), single-stranded, and nonprotein-coding RNAs that regulate gene expression by binding to the 3′-untranslated region of the target messenger RNAs (mRNAs) and function in diverse biological processes, including development, differentiation, apoptosis, and oncogenesis.13 It is an important epigenetic regulatory mechanism. Growing evidence indicates that miRNAs are involved in the pathogenesis of gestational diabetes mellitus (GDM),14 preeclampsia, and intrauterine growth restriction.15 Our previous research had found that the levels of placental miR-21 was upregulated in macrosomia.16 These studies suggest that miRNAs may serve as clinical biomarkers for pregnancy’s complication.
After the initial identification of serum miRNAs in 2008,17 several studies have shown that miRNAs present in human serum/plasma can predict the prognosis of diseases, such as nonsmall-cell lung cancer,18 breast cancer,19and GDM, and so on. But few studies have investigated the relationship between the levels of circulating miRNAs in pregnant woman and macrosomia.
To develop this novel class of markers for clinical use and to investigate the detailed pathogenic mechanism of macrosomia, we systematically screened serum miRNAs associated with macrosomia using the Taqman Low Density Array (TLDA) chips followed by individual quantitative reverse transcriptase polymerase chain reaction (qRT-PCR) assays. The aim of the present study was to explore the possibility of using a class of serum miRNAs as biomarkers for the prediction of macrosomia.
Methods
Ethics Statement
The study was approved by the Human Research Ethics Committees of Changzhou Maternity and Child Health Care Hospital Affiliated to Nanjing Medical University. Written informed consent was obtained from every patient and control individual before blood was taken.
Study Design
We designed a retrospective nest case–control study to determine whether serum miRNAs profiling could predict macrosomia. Partial pregnant women provided blood samples when they received prenatal care in the time frame of 16 to 20 gestational weeks and 1 week before delivery in Changzhou Maternity and Child Health Care Hospital Affiliated to Nanjing Medical University. These pregnant women were divided into 2 groups according to neonates’ birth weight .The neonates with macrosomia were defined as those with birth weight equal to or greater than 4000 g in this study. Those neonates with birth weight between 2500 and 4000 g were classified as controls. The mothers had no diabetes during pregnancy, confirmed by negative results of oral glucose tolerance test of 75 g in 24th to 28th week of pregnancy. The mothers in this study had no smoking during pregnancy. Exclusion criteria also included multiple gestation, preterm labor, preeclampsia, and other complications during pregnancy. To control sample heterogeneity, cases and controls were frequency matched for pregnant women’s age, BMI before pregnancy, gestational age, and infant gender in this study. Medical records were used to obtain information on risk factors, pregnancy history, and perinatal outcome by using a self-defined questionnaire.
We first collected the blood samples, 1 week before delivery, from 60 pregnant women with macrosomia and 60 pregnant women with normal birth weight from September 1, 2011 to June 30, 2012. Among these participants, the blood samples collected in the period of 16 to 20 gestational weeks of 30 pairs of women with either macrosomic pregnancy or normal pregnancy were found in the biobank. Second, we collected blood samples in early second trimester from 30 pairs of women either with normal pregnancy or with macrosomia.
This study comprised of 3 case–control studies. At discovery stage, we performed miRNA profiling using TLDA chips in 2 pooled samples from 30 cases and 30 controls, respectively. Individual qRT-PCR was conducted for the discovery phase samples to further filter signals of the screened miRNAs due to heterogeneity in the participants. Subsequently, a 2-stage validation study (qRT-PCR of selected miRNAs), including an expanded sample validation and base upon early second-trimester serum sample validations, was conducted to confirm the results from the discovery stage (Figure 1).
Figure 1.

Schematic diagram of the workflow of this study. TLDA indicates TaqMan Low Density Array; qRT-PCR, quantitative reverse-transcriptase PCR assay; ROC, receiver operating characteristic curve.
Samples
Venous blood samples (fasting; 5.0 mL per pregnant women) were collected from cases and controls during prenatal care in Changzhou Maternity and Child Health Care Hospital affiliated to Nanjing Medical University using procoagulant drying tube. The whole blood was separated into serum and cellular fractions by centrifugation at 4000 rpm for 10 minutes, followed by 12 000 rpm for 15 minutes to completely remove cell debris. The supernatant serum was stored at −80°C until analysis.
RNA Extraction
Total RNA containing small RNA was extracted from serum samples using the miRVana PARIS Kit (Applied Biosystems Inc, California) according to the manufacturer’s protocol. To control sample to serum variability during the RNA extraction and/or purification procedures, after the initial denaturizing step, we spiked-in synthetic C.elegans miR-39 (cel-mir-39; Takara, Japan) to a final concentration of 10−4 pmol/μL.
Taqman Low Density Array Chip Assays and qRT-PCR
In the discovery stage, we used TLDA chips (human microRNA panel V2.0, Applied Biosystems Inc) to screen differentially expressed miRNAs from the 2 pooled samples. A total of 600 μL serum from each pooled samples was used. Megaplex RT reactions and preamplification reactions were run according to the manufacturer’s instructions. Then, 75 μL 0.1× Tris-EDTA was added to dilute the PreAmp product. A 9 μL diluted PreAmp product was used to run the RT-PCR reactions by dispensing 100 mL of the PCR reaction mix into each port of the TaqMan MicroRNA Array. The default PCR procedure was used and the analysis was performed using RQ manager software (Applied Biosystems Inc). According to our laboratory experience by testing large sample, we selected cel-miR-39 as a normalizer in miRNA expression experiment.14,20
ΔCT and ΔΔCT were calculated using the following mathematical formula:
ΔCT = CTsample − CTcel-miR-39, ΔΔCT = ΔCT case − ΔCT control. A miRNA was considered altered if CT < 35 in the one of the 2 groups and |ΔΔCT| > 2, meaning 4-fold altered expression between the macrosomia and control groups.
We used TaqMan microRNA probes (Applied Biosystems Inc) to perform qRT-PCR assays according to the manufacturer’s protocol. Equal volume of serum sample was processed in each step from serum purification to qRT-PCR. The total RNA was reversely transcribed to complementary DNA using TaqMan microRNA RT Kit and stem-loop RT primers (Applied Biosystems Inc). We performed RT-PCR by the TaqMan PCR kit on the ABI 7900 Real-Time PCR System (Applied Biosystems Inc). The reactions were initiated in a 384-well optical plate at 95°C for 5 minutes, followed by 40 cycles of 95°C for 15 seconds and 60°C for 1 minute. The sample numbers of cases and controls were same on each plate (number of cases and controls displayed in Figure 1). The RT-PCR was examined for target miRNAs and cel-miR-39 simultaneously. All reactions were run in triplicate. The CT values were determined using the fixed threshold settings. The relative expression levels of target miRNAs were determined by the equation 2−ΔCT, in which ΔCT = CT sample − CT cel-39.
Statistical Analysis
Group comparisons of basic characteristics were performed using the Student t test or the Wilcoxon rank sum test, as appropriate. Simple and multiple logistic regression models were used for analyses. The area under the curve (AUC) was calculated for miRNAs, in order to assess the miRNAs on macrosomia predicting. All analyses were performed with Stata 10.0 (Stata Corp, College Station, Texas). A P value of < .05 was considered statistically significant.
Results
Characteristics of the Sample Population
We selected serum samples 1 week before delivery and early second-trimester of maternal for this prospectively planned miRNA-biomarker study. About 30 pairs of serum samples were analyzed for the TLDA chip screening and individual qRT-PCR, another 30 pairs of serum samples 1 week before delivery, and 30 pairs of serum samples early second-trimester were detected to further confirm the results.
Two groups were well matched on maternal age, BMI before pregnancy, gestational weeks, and infant gender in this study. Study population characteristics are described in Table 1.
Table 1.
Characteristics of the Study Population.a
| Variable | Discovery Stage Validation I (Blood Samples 1 Week Before Delivery) | Validation II (Blood Samples 1 Week Before Delivery) | Validation III (Blood Samples Early Second trimester) | |||||||||
|---|---|---|---|---|---|---|---|---|---|---|---|---|
| Case (n = 30) | Control (n = 30) | t | P | Case (n = 60) | Control (n = 60) | t | P | Case (n = 30) | Control (n = 30) | t | P | |
| Age, years | 26.767 ± 2.825 | 27.167 ± 2.628 | −0.568 | .572 | 26.95 ± 2.971 | 27.117 ± 2.823 | −0.315 | .753 | 26.467 ± 2.488 | 26.933 ± 2.572 | −0.714 | .478 |
| BMI before pregnancy, kg/m2 | 21.255 ± 2.541 | 21.052 ± 2.386 | 0.32 | .751 | 21.208 ± 2.364 | 21.105 ± 2.343 | 0.239 | .811 | 21.014 ± 2.255 | 20.989 ± 2.221 | 0.043 | .966 |
| Gestational week, w | 39.703 ± 0.861 | 39.397 ± 0.805 | 1.425 | .16 | 39.5 ± 0.865 | 39.277 ± 0.798 | 1.47 | .144 | 39.4 ± 0.817 | 39.19 ± 0.713 | 1.061 | .293 |
Abbreviation: BMI, body mass index.
a t test was used to examine difference in continuous variables. P < .05, significant differences from controls. The mothers had no cigarette smoking during pregnancy. Both patients and controls are cesarean section. To control sample heterogeneity, cases and controls were frequency matched for pregnant women’s age, BMI before pregnancy, gestational age, and infant gender in this study.
Micro RNA TLDA Chip Data Analysis
In all participants, 32 miRNAs showed ΔΔCt > 2-fold, which included 26 downregulated miRNAs and 6 upregulated miRNAs. A total of 11 miRNAs showed ΔΔCt > 3-fold, which included 10 downregulated miRNAs and 1 upregulated miRNA. ΔΔCt of miR-144 × (ΔΔCt = 2.953) is about 3-fold (Table 2).
Table 2.
Serum miRNA Expression in Macrosomia and Controls (TLDA Screening Results).a
| MicroRNA | Macrosomia | ΔCTa | Control | ΔCTb | ΔΔCTc |
|---|---|---|---|---|---|
| miR-122 | 33.531 | 7.345 | 26.706 | 2.162 | 5.183 |
| miR-923 | 34.313 | 8.127 | 27.573 | 3.029 | 5.098 |
| miR-25 | 34.175 | 7.989 | 28.511 | 3.967 | 4.022 |
| miR-20a | 32.208 | 6.022 | 26.839 | 2.295 | 3.727 |
| miR-223 | 25.917 | −0.269 | 20.597 | −3.947 | 3.678 |
| miR-132 | 34.481 | 8.295 | 29.197 | 4.653 | 3.642 |
| miR-192 | 32.575 | 6.389 | 27.393 | 2.849 | 3.54 |
| miR-451 | 33.306 | 7.12 | 28.171 | 3.627 | 3.493 |
| let-7b | 34.758 | 8.572 | 29.624 | 5.08 | 3.492 |
| miR-93 | 32.167 | 5.981 | 27.112 | 2.568 | 3.413 |
| miR-760 | 30.722 | 4.536 | 32.623 | 8.079 | −3.543 |
| miR-144* | 34.353 | 8.167 | 29.758 | 5.214 | 2.953 |
| miR-21 | 34.931 | 8.745 | 30.573 | 6.029 | 2.716 |
| miR-106a | 29.125 | 2.939 | 24.842 | 0.298 | 2.641 |
| miR-99b | 34.233 | 8.047 | 30.26 | 5.716 | 2.331 |
| miR-29a | 32.395 | 6.209 | 28.484 | 3.94 | 2.269 |
| miR-7-1* | 34.641 | 8.455 | 30.73 | 6.186 | 2.269 |
| miR-30c | 30.663 | 4.477 | 26.797 | 2.253 | 2.224 |
| let-7e | 34.563 | 8.377 | 30.704 | 6.16 | 2.217 |
| miR-200c | 33.93 | 7.744 | 30.076 | 5.532 | 2.212 |
| miR-142-3p | 33.04 | 6.854 | 29.199 | 4.655 | 2.199 |
| miR-19a | 33.142 | 6.956 | 29.354 | 4.81 | 2.146 |
| miR-30e* | 32.49 | 6.304 | 28.733 | 4.189 | 2.115 |
| miR-140-5p | 32.977 | 6.791 | 29.24 | 4.696 | 2.095 |
| miR-19b | 27.971 | 1.785 | 24.247 | −0.297 | 2.082 |
| miR-30a | 29.227 | 3.041 | 25.542 | 0.998 | 2.043 |
| miR-30b | 31.056 | 4.87 | 27.401 | 2.857 | 2.013 |
| miR-99b* | 31.357 | 5.171 | 32.447 | 7.903 | −2.732 |
| miR-526b* | 32.657 | 6.471 | 33.674 | 9.13 | −2.659 |
| miR-139-3p | 31.96 | 5.774 | 32.504 | 7.96 | −2.186 |
| miR-509-3p | 33.454 | 7.268 | 33.878 | 9.334 | −2.066 |
| miR-483-5p | 25.908 | −0.278 | 26.27 | 1.726 | −2.004 |
Abbreviations: TLDA, Taqman Low Density Array; miRNA, microRNA.
aΔCTa = CT case − CTcase- cel-39; ΔCTb = CT control − CTcontrol- cel-39; ΔΔCc = ΔCTa − ΔCTb; CTcase- cel -39 = 26.186; CTcontrol- cel-39 = 24.544. *, represents a way of naming of miRNA.
Validation Result of miRNA Gene Expression Using qRT-PCR
We selected 12 miRNAs with great than or equal to 3-fold of change for individual qRT-PCR analyses on 30 pairs of discovery-stage samples. As our previous research had found that the levels of placental miR-21 was upregulated in macrosomia, we are interested in serum miR-21 expression in macrosomia, we also added miR-21 to individual qRT-PCR analyses. MiR-21 (P = .011) and miR-20a (P = .015) showed significant differential expression between macrosomia and controls (Table 3 and Figure 2). The qRT-PCR results were concordant with the miRNA microarray results, although miR-132 and miR-760 did not pass in the first validation.
Table 3.
Results of 11 miRNAs in the Discovery Stage.a
| Macrosomia | Control | ΔΔCTb | Z | P c | |
|---|---|---|---|---|---|
| microRNA | median | median | |||
| miR-122 | 0.012 | 0.016 | 5.183 | 1.685 | .092 |
| miR-923 | 0.024 | 0.047 | 5.098 | 1.703 | .089 |
| miR-25 | 0.010 | 0.026 | 4.022 | 0.894 | .371 |
| miR-20a | 0.041 | 0.065 | 3.727 | 2.434 | .015d |
| miR-223 | 0.847 | 2.056 | 3.678 | 1.796 | .073 |
| miR-192 | 0.004 | 0.006 | 3.54 | 1.387 | .166 |
| miR-7b | 0.033 | 0.049 | 3.492 | 1.501 | .133 |
| miR-451 | 0.040 | 0.055 | 3.495 | 0.070 | .944 |
| miR-93 | 0.059 | 0.115 | 3.413 | 0.785 | .432 |
| miR-144* | 0.002 | 0.003 | 2.953 | −0.049 | .961 |
| miR-21 | 0.036 | 0.073 | 2.716 | 2.556 | .011d |
Abbreviations: TLDA, Taqman Low Density Array; miRNA, microRNA.
aTLDA results of 30 pooled samples.
bΔΔCT = ΔCT case − ΔCT control − ΔCT cel-39 from TLDA data.
cDifference between groups was tested by Wilcoxon rank sum test.
*P < .05, significant differences from controls.
Figure 2.

Expression levels of miRNAs. VI indicates discovery stage blood samples 1 week before delivery, n = 30; VII, validation stage blood samples 1 week before delivery, n = 60; VIII, validation stage blood samples early second trimester, n = 30. VI, MiRNA-21 (P = .011) and miRNA-20a (P = .015) were significantly differentially expressed among macrosomia cases compared with controls (30 pairs). VII, The levels of the miRNA-21 (P = 0.028) was significantly lower in serum samples at 1 week before delivery of macrosomia, but the expression levels of the miRNA20a (P = .312) were no different among the 60 pairs. VIII, The expression levels of the 2 miRNAs were no different among early second-trimester serum sample of macrosomia cases compared with controls.
To further evaluate the diagnostic value of miR-21 and miR-20a, the levels of miR-21 and miR-20a were measured on a total 120 serum samples, including another 30 pairs of serum samples at 1 week before delivery and 30 pairs of serum samples among early second trimester. The levels of the miR-21 were significantly lower in serum samples at 1 week before delivery of macrosomia (Table 4 and Figure 2), but the expression levels of the 2 miRNAs were no different in the early second-trimester serum sample of macrosomia cases compared with controls (Table 4 and Figure 2).
Table 4.
Expression of the Identified 2 miRNAs in the Validation Stages.a
| Validation | miRNAs | Macrosomia | Control | P b | P c | ||
|---|---|---|---|---|---|---|---|
| N | Median | N | Median | ||||
| VII validation (blood samples one week before deliver) | miR-20a | 60 | 0.033 | 60 | 0.038 | .312 | .321 |
| miR-21 | 60 | 0.021 | 60 | 0.023 | .028d | .014d | |
| VIII validation (blood samples early second-trimester) | miR-20a | 30 | 0.062 | 30 | 0.062 | .594 | .738 |
| miR-21 | 30 | 0.164 | 30 | 0.150 | .847 | .592 | |
Abbreviation: miRNA, microRNA.
aSimple and multiple logistic regression models were used to analyze the data.
bA model was constructed with simple logistic regression, miR-21(continuous) or miR-20a (continuous) were candidate factors in the analysis.
cB model was constructed with multiple logistic regression, the maternal old (continuous), maternal BMI before pregnancy (continuous), maternal gestational week (continuous), miR-21or miR-20a (continuous) were candidate factors in the analysis.
d P < .05, significant differences from controls.
We further plotted the receiver operating characteristic (ROC) curves for macrosomia predicting. The AUC analysis was only performed in the samples from the discovery and internal validation stages (30 pairs). Receiver operating characteristic curve analyses showed that the ROC curve areas for miR-21 was 67.7% (sensitivity = 66.7% and specificity = 70.0%; Figure 3).
Figure 3.
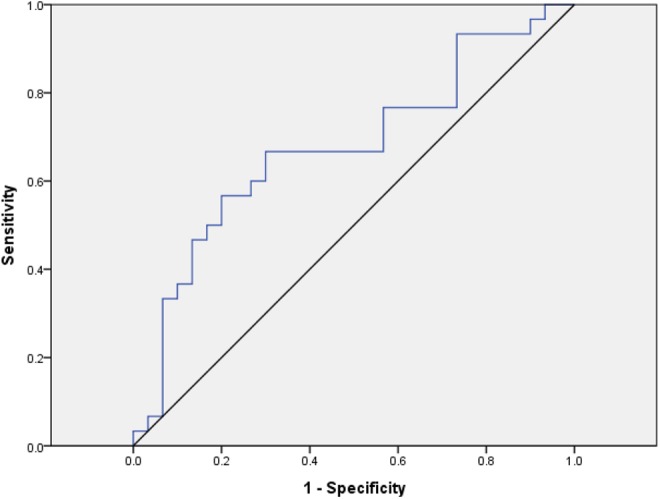
Receiver-operating characteristic of the miR-21 signature to predict macrosomia between macrosomia pregnant women and controls: area under the curve (AUC) = 0.677, sensitivity = 0.667, specificity = 0.7.
Discussion
Macrosomia is defined as an infant’s birth weight of more than 4000 g at term. It was diagnosed at postpartum. It has been implicated with many delivery complications including shoulder dystocia, traumatic birth injuries, and asphyxia.21 To improve pregnancy outcome, numerous studies have explored the possibility of early stage diagnosis to reduce the morbidity of macrosomia. Ultrasound is currently used as a noninvasive technique for macrosomia. Canavan TPetal find the AC in the >90th percentile at 28 to 34 weeks’ gestation is the best sonographic predictor of macrosomia at birth. 22 Little is known about the serum biomarkers for the diagnosis of macrosomia. The goal of the present study was to find a class of serum miRNAs as biomarkers for the prediction of macrosomia.
Our previous research used the TLDA followed by individual qRT-PCR assays to screen miRNAs in serum samples of early second trimester and found serum miR-376a may serve as a potential non-invasive biomarker in detecting macrosomia (Manuscript submitted to “BioMed Research International”). Su et al23 had demonstrated the differential expression patterns of miRNAs in different pregnancy stages. In this microarray study, we evaluated differential serum miRNAs expression in pregnant women of macrosomia at 1 week before delivery using 667 probes that represented both characterized and novel miRNAs. Our results showed that miR-376a did not present differential expression between macrosomia and controls at 1 week before delivery. However, we identified 32 miRNAs with differential expression patterns between macrosomia and controls at 1 week before delivery, with 26 downregulated miRNAs and 6 upregulated miRNAs. After a multistage validation, we found aberrant miR-21 expression in serum samples of women with macrosomic pregnancy at 1 week before delivery.
Serum/plasma miRNAs was first identified in 2008.17 Results from recent studies have revealed the remarkable stability of miRNAs in various clinical samples.24-27 It was found that endogenous serum/plasma miRNAs exist in a form that is resistant to 4°C or 37°C incubation, freeze–thaw cycles, and even to RNase activity.24,27 It is regarded as the biomarker in the clinical diagnostics because of these important features of miRNAs.
A recent report has shown miRNA expressed in the human placenta.28,29 Chim et al13 suggested that several placental miRNAs were highly expressed in maternal plasma during pregnancy. These results suggest miRNAs could act as potential serum markers for pregnancy monitoring.
We have used a 3-stage study to investigate the role of serum miRNAs in predicting macrosomia. We provide the first evidence suggesting that miR-21 is involved in the pathology of macrosomia. Our data suggest that low expression of miR-21 in the serum of third stage pregnant woman is associated with macrosomia. MiR-21 is encoded by a single gene, which locates at the fragile site FRA17B on 17p23.2 and is overlapped with the gene encoding transmembrane protein 49 (TMEM49, also known as VMP1).30 MiR-21 contains 22 nucleotides and is separated from a 3400 nt pretranscript.31 As a typical multifunctional miRNA, miR-21 has distinct expression profiles and plays a crucial role in various physiological and pathological processes such as cancer,32 type 2 diabetes,33 obesity,34 and fetal growth.35 These findings suggest that miR-21 promotes cell proliferation and induces cell dedifferentiation. Maccani et al35 analyzed 107 human placenta samples for the expression of 6-candidate miRNAs. They found that placental miR-21 expression was reduced in infants with the lowest birth weights. Our previous research found that the levels of placental miR-21 was upregulated in macrosomia. However, the miRNA level in tissue was not completely consistent with that in serum. Mouillet et al36 showed that plasma levels of miRNA are regulated in pregnancy and that fetal growth restriction may be associated with an increase in circulating miRNA levels. In this study, serum miR-21 expression was significantly lower in pregnant women with macrosomia as compared with the control group, and the satisfactory ROC values of miR-21 suggest that plasma miR-21 can be used as an effective, noninvasive marker for macrosomia forecasting. MiR-21 has been shown to target a number of key regulators of these processes, such as PLAG1, PTEN, and TGFBR2. However, the biological function of miR-21 in macrosomia is not clear. Further study on miR-21 is required to understand the pathogenesis of macrosomia.
In this study, we demonstrated that miR-20a was low expression in the serum of third-stage pregnant woman of the macrosomia group. But according to our observation, there was significant statistical difference at the discovery stage and the first validation stage (P = .015),while there was no statistical difference at the second validation stage with regard to the expression of miR-20a mRNA in the serum between the macrosomia group and the control group. Further studies with large sample sizes are warranted.
Many studies have shown the differential expression patterns of miRNAs in different stages of pregnancy. Our study also confirms this observation. The expression patterns of miR-21 and miR-20a in serum samples collected in the early second trimester were validated by qRT-PCR and there was no statistical difference at the early second trimester between the 2 groups.
In summary, we used miRNA microarray technology to analyze the miRNA expression profiles of macrosomia pregnant woman compared to normal birth weight pregnant woman from serum sample and validated the results with qRT-PCR in serum samples of third-stage pregnant women and in early second trimester pregnant women. Our data suggest that low expression of miR-21 in serum samples of pregnant women in the third trimester is associated with macrosomia. Out study suggests that miRNAs have the potential to predict macrosomia. Future work investigating the roles of miR-21 in specific pathways leading to altered fetal growth is critical for a better understanding of the molecular mechanism of macrosomia.
Acknowledgments
We thank all the study participants for their contributions.
Footnotes
Authors’ Note: Hua Jiang and Yang Wen contributed equally to the study and they should be regarded as joint first authors.
Declaration of Conflicting Interests: The author(s) declared no potential conflicts of interest with respect to the research, authorship, and/or publication of this article.
Funding: The author(s) disclosed receipt of the following financial support for the research, authorship, and/or publication of this article: This study was supported by Jiangsu Provincial Special Program of Maternal and child health (F201421), Changzhou Natural Science Foundation (CJ20130013), Major Program of Changzhou Health Bureau Funds (ZD201107), and Major Program of Natural Science Foundation of Nanjing medical university (2011NJMU230). Hua Jiang and Jing Dong conceived and designed the experiments. Yang Wen and Hu performed the experiments. Hua Jiang and Yang Wen analyzed the data. Hua Jiang, Ming Zhang, and Tingting Miao contributed reagents/materials/analysis tools. Hua Jiang, Yang Wen, and Hu L wrote the article.
References
- 1. Lu Y, Zhang J, Lu X, Xi W, Li Z. Secular trends of macrosomia in southeast China, 1994-2005. BMC Public Health. 2011;11:818. [DOI] [PMC free article] [PubMed] [Google Scholar]
- 2. Koyanagi A, Zhang J, Dagvadorj A, et al. Macrosomia in 23 developing countries: an analysis of a multicountry, facility-based, cross-sectional survey. Lancet. 2013;381 (9865):476–483. [DOI] [PubMed] [Google Scholar]
- 3. Xie RH, Cao H, Hong B, Sprague AE, Walker M, Wen SW. Occurrence and predictors of vacuum and forceps used sequentially for vaginal birth. J Obstet Gynaecol Can. 2013;35 (4):317–322. [DOI] [PubMed] [Google Scholar]
- 4. Yu ZB, Han SP, Zhu GZ, Zhu C, Wang XJ, et al. Birth weight and subsequent risk of obesity: a systematic review and meta-analysis. Obes Rev. 2011;12 (7):525–542. [DOI] [PubMed] [Google Scholar]
- 5. Li XY, Jiang Y, Hu N, et al. [Prevalence and characteristic of overweight and obesity among adults in China, 2010]. Zhonghua Yu Fang Yi Xue Za Zhi. 2012;46 (8):683–686. [PubMed] [Google Scholar]
- 6. Cui Z, Huxley R, Wu Y, Dibley MJ. Temporal trends in overweight and obesity of children and adolescents from nine Provinces in China from 1991-2006. Int J Pediatr Obes. 2010;5 (5):365–374. [DOI] [PubMed] [Google Scholar]
- 7. Gu S, An X, Fang L, et al. Risk factors and long-term health consequences of macrosomia: a prospective study in Jiangsu Province, China. J Biomed Res. 2012;26 (4):235–240. [DOI] [PMC free article] [PubMed] [Google Scholar]
- 8. Yu Z, Han S, Zhu J, Sun X, Ji C, Guo X. Pre-pregnancy body mass index in relation to infant birth weight and offspring overweight/obesity: a systematic review and meta-analysis. PLoS One. 2013;8 (4):e61627. [DOI] [PMC free article] [PubMed] [Google Scholar]
- 9. Li S, Rosenberg L, Palmer JR, Phillips GS, Heffner LJ, Wise LA. Central adiposity and other anthropometric factors in relation to risk of macrosomia in an African American population. Obesity (Silver Spring). 2013;21 (1):178–184. [DOI] [PMC free article] [PubMed] [Google Scholar]
- 10. Grundt JH, Nakling J, Eide GE, Markestad T. Possible relation between maternal consumption of added sugar and sugar-sweetened beverages and birth weight--time trends in a population. BMC Public Health. 2012;12:901. [DOI] [PMC free article] [PubMed] [Google Scholar]
- 11. Silveira PP, Portella AK, Goldani MZ, Barbieri MA. Developmental origins of health and disease (DOHaD). J Pediatr (Rio J). 2007;83 (6):494–504. [DOI] [PubMed] [Google Scholar]
- 12. Lillycrop KA. Effect of maternal diet on the epigenome: implications for human metabolic disease. Proc Nutr Soc. 2011;70 (1):64–72. [DOI] [PubMed] [Google Scholar]
- 13. Chim SS, Shing TK, Hung EC, et al. Detection and characterization of placental microRNAs in maternal plasma. Clin Chem. 2008;54 (3):482–490. [DOI] [PubMed] [Google Scholar]
- 14. Zhao C, Dong J, Jiang T, et al. Early second-trimester serum miRNA profiling predicts gestational diabetes mellitus. PLoS One. 2011;6:e23925. [DOI] [PMC free article] [PubMed] [Google Scholar]
- 15. Enquobahrie DA, Abetew DF, Sorensen TK, et al. Placental microRNA expression in pregnancies complicated by preeclampsia. Am J Obstet Gynecol. 2011;204(2):178 e112-e121. [DOI] [PMC free article] [PubMed] [Google Scholar]
- 16. Jiang H, Wu W, Zhang M, et al. Aberrant upregulation of miR-21 in placental tissues of macrosomia. J Perinatol. 2014;34 (9):658–663. [DOI] [PubMed] [Google Scholar]
- 17. Lawrie CH, Gal S, Dunlop HM, et al. Detection of elevated levels of tumour-associated microRNAs in serum of patients with diffuse large B-cell lymphoma. Br J Haematol. 2008;141 (5):672–675. [DOI] [PubMed] [Google Scholar]
- 18. Hu Z, Chen X, Zhao Y, et al. Serum microRNA signatures identified in a genome-wide serum microRNA expression profiling predict survival of non-small-cell lung cancer. J Clin Oncol. 2010;28 (10):1721–1726. [DOI] [PubMed] [Google Scholar]
- 19. Schrauder MG, Strick R, Schulz-Wendtland R, et al. Circulating micro-RNAs as potential blood-based markers for early stage breast cancer detection. PLoS One. 2012;7 (1):e29770. [DOI] [PMC free article] [PubMed] [Google Scholar]
- 20. Zhu C, Ren C, Han J, et al. A five-microRNA panel in plasma was identified as potential biomarker for early detection of gastric cancer. Br J Cancer. 2014;110 (9):2291–2299. [DOI] [PMC free article] [PubMed] [Google Scholar]
- 21. Catalano PM. Management of obesity in pregnancy. Obstet Gynecol. 2007;109 (2 pt 1):419–433. [DOI] [PubMed] [Google Scholar]
- 22. Canavan TP, Hill LM. Sonographic biometry in the early third trimester: a comparison of parameters to predict macrosomia at birth [published online September 5, 2014]. J Clin Ultrasound. 2014. doi: 10.1002/jcu.22230. [DOI] [PubMed] [Google Scholar]
- 23. Su L, Zhao S, Zhu M, Yu M. Differential expression of microRNAs in porcine placentas on days 30 and 90 of gestation. Reprod Fertil Dev. 2010;22 (8):1175–1182. [DOI] [PubMed] [Google Scholar]
- 24. Mitchell PS, Parkin RK, Kroh EM, et al. Circulating microRNAs as stable blood-based markers for cancer detection. Proc Natl Acad Sci U S A. 2008;105 (30):10513–10518. [DOI] [PMC free article] [PubMed] [Google Scholar]
- 25. Xie Y, Todd NW, Liu Z, et al. Altered miRNA expression in sputum for diagnosis of non-small cell lung cancer. Lung Cancer. 2010;67 (2):170–176. [DOI] [PMC free article] [PubMed] [Google Scholar]
- 26. Chen X, Ba Y, Ma L, et al. Characterization of microRNAs in serum: a novel class of biomarkers for diagnosis of cancer and other diseases. Cell Res. 2008;18 (10):997–1006. [DOI] [PubMed] [Google Scholar]
- 27. Shen J, Todd NW, Zhang H, et al. Plasma microRNAs as potential biomarkers for non-small-cell lung cancer. Lab Invest. 2011;91 (4):579–587. [DOI] [PMC free article] [PubMed] [Google Scholar]
- 28. Barad O, Meiri E, Avniel A, et al. MicroRNA expression detected by oligonucleotide microarrays: system establishment and expression profiling in human tissues. Genome Res. 2004;14 (12):2486–2494. [DOI] [PMC free article] [PubMed] [Google Scholar]
- 29. Lim LP, Lau NC, Garrett-Engele P, et al. Microarray analysis shows that some microRNAs downregulate large numbers of target mRNAs. Nature. 2005;433:769–773. [DOI] [PubMed] [Google Scholar]
- 30. Krichevsky AM, Gabriely G. miR-21: a small multi-faceted RNA. J Cell Mol Med. 2009;13 (1):39–53. [DOI] [PMC free article] [PubMed] [Google Scholar]
- 31. Cai X, Hagedorn CH, Cullen BR. Human microRNAs are processed from capped, polyadenylated transcripts that can also function as mRNAs. RNA. 2004;10 (12):1957–1966. [DOI] [PMC free article] [PubMed] [Google Scholar]
- 32. Volinia S, Calin GA, Liu CG, et al. A microRNA expression signature of human solid tumors defines cancer gene targets. Proc Natl Acad Sci U S A. 2006;103 (7):2257–2261. [DOI] [PMC free article] [PubMed] [Google Scholar]
- 33. Zampetaki A, Kiechl S, Drozdov I, et al. Plasma microRNA profiling reveals loss of endothelial miR-126 and other microRNAs in type 2 diabetes. Circ Res. 2010;107 (6):810–817. [DOI] [PubMed] [Google Scholar]
- 34. Kim YJ, Hwang SH, Cho HH, Shin KK, Bae YC, Jung JS. MicroRNA 21 regulates the proliferation of human adipose tissue-derived mesenchymal stem cells and high-fat diet-induced obesity alters microRNA 21 expression in white adipose tissues. J Cell Physiol. 2012;227 (1):183–193. [DOI] [PubMed] [Google Scholar]
- 35. Maccani MA, Padbury JF, Marsit CJ. miR-16 and miR-21 expression in the placenta is associated with fetal growth. PLoS One. 2011;6 (6):e21210. [DOI] [PMC free article] [PubMed] [Google Scholar]
- 36. Mouillet JF, Chu T, Hubel CA, Nelson DM, Parks WT, Sadovsky Y. The levels of hypoxia-regulated microRNAs in plasma of pregnant women with fetal growth restriction. Placenta. 2010;31 (9):781–784. [DOI] [PMC free article] [PubMed] [Google Scholar]