

Abstract
The diagnosis of uterine smooth muscle tumors including leiomyosarcomas (LMS), smooth muscle tumors of uncertain malignant potential (STUMP), bizarre (atypical) leiomyoma (BLM), mitotically active leiomyoma (MAL) and leiomyoma (LM) depends on a combination of microscopic features, such as mitoses, cytologic atypia, and coagulative tumor cell necrosis. However, a small number of these tumors still pose difficult diagnostic challenges. The assessment of accurate mitotic figures (MF) is one of the major parameters in the proper classification of uterine smooth muscle tumors. This assessment can be hampered by the presence of increased number of apoptotic bodies or pyknotic nuclei, which frequently mimic mitoses. Phospho-histone H3 (PHH3) is a recently described immunomarker specific for cells undergoing mitoses. In our study, we collected 132 cases of uterine smooth muscle tumors, including 26 LMSs, 16 STUMPs, 30 BLMs, 30 MALs and 30 LMs. We used mitosis specific marker PHH3 to count mitotic indexes (MI) of uterine smooth muscle tumors and compared with the mitotic indexes of hematoxylin and eosin (H&E). There is a positive correlation with the number of mitotic figures in H&E-stained sections and PHH3-stained sections (r=0.944, P<0.05). The ratio of PHH3-MI to H&E-MI has no statistically significant difference in each group except for LMs (P>0.05). The counting value of PHH3 in LMSs have significantly higher than STUMPs, BLMs, MALs and LMs (P<0.001) and the counting value of PHH3 is 1.5±0.5 times of the number of mitotic indexes in H&E. To conclude, our results show that counting PHH3 is a useful index in the diagnosis of uterine smooth muscle tumors and it can provide a more accurate index instead of the time-honored mitotic figure counts at a certain ratio.
Keywords: Uterine smooth muscle tumors, PHH3, mitotic index, immunohistochemical
Introduction
Uterine smooth muscle tumors are the most frequent neoplasms in the female genital tract [1]. It occurs in nearly 40% of women older than 35 years. Uterine leiomyosarcomas (LMS) are relatively rare smooth-muscle tumors, accounting for approximately more than 50% of uterine sarcomas and 1.3% of all uterine malignancies [2]. Most leiomyomas (LM) and leiomyosarcomas (LMS) are readily diagnosed based on a combination of mitoses, cytologic atypia, and coagulative tumor cell necrosis (CTCN). The mitotic index (MI) count is one of the most important criterions used to diagnose malignancy in smooth muscle tumors of uterus. However, the distinction uterine LMS from benign leiomyoma variants, such as bizarre (atypical) leiomyoma (BLM), mitotically active leiomyoma (MAL) and smooth muscle tumors of uncertain malignant potential (STUMP) is strenuous. The assessment of the malignant potential can sometimes be also difficult, especially when a difficulty in recognizing mitotic figures occurs or clumped and degenerative nuclei are misinterpreted as mitotic figures [3]. Moreover, the mitotic figure count is a time-consuming and cumbersome task, even for the senior pathologists, especially for the inexperienced histopathological doctors. Therefore it is necessary that the application of immunohistochemistry for the identification of mitotic figures to facilitate mitotic counting [4]. It has been shown recently in the literature that there is a strong correlation between PHH3 and mitotic figures [5-9]. This essay describes our finding in the correlation of mitotic figures with hematoxylin and eosin (H&E) and mitosis-specific reagent PHH3 stain in uterine LMSs, STUMPs, benign leiomyoma variants. We also compared the mitotic index of H&E with proliferation index ki-67, followed by the correlation analysis.
Materials and methods
Tissue collection
This retrospective study included 132 cases of uterine smooth muscle tumors (30 cases of LMs, 30 cases of MALs, 30 cases of BLMs, 16 cases of STUMPs and 26 cases of LMSs) selected from the files of 2007 to 2014 at the department of pathology of Tianjin Central Hospital of Gynecology and Obstetrics in China. All H&E-stained slides diagnoses were reviewed and reconfirmed by several senior pathologists. Microscopic characteristics such as nuclear atypia, mitotic activity, coagulative tumor cell necrosis, cellularity, vascular invasion, and borders with the adjacent tissue were all considered.
Immunohistochemistry
PHH3 was detected using a PHH3 polyclonal antibody (polyclonal, ZSGB-BIO; working solution, antigen retrieval with pressure cooker). Ki-67 was detected using a Ki-67 monoclonal rabbit antibody (monoclonal, ZSGB-BIO; working solution, antigen retrieval with pressure cooker). Paraffin blocks were sectioned at 4 μm and mounted on charged slides, deparaffinized in xylene, and rehydrated through a graded alcohol series to distilled water. Endogenous peroxidase activity was blocked and heat-induced antigen retrieval was carried out by immersion of the sections in ethylene diamine tetra acetate buffer (PHH3, pH 8.0; Ki-67, PH=9.0) and incubation in an autoclave (Matachana, Barcelona, Spain) at 120°C for 2 minutes. Immunohistochemical stains were performed using the Dako Autostainer (Dako Cytomation, Carpinteria, CA). The slides were incubated with the primary antibodies using optimized protocols. The peroxidase-labeled polymer was applied for 30 minutes at room temperature. The detection system used was EnVision (Dako, Glostrup, Denmark) with diaminobenzidine as the chromogen. The slides were subsequently washed in water, counterstained with hematoxylin, dehydrated, and mounted. Adequate immunoreactive tissue samples were used as positive controls for each antibody. Negative controls were produced by omission of the primary antibodies.
Mitotic figures counting
The cases were evaluated independently in double-blind fashion by 3 pathologists. One of the observers is a junior resident in our training program with only limited experience in diagnostic pathology. The other two observers are senior pathologists. H&E mitotic data was the average number of the 2 senior pathologists. PHH3 mitotic data was counted by a senior pathologist. Mitotic counts were performed in the most mitotically active areas and the number of mitoses in 10 consecutive high power fields (HPF) was counted [10,11]. Positive ki-67 cells were also counted in 10 consecutive high power fields. Mitotic figures were defined as cells in metaphase(clumped chromatin and chromatin arranged in a plane), and anaphase/telophase (separated clumped chromatin). The definition for what was considered a mitotic figure was analogous to the definition described in detail by Vandiest and coworkers [12]. Briefly, the criteria included absence of a nuclear membrane, hairy extensions of nuclear material, either clotted (beginning metaphase), in a plane (metaphase/anaphase), or in separateclors (telophase) [13]. No hyperchromatic or pyknotic nuclei were counted, because these cells may well represent cells undergoing necrosis or apoptosis, as emphasized by Elston and Ellis [14].
Statistical analysis
One-Way ANOVA and Spearman correlation methods were used for evaluation of data. A P-value <0.05 was considered to be statistically significant. Data were stored and analyzed using the SPSS 13.0 statistical software.
Results
Clinical information of 132 cases of uterine smooth muscle tumors
The average patient age is 43.8±9.6 years (mean ages in LMS, STUMP, BLM, MAL, LM groups are 49.6, 46.7, 42.0, 41.9, 41.0 respectively). All 132 uterine smooth muscle tumors measured in diameter from 0.6 to 25 cm (mean 6.7 cm, and mean diameter in LMS, STUMP, BLM, MAL, LM groups are 7.7, 6.8, 5.9, 7.1, 6.7 cm respectively). There are no statistically significant differences of diameter between any two groups of LMS, STUMP, BLM, MAL, LM (P>0.05).
Evaluation of PHH3 immunostaining
Mitotic figures were detectable both within H&E and PHH3-immunostained sections. Overall PHH3 labeled cells undergoing the cell cycle, from prophase to telophase, revealing a strong brown staining of condensed chromosome.Anti-PHH3 labeled MFs were easily observed which permitted quick identification of the area of highest mitotic activity for subsequent counting (Figures 1, 2). Leiomyosarcomas have significantly higher mitotic figures of PHH3 labeling index than STUMPs, BLMs, MALs and LMs (Figures 1, 2).
Figure 1.

Histopathology of leiomyosarcoma (A), uncertain malignant potential (B). Expression of PHH3 in leiomyosarcoma (C), uncertain malignant potential (D). Phosphohistone-H3 PHH3 staining, mitotic figures stain chocolate brown, leiomyosarcoma has more mitotic figures than uncertain malignant potential (C, D). Inset: high-power detail of one anti-PHH3-immunostained mitotic figure in leiomyosarcoma and high-power detail of H&E in all 2 cases. (H&E×200; IHC×200).
Figure 2.
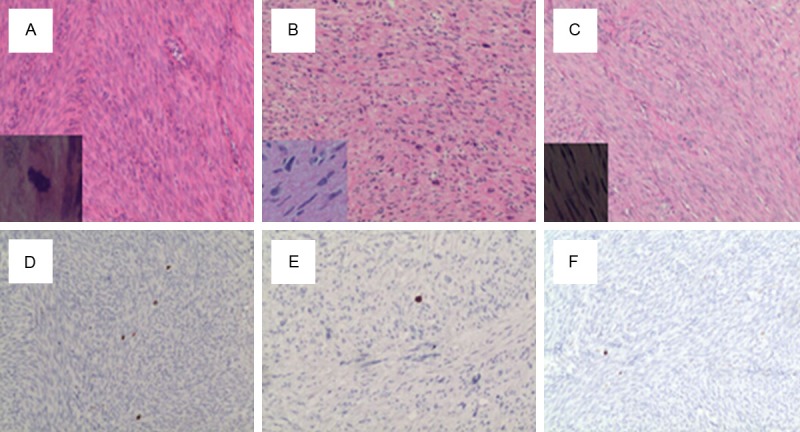
Histopathology of mitotically active leiomyoma (A), bizarre (atypical) leiomyoma (B) and leiomyomas (C). Expression of PHH3 in mitotically active leiomyoma (D), bizarre (atypical) leiomyoma (E) and leiomyomas (F). Phosphohistone-H3 PHH3 staining, mitotic figures stain chocolate brown. Inset: high-power detail of H&E in all 3 cases. (H&E×200; IHC×200).
Results of anti-PHH3-labeled MI counts, H&E-stained MI counts and Ki-67 proliferation index in 132 cases of uterine smooth muscle tumors
Anti-PHH3-labeled MI counts, H&E-stained MI counts and Ki-67 proliferation index in 132 cases of uterine smooth muscle tumors are 13.6±14.6, 9.4±10.4, 493.5±495.6 respectively. The detail statistics in each group of uterine smooth muscle tumors are shown in Table 1. There are statistically significant differences of mitotic index between H&E, PHH3 and Ki67 proliferation index (P<0.05).
Table 1.
Mitotic figures (MF) of each group on H&E, immunohistochemical analyses of PHH3, ki-67, ratio of PHH3-MF to H&E-MF, proliferation index Ki67 to H&E-MF in all five groups
| Subset | LM | LMS | STUMP | BLM | MAL |
|---|---|---|---|---|---|
| H&E-MF | 24.2±13.8 | 10.6±4.6 | 3.7±2.0 | 9.4±3.6 | 1.5±0.7 |
| PHH3-MF | 34.1±19.9 | 15.1±5.2 | 5.2±3.1 | 14.0±5.6 | 3.1±1.3 |
| Positive ki-67cells | 1013.0±396.5 | 856.3±632.3 | 122.2±88.56 | 49.6±29.4 | |
| 65.0±24.3 | |||||
| PHH3-MF/H&E-MF | 1.4±0.4 | 1.5±0.3 | 1.5±0.6 | 1.5±0.4 | 2.2±1.0 |
| Positive ki-67cells/H&E-MF | 62 ±66 | 82±51 | 41±29 | 79±51 | 47±22 |
*Data are given as mean ± SD.
Correlation of anti-PHH3-labeled MI counts and H&E-stained MI counts
Results of MI quantitation on H&E-stained sections, anti-PHH3- labeled MI, ki-67 proliferation index and their relationships in 132 uterine smooth muscle tumors are summarized in Figure 3. Generally as shown in Table 1, anti-PHH3- labeled MI is higer than H&E-stained MI counts in each group. A strong correlation was found between them (r=0.964, P<0.05). Ratio of anti-PHH3-labeled MI to MI on H&E was basically constant from 1.4-2.2 (Table 1; Figure 4A).
Figure 3.
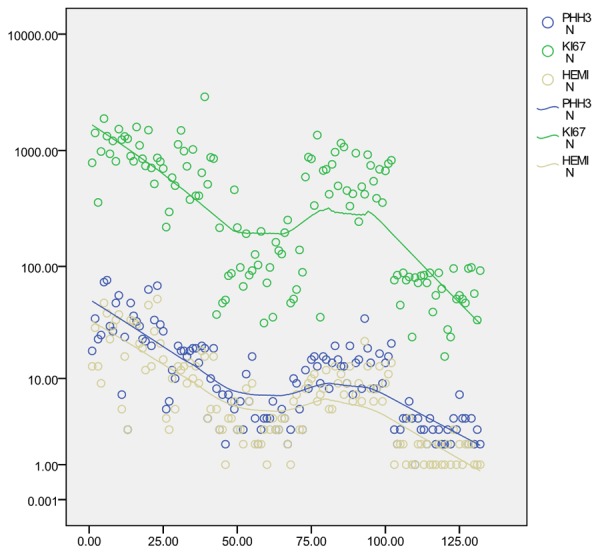
Results of MI quantitation on H&E-stained sections, anti-PHH3- labeled MI, proliferation index ki-67 and their relationships in 132 uterine smooth muscle tumors. The polynomial regressions are shown in green, blue and khaki.
Figure 4.

A. PHH3-MI/H&E-MI (/10HPF) in all five groups of uterine smooth muscle tumors. Except LM, the means of the rate are almost equal in the rest four groups. B. Positive ki-67 cells/HE-MI (/10HPF) in all five groups of uterine smooth muscle tumors. The means of the rate are jagged in all five groups.
Proliferation index ki67 and comparison with anti-PHH3-labeled MI
There is also a positive correlation between H&E-stained MI counts and proliferation index ki67 (r=0.643, P<0.05, Figure 3). However, H&E-MI and anti-PHH3- labeled MI are distributed more closer, while the distribution of proliferation index ki67 are more diffuse (Figure 5). Furthermore, proliferation index ki67 and mitotic index on H&E have no obvious regular relationship of ration which is between 41-82 (Table 1; Figure 4B). There is statistically significant difference between the ratio of H&E-MI to anti-PHH3- labeled MI and that of H&E-MI to proliferation index ki67 (P<0.05).
Figure 5.

A. PHH3-MI per 10 HPF in all 5 groups of uterine smooth muscle tumors. B. H&E-MI per 10 HPF in all 5 groups of uterine smooth muscle tumors. C. Positive ki-67 cells per 10 HPF in all 5 groups of uterine smooth muscle tumors. Comparison of the three picture, We can find A and B is closer to scatter distribution, and the gap is big between A and C.
Distribution interval of anti-PHH3-labeled MI in different groups of uterine smooth muscle tumors
Immunohistochemistry results for PHH3 in all each group of uterine smooth muscle tumors are summarized in Table 2 and shown in Figure 5A. Briefly, Leiomyosarcomas have significantly higher Anti-PHH3-labeled MI counts than STUMPs, BLMs, MALs and LMs (P<0.001). Although there were occasional exceptions, the mitotic index more than 20 was seen in approximately 85% of LMSs. The mitotic index based on PHH3 count form 11 to 20 is 81% in STUMPs and 63% in MALs. The counting value of PHH3 within the interval of 0 to 10 is 93% in BLMs. The number of mitotic figures no more than 5 is seen in nearly 100% of LMs (Table 2). Mitotic index in STUMP and MAL groups is higher than that in BLM and LM groups (P<0.001), which can also be demonstrated by Figure 5A.
Table 2.
Immunohistochemistry results for PHH3 in all 5 groups of uterine smooth muscle tumors
| Subset | Cases | PHH3-MF | PHH3-MF | PHH3-MF | PHH3-MF |
|---|---|---|---|---|---|
|
| |||||
| 0-5 | 5-10 | 11-20 | >20 | ||
| LMS | 26 | 2 (8%) | 1 (4%) | 1 (4%) | 22 (84%) |
| STUMP | 16 | 1 (6%) | 2 (13%) | 13 (81%) | 0 (0%) |
| BLM | 30 | 19 (63%) | 9 (30%) | 2 (7%) | 0 (0%) |
| MAL | 30 | 0 (0%) | 9 (30%) | 19 (63%) | 2 (7%) |
| LM | 30 | 30 (100%) | 0 (0%) | 0 (0%) | 0 (0%) |
Discussion
Accurately diagnosing malignant from benign uterine smooth muscle neoplasms is clinically important for patient management. However, due to the overlapping features between malignant and benign smooth muscle tumors, the differential diagnosis is challenging sometimes. The mitotic figure count is one of the most important criterions used to diagnose smooth muscle tumors of uterus. However, counting mitotic figure is difficult and tedious even for the experienced pathologist. Interobserver and intraobserver variability may be problematic, especially in lesions with many pyknotic/degenerating hyperchromatic nuclei.
PHH3 begins at the Ser 10 and 28 positions in late G2 phase of the cell cycle and proceeds throughout prophase. Dephosphorylation begins in anaphase and is completed immediately before detectable chromosome decondensation in telophase. It has been demonstrated the PHH3 has been shown to be spatially and temporally correlated with chromatin condensation and can be detected by a highly specific antibody binding to the phosphorylated form of the amino-terminus of histone H3 at Ser28 [5,15,16]. Immunohistochemistry (IHC) for PHH3 has been used for mitotic cell counting in different types of tumors as marker of cells in late G2 and M Part., such as breast [6], meningiomas [7,8], colorectal [17], ovarian serous adenocarcinomas [18] and atypical granular cell tumors [19].
One of our major concerns when designing this study was to compare the staining pattern of PHH3 and the mitotic index on H&E, trying to find the specific values of multiple relationships between them. Furthermore, we also explore the application using mitotises specific marker PHH3 in differentiating LMS from STUMP and benign leiomyoma variants, such as bizarre (atypical) leiomyoma (BLM), mitotically active leiomyoma (MAL).
The detection of mitotic figures via pHH3 IHC analysis has been described as having superior sensitivity due to enhanced detection of prophase cells and better specificity due to lack of staining in apoptotic cells, which was also confirmed in our study. As might have been anticipated, PHH3-positive MF counting provided greater sensitivity in MF detection, with increased mean MF counts in all five groups (Table 1; Figure 3).
The repeatability of counting mitotic index between different observers is poor. In our department more than three doctors count mitotic index with a difference even from18 to 37. Anti-PHH3 labeled MFs were easily seen and permitted quick identification of the area of highest mitotic activity for subsequent counting. Mitoic figures with many pyknotic/degenerating hyperchromatic nuclei of LMS on H&E sections where mitotic figures were not readily identified showed positive stain with PHH3, so the real mitotic figures can be seen easily. However some suspected mitotic figures are confirmed that they are not really mitoses by negative PHH3 staining (Figure 6).
Figure 6.

A. There are many pyknotic/degenerating hyperchromatic nuclei in this case. Medium magnification of LMS on hematoxylin and eosin section where mitotic figures were not readily identified. B. Mitotic indexes reveal a strong brown staining of condensed chromosome. (H&E×200; IHC×200).
Multiple studies have demonstrated strong correlation between PHH3-based IHC and standard mitotic counts performed on samples stained with H&E [6,7,14]. The strong correlation between anti-PHH3 labeled MIs and mitotic index with H&E has been confirmed in our study. We showed the counting value of PHH3 in uterine smooth muscle tumors. The anti-PHH3 labeled counts of 132 uterine smooth muscle tumors were compared with H&E-stained MI counts. Generally anti-PHH3- labeled MI is higer than H&E-stained MI counts in each group and strong correlation was found between them (r=0.964, P<0.05).
Furthermore, it is demonstrated in our study that the ratio of anti-PHH3 labeled MI to H&E-stained MI counts is ba sically constant (Table 1) which can also be clarified by Figure 4 very well. In the former 4 groups except LMs , anti-PHH3 labeled MI are about 1.5 times as high as H&E-stained MI counts, and the difference of the standard deviation is small.
However the mitotic index ratio of PHH3 to H&E in LM group is 2.5, much higher than that in other four groups. We think the probable reason is due to the low quantitation of mitotic index in LM group. MFs counted on H&E is generally within 0-2, while PHH3 is between 2 to 4. Although the number of mitotic index is small, the ratio of PHH3-MF/HE-MF is amplified from 1 to 4.
Despites the ratio relationship between leiomyoma group and the other four groups is different, it is still within 2.5 times. As benign leiomyomas have no significant cytologic atypia, so it makes little sense to count mitotic figures. To conclude, we think that the counting value of PHH3 can to some extent provide more accurate index instead of the time-honored mitotic figure counts.
There are positive correlations with the number of mitotic figures between H&E and PHH3 as well as H&E and proliferation index ki-67 (r=0.964, r=0.643 respectively). Compared with Ki67, PHH3 can present a closer situation of true mitotic figures. First of all PHH3 showed a stronger relation with mitotic figures (r=0.964 ve. r=0.643), in which the correlation coefficient is closer to 1. As also showed in Table 1, there is a basically constant ratio of mitotic index ranged from 1.5-2.5 between PHH3 and H&E, especially in the former 4 smooth muscle tumor groups whose deviation is small. However, proliferation index ki-67 and mitotic figures have no obvious there has showed no regular ratio relationship of proliferation index ki-67 to mitotic figures on H&E, which ranged from 41-82.
Although Ki-67 is an established marker for determining the proliferation rate of many tumors, H.A. LEHR ea al suggest that Ki-67 immunohistochemistry can not be translated by a simple conversion factor into combined prognostic scores to replace the time-honored mitotic figure counts [20]. For one, Ki-67 marks cells in all non-G0 phases of the cell cycle and thus has a much larger number of cells that present mitotic figures (only G2/M phase cells). In short, the use of ki-67 in replacing mitotic figure counts is limited.
The utility of PHH3 immunostain also plays an important role in identifying different categories of uterine smooth muscle tumors. We have demonstrated that there is significantly higher anti-PHH3-labeled MI in uterine leiomyosarcomas compared with usual leiomyoma, leiomyoma variants and STUMPs. The number of mitotic figures more than 20 was seen in approximately 0% of LMs, 7% of MALs, 0% of BLMs, 0% of STUMPs and 85% of LMSs (Table 2). There are only 4 cases that mitotic index less than 20, in which three quarters are myxoid leiomyosarcoma cases (Figure 7). Atkins et al [21] puts forward that it can be distinguished benign from malignant myxoid tumor if there are more than two mitotic figures per 10 HPF, regardless of any atypical or necrosis. Except of myxoid leiomyosarcomas, the counting value of PHH3 more than 20 is seen in approximately 96% of LMSs. That is to say, if the counting value of PHH3 is more than 20, we consider this case has a higher chance to be malignant. The most important meaning for the interval of more than 20 is to help differentiate LMS with STUMP.
Figure 7.

Histopathology (A) and expression of PHH3 (B) in myxoid leiomyosarcoma (H&E×200; IHC×200) Inset: high-power detail of one anti-PHH3-immunostained mitotic figure.
81% STUMPs and 63% MAL with anti-PHH3-labeled MI ranged from 11 to 20. However according to morphology they are easy to distinguish without other special indicators. Despites similar mitotic index between STUMPs and MAL, STUMPs have some other morphology features such as cytologic atypia or coagulative tumor cell necrosis. Mitotic index in LM and BLM groups distribute mostly in the interval of 0-10 with 93% of BLM and 100% of LM in our study. However BLM have moderate to severe nuclear atypia, easy to identify based on morphology. To conclude, according to the numerical interval of PHH3 and morphology features on H&E, pathologists can easily classify different subtypes of smooth muscle tumors, as well as help the differential diagnosis and avoid misdiagnosis.
Veras et al [22] demonstrated that PHH3 is a useful tool in the correct interpretation of challenging uterine smooth tumors in regards to their mitotic index. There is only one article with PHH3 to count mitotic figures in gynecology. Which only concerned the LMSs and STUMPs. Our study not only enlarged the sample size and categories of smooth muscle tumors, but also evaluated the specific ratio relationship of mitotic index between PHH3 and H&E.
In short, counting mitosis is relatively convenient with PHH3 immunostaining, especially in lesions with many pyknotic, degenerating and hyperchromatic nuclei and let along it can reduce interobserver and intraobserver variability. Moreover counting PHH3 is a useful index in the diagnosis of uterine smooth muscle tumors which can provide a more accurate index instead of the time-honored mitotic figure counts at a certain ratio.
Acknowledgements
The authors acknowledge the collaboration of Hai-xia Wu, Xiu-jie Yu, Jing-Du, Wen-Hai Zhao, Xue Yang, Yan-Ning Xu, for assistance with the mitotic figures counting. The authors thank all technical personnels for their expert technical assistance.
Disclosure of conflict of interest
None.
References
- 1.Zhai YL, Nikaido T, Toki T, Shiozwawa A, Orii A, Fujii S. Prognostic significance of bcl-2 expression in leiomyosarcoma of the uterus. Br J Cancer. 1999;80:1658–64. doi: 10.1038/sj.bjc.6690578. [DOI] [PMC free article] [PubMed] [Google Scholar]
- 2.Zaloudek CJ, Hendrickson MR, Robert A. Mesenchymal tumors of the uterus. In: Kurman RJ, editor. Blaustein’s pathology of the female genital tract. sixth edition. New York: Springer; 2011. pp. 471–476. [Google Scholar]
- 3.Mittal K, Demopoulos RI. MIB-1 (KI-67), p53, estrogen receptor, and progesterone receptor expression in uterine smooth muscle tumors. Human Pathol. 2001;32:984–7. doi: 10.1053/hupa.2001.27113. [DOI] [PubMed] [Google Scholar]
- 4.Malon C, Brachtel E, Cosatto E. Mitotic figure recognition: agreement among pathologists and computerized detector. Anal Cell Pathol (Amst) 2012;35:97–100. doi: 10.3233/ACP-2011-0029. [DOI] [PMC free article] [PubMed] [Google Scholar]
- 5.Hendzel MJ, Wei Y, Mancini MA. Mitosis-specific phosphorilation of histone H3 initiates primarily within pericentromeric heterochromatin during G2 and spreads in an ordered fashion coincident with mitotic chromosome condensation. Chromosoma. 1997;106:348–60. doi: 10.1007/s004120050256. [DOI] [PubMed] [Google Scholar]
- 6.Bossard C, Jarry A, Colombeix C. Phosphohistone H3 labeling for histoprognostic grading of breast adenocarcinomas and computer-assisted determination of mitotic index. J Clin Pathol. 2006;59:706–10. doi: 10.1136/jcp.2005.030452. [DOI] [PMC free article] [PubMed] [Google Scholar]
- 7.Ribalta T, McCutcheon IE, Aldape KD, Bruner JM, Fuller GN. The mitosis-specific antibody anti-phosphohistone-H3 (PHH3) facilitates rapid reliable grading of meningiomas according to WHO 2000 criteria. Am J Surg Pathol. 2004;28:1532–6. doi: 10.1097/01.pas.0000141389.06925.d5. [DOI] [PubMed] [Google Scholar]
- 8.Kim YJ, Katter R, Strudel WI. Prognostic significance of the mitotic index using the mitosis marker anti-phosphohistone H3 in meningiomas. Am J Clin Pathol. 2007;128:118–25. doi: 10.1309/HXUNAG34B3CEFDU8. [DOI] [PubMed] [Google Scholar]
- 9.Colman H, Giannini C, Huang L. Assessment and prognostic significance of mitotic index using the mitosis marker phospho-histone H3 in low and intermediate-grade infiltrating astrocytomas. Am J Surg Pathol. 2006;30:657–64. doi: 10.1097/01.pas.0000202048.28203.25. [DOI] [PubMed] [Google Scholar]
- 10.O’ Leary TJ, Steffes MW. Can you count on the mitotic index? Hum Pathol. 1996;27:147–51. doi: 10.1016/s0046-8177(96)90367-6. [DOI] [PubMed] [Google Scholar]
- 11.Hilsenbeck SG, Allred DC. Improved methods of estimating mitotic activity in solid tumors. Hum Pathol. 1992;23:601–2. doi: 10.1016/0046-8177(92)90312-q. [DOI] [PubMed] [Google Scholar]
- 12.van Diest PJ, Baak JP, Matze-Cok P. Reproducibility of mitosis counting in 2,469 breast cancer specimens:Results from the Multicenter Morphometric Mammary Carcinoma project. Hum Pathol. 1992;23:603–7. doi: 10.1016/0046-8177(92)90313-r. [DOI] [PubMed] [Google Scholar]
- 13.Silverberg SG, Kurman RJ, Nogales F. Epithelial tumors and related lesions. In: Tavassoli FA, Devilee P, editors. Pathology and Genetics of Tumours of the Breast and Female Genital Organs. Lyon: IARC Press; 2003. pp. 212–232. [Google Scholar]
- 14.Elston CW, Ellis IO. Pathological prognostic factors in breast cancer I. The value of histological grade in breast cancer: Experience from a large study with long-term follow-up. Histopathology. 1991;19:403–410. doi: 10.1111/j.1365-2559.1991.tb00229.x. [DOI] [PubMed] [Google Scholar]
- 15.Goto H, Tomono Y, Ajiro K. Identification of a novel phosphorylation site on histone H3 coupled with mitotic chromosome condensation. J Biol Chem. 1999;274:25543–49. doi: 10.1074/jbc.274.36.25543. [DOI] [PubMed] [Google Scholar]
- 16.Tapia C, Kutzner H, Mentzel T. Two mitosis-specific antibodies, MPM-2 and phospho-histone H3 (Ser28), allow rapid and precise determination of mitotic activity. Am J Surg Pathol. 2006;30:83–9. doi: 10.1097/01.pas.0000183572.94140.43. [DOI] [PubMed] [Google Scholar]
- 17.Scott IS, Morris LS, Bird K. A novel immunohistochemical method to estimate cell-cycle phase distribution in archival tissue: implications for the prediction of outcome in colorectal cancer. J Pathol. 2003;201:187–97. doi: 10.1002/path.1444. [DOI] [PubMed] [Google Scholar]
- 18.Scott IS, Heath TM, Morris LS. A novel immunohistochemical method for estimating cell-cycle phase distribution in ovarian serous neoplasms: implications for the histopathological assessment of paraffin-embedded specimens. Br J Cancer. 2004;90:1583–90. doi: 10.1038/sj.bjc.6601660. [DOI] [PMC free article] [PubMed] [Google Scholar]
- 19.Kapur P, Rakheja D, Balani JP. Phosphorylated histone H3, Ki-67, p21, fatty acid synthase, and Cleaved Caspase-3 expression in benign and atypical granular cell tumors. Arch Pathol Lab Med. 2007;131:57–64. doi: 10.5858/2007-131-57-PHHKPF. [DOI] [PubMed] [Google Scholar]
- 20.Lehr HA, Hansen DA. Assessment of proliferative activity in breast cancer: MIB-1 immunohistochemitry versus mitotic figure count. Hum Pathol. 1999;23:1314–20. doi: 10.1016/s0046-8177(99)90062-x. [DOI] [PubMed] [Google Scholar]
- 21.Atkins K, Bell S, Kempson RL, Hendrickson MR. Myxoid smooth muscle tumors of the uterus. Mod Pathol. 2002;14:132A. doi: 10.1038/modpathol.3880055. [DOI] [PubMed] [Google Scholar]
- 22.Veras E, Malpica A, Deavers MT, Silva EG. Mitosis-specific marker phospho-histone H3 in the assessment of mitotic index in uterine smooth muscle tumors: a pilot study. Int J Gynecol Pathol. 2009;28:316–21. doi: 10.1097/PGP.0b013e318193df97. [DOI] [PubMed] [Google Scholar]