

Abstract
Aim: Glomerular deposition of immune complexes and inflammation induce podocyte injury in lupus nephritis (LN). This study hypothesized that the severity of the histological lesions of LN affects podocyte-associated mRNAs profiles in kidney tissue and in urine. Methods: Thirty-three patients with LN were grouped according to the presence of mild mesangial (classes I and II) or moderate-to-severe immune complex deposition, proliferation and/or inflammation (classes III, IV and V) in kidney biopsy. Tissue and urine mRNA of nephrin, podocin, podocalyxin, α-actinin-4, transient receptor potential cation channel 6, and of growth factors VEGF-A and TGF-β1 and the transcription factor FOXP3 were measured using real time polymerase chain reaction. These mRNAs were correlated with histological severity of LN, extent of glomerular immune deposits, and tissue infiltrating cells. Results: Podocyte-associated mRNAs were inhibited in renal tissue of patients with LN irrespective of histological class when compared to controls. However, significantly higher expression of podocyte mRNAs in urine, including those of growth factors and FOXP3, were found in patients with moderate-to-severe nephritis, mostly in class III and IV proliferative forms. The number of invading CD8+ T cells, B cells and macrophages correlated positively with urine podocyte-associated mRNAs. Urine podocyte mRNAs also correlated with proteinuria. Conclusions: Inhibition of podocyte-associated mRNAs in kidney tissue suggests that podocyte injury occurs regardless of class severity of LN. Increased urinary excretion of podocyte mRNAs, mostly in patients with moderate-to-severe lesions, may reflect a greater burden of glomerular damage with detachment of podocytes into the urine.
Keywords: Systemic lupus erythematosus, lupus nephritis, podocytes, podocin, vascular endothelial growth factor, FOXP3
Introduction
Lupus nephritis (LN) is present in 40 to 60% of systemic lupus erythematosus (SLE) patients. Histological alterations in optical microscopy varies from no visible lesions or mild mesangial proliferation to severe endocapillary proliferation and subendothelial deposits with intense glomerular and tubulointerstitial inflammation [1].
Podocyte injuries of several glomerular diseases [2-4] and of LN [5,6] result in reduced tissue expression of podocyte-associated molecules, which are excreted as podocyte byproducts in urine. Damage to the glomerular filtration barrier leads to proteinuria and progressive loss of kidney function [3,5].
In SLE, self-reactive T- and B-cells produce proinflammatory cytokines and antibodies to specific nuclear antigens, which have cross-reactivity to podocyte antigens, such as alpha-actinin [7,8]. Anti-double stranded DNA (dsDNA) and anti-nucleosome antibodies and complement deposit in the glomerular mesangium and capillary loops, with a “full house” pattern on immunofluorescence [7,9]. Regulatory T cells (Tregs) expressing the transcription factor Forkhead box P3 (FOXP3), which control immunity by suppressing proinflammatory mechanisms, are impaired in SLE likely contributing to the immune dysregulation [10]. Clinical studies showed that FOXP3 mRNA in urine correlates with disease activity and treatment response in LN patients [11].
Glomerular injury in LN may also be associated with the expression of vascular endothelial growth factor (VEGF), which regulates vascular homeostasis. VEGF is induced by transforming growth factor-β (TGF-β1), and it is produced by activated T cells and macrophages during an inflammatory response. Serum VEGF-A levels are high in patients with active LN [12]. Additionally, urinary VEGF and TGF-β1 mRNA are higher in patients with proliferative LN compared to the less severe histological classes [13].
However, the connection of these mechanisms with the intensity of podocyte injury in active LN is not entirely clear. The present study hypothesized that the severity of the histological lesions in different classes of LN has an effect on podocyte-associated mRNAs profiles expressed in patient kidney tissue and urine.
Materials and methods
Patients
Thirty-three adult patients with active SLE were enrolled between March 2012 and September 2013 from the Nephrology and Rheumatology Units. LN activity was defined by proteinuria greater than 0.50, as measured by the proteinuria/creatininuria ratio (Pr/Cr), active urinary sediment (hematuria and/or cellular casts), positive anti-dsDNA antibodies, and decreased C3 and/or C4 levels, irrespective of the level of kidney function. For control tissue samples, microscopically normal renal tissue sections free from neoplasia were taken from 10 patients undergoing nephrectomy for renal tumor who did not have other evidence of renal disease. We collected urine from another set of 10 healthy individuals for control urine samples. Volunteers were defined as healthy when they reported no personal or familial history of kidney disease, blood pressure levels were <140/90 mmHg, the estimated GFR was higher than 90 mL/min/1.73 m2 and hematuria and proteinuria were absent in urinalysis. All patients agreed to participate and signed an informed consent form. This study was approved by the Research Ethics Committee of Hospital de Clínicas de Porto Alegre, Institutional Review Board number 00000921. The study is in adherence with the Declaration of Helsinky.
Age, gender, ethnicity, duration of LN, systolic (SBP) and diastolic blood pressure (DBP), and current medications were recorded. Serum creatinine was measured using the Jaffe reaction (Modular P Roche Diagnostic, Mannheim, Germany), and the glomerular filtration rate (eGFR) was estimated using the CKD-EPI equation. Serum albumin and proteinuria were assessed using the colorimetric Pyrogallol Red, and C3 and C4 serum levels, anti-nuclear antibodies, and anti-dsDNA were measured.
Histopathological diagnosis
The first biopsy from each patient was included in the study. A renal pathologist (RNB) reviewed the histopathology and classified LN according to the International Society of Nephrology and Renal Pathology Society [14]: minimal mesangial (class I, N=1), mesangial proliferative (class II, N=7), focal proliferative (class III N=10), diffuse proliferative (class IV, N=11) and pure membranous glomerulonephritis (class V, N=4). Two cases of class III and one case of class IV LN had membranous features (mixed forms), but these cases were included in the former groups because the proliferative lesions predominated. The activity index (AI) ranged from 0 to 24, and it was determined by the degree of endocapillary proliferation, glomerular and interstitial infiltration, and the presence of wire loops, necrosis/karyorrhexis, and crescents. The chronicity index (CI), which ranged from 0 to 12, was calculated considering the presence of glomerular sclerosis, fibrous crescents, tubular atrophy and interstitial fibrosis. AI was graded as follows: 0-7 (mild to moderate) and 8-24 (severe). CI was divided into 0-6 (mild to moderate) and 7-12 (severe) [15].
For comparisons, LN was grouped according to the histopathological characteristics and the distribution and extension of immune deposits on immunofluorescence (IF). One group (N=8) was composed of biopsies with minimal mesangial lesions or mesangial proliferation, with only mesangial immune deposits (LN classes I and II). The other group (N=25) had more severe lesions that included endocapillary proliferation (focal or diffuse, with or without necrosis and/or crescents-LN classes III or IV) or membranous nephritis (LN class V), with subendothelial, mesangial and/or subepithelial immune deposits.
The intensity of glomerular IgG and C3 deposits in capillary loops and the mesangium were assessed using immunofluorescence and semi-quantitatively scored from 0 to 3+. The intensity of glomerular immune deposits was categorized as absent to mild (0 to 1+) or moderate to severe (2+ to 3+).
Twenty-eight (85%) of the LN patients received immunosuppressive treatments. These patients were included as class III, IV or V subjects in the sample, and three patients were class II LN. Patients with proliferative lesions were treated with intravenous methylprednisolone, followed by oral prednisone and six monthly doses of intravenous cyclophosphamide. Maintenance was performed using mycophenolate mofetil or sodium (N=15) or azathioprine (N=6). Class V patients were treated with oral prednisone and mycophenolate mofetil (N=2) or azathioprine (N=2), and class II patients received oral prednisone. Twenty-six (78%) patients had chronic hydroxychloroquine use, and 20 (61%) patients received angiotensin inhibitors.
Immunohistochemistry of T cells, B lymphocytes, and macrophages
Inflammatory cells in kidney biopsies were phenotyped using a peroxidase immunohistochemistry technique. The infiltrate was stained for CD8+ T-cytotoxic lymphocytes, CD20+ B lymphocytes and CD68+ macrophages.
Endogenous peroxidase was blocked with hydrogen peroxide in methanol (4.5%), and antigen retrieval was performed in a digital pressure cooker (Biocare Medical, Concord, CA, USA). B lymphocyte and macrophage antigens were retrieved using a 10 mM citrate buffer (pH 6.0), and T lymphocyte antigens were retrieved using a Tris buffer (pH 8.0). The following antibodies were used: monoclonal mouse anti-CD20 (Dako, Carpinteria, CA, USA) at a 1:200 dilution in Da Vinci Green solution; monoclonal rabbit anti-CD8 at a 1:25 dilution in Van Gogh Yellow; and monoclonal mouse anti-CD68 at a 1:500 dilution in Da Vinci Green (all from Biocare Medical, Concord, CA, USA). CD20 staining was developed using Romulin AEC Chromogen, and CD8+ T lymphocytes and CD68+ macrophages were developed using Betazoid DAB Chromogen (both from Biocare Medical, Concord, CA, USA).
Quantification of cells in kidney biopsy samples
The cellular infiltrate was quantified using Image J software (Research Services Branch, National Institute of Health, Bethesda, MA, USA) and analyzed individually in the tubulointerstitial and glomerular segments. The total number of CD8+ T cells, CD20+ lymphocytes, and CD68+ macrophages in the slides was counted using the Cell Counter tool in Image J software. The cortical area in each slide was measured in square millimeters (mm2). The number of cells was divided by the cortical area, and the results were expressed as cells per mm2. Finally, the number of cells inside the glomerulus was divided by the total number of glomeruli in the biopsy fragment to obtain the number of each cell population per glomerulus.
Quantification of podocyte-associated mRNAs in kidney tissue and urine
Podocyte-associated mRNAs were measured using real-time polymerase chain reaction (RT-PCR) in kidney tissue and in urinary sediment cells, obtained from early-morning urine specimens (whole stream), as described elsewhere [16]. Specific primers (Applied Biosystems, Foster City, CA, USA) to the following genes were used in accordance with manufacturer’s instructions: NPHS1, nephrin (ID: HS00190446_m1); NPHS2, podocin (ID: Hs00387817_m1); podocalyxin (ID: Hs01574644_m1); transient receptor potential cation channel, member 6, TRPC6 (ID: Hs00989190_m1); alpha actinin-4 (ID: Hs00245168_m1); FOXP3 (ID: HS00203958_m1); VEGF-A (ID:HS00173626_m1) and TGF-β1 (ID: HS00998133_m1). 18s rRNA (TaqMan® PDAR) was used as an endogenous control for sample normalization. Messenger RNA of VEGF-A and TGF-β1 were used as markers of endothelial cell proliferation and intra-renal fibrosis, respectively. The expression of FOXP3, the transcription factor of regulatory T cells, was also measured. Increased expression of these mRNAs in tissue and urine was defined in relation to the mRNA levels detected in control groups specimens [3,5,11].
Statistical analysis
Data were presented as means ± standard deviation (SD) or medians and percentiles (P25-P75). Associations between categorical variables were investigated using Chi-squared and Fisher’s exact tests. RNA values were log-transformed to reduce asymmetry. Continuous variables were compared using Mann-Whitney test, and ANOVA or Kruskal Wallis tests when appropriate. Spearman correlation coefficients were used to assess the relationships between podocyte-associated mRNA, proteinuria, kidney function and the inflammatory infiltrate. The predictive value of podocyte mRNA expression of reduced kidney function (eGFR<60 ml/min/1.73 m2) or pathological proteinuria (Pr/Cr>1) at a one-year was determined using logistic regression analysis. All analyses were performed using SPSS software for Windows (version 18.0, SPSS Inc., Chicago, IL). Significance was set at P<0.05.
Results
Clinical and immunopathological characteristics
The demographic and clinical characteristics of subjects with LN and controls are shown in Table 1. No between-group differences were observed in demographics, except higher age in tissue control patients due to the higher incidence of renal tumor in this age group. Patients had active LN, which manifested as nephrotic range proteinuria, hypoalbuminemia, lower eGFR, low serum C3 and C4 levels, and high anti-dsDNA titers.
Table 1.
Clinical and demographic characteristics of patients with lupus nephritis and control subjects
| Cases | Controls | P | ||
|---|---|---|---|---|
|
| ||||
| Urine | Tissue | |||
| N | 33 | 10 | 10 | |
| Age (years) | 31±14a | 32±9a | 59±9b | <0.001 |
| Sex (female) | 29 (80) | 8 (80) | 6 (60) | 0.147 |
| Ethnicity (Caucasian) | 23 (69.7) | 10 (100) | 9 (90) | 0.780 |
| Duration of SLE (months) | 21±36 | - | - | |
| SBP (mm/Hg) | 133±23a | 117±5b | 111±9b | 0.003 |
| DBP (mm/Hg) | 78±18 | 77±5 | 71±7 | 0.415 |
| Serum creatinine (mg/dl) | 1.78±1.58a | 0.77±0.13b | 0.96±0.11b | 0.048 |
| eGFR (mL/min/1.73 m2) | 73±39a | 106±13b | 95±14b | 0.027 |
| Pr/Cr | 3.3±2.9a | 0.06±0.02b | 0.06±0.05b | <0.001 |
| Serum albumin | 3.2±0.9a | 4.7±0.3b | 4.4±0.4b | 0.001 |
| Serum C3 | 68±36 | - | - | |
| Serum C4 | 11±9 | - | - | |
| Serum Anti-dsDNA | 320±147 | - | - | |
| Activity Index | 6±5 | - | - | |
| Chronicity Index | 2±3 | - | - | |
SLE: Systemic lupus erythematosus; SBP: systemic blood pressure; DBP: diastolic blood pressure; Pr/Cr: proteinuria/creatinuria ratio in urine sample; eGFR: estimated glomerular filtration rate;
letter denote significant between-group differences in mean ± SD values (P<0.05).
letter denote significant between-group differences in mean ± SD values (P<0.05).
P-values were obtained through Chi-squared or Fisher’s Exact Test, or ANOVA followed by Tukey’s HSD post-hoc comparisons.
Proteinuria was significantly greater in patients with class III-IV-V than in patients with class I-II: 3.73 (2.82-6.78) and 0.98 (0.19-2.04), P=0.001. Activity index values over seven were not found in patients with class I or II LN, but AI values over seven were observed in 48% of class III-IV-V patients (P=0.015). Chronicity index scores over six were not found in any class I or II patients, and in 12% of class III-IV-V patients (P=0.422), which suggests that most cases in this patient population were of acute lupus nephritis.
Correlations of podocyte-associated mRNA expression in kidney tissue and urine
The expression of podocyte-associated mRNAs was significantly lower in the kidney tissue of patients with LN than control individuals (Figure 1). However, no significant differences were found in the tissue mRNAs of class I-II compared to class III-IV-V patients. Even patients with class I-II had lower levels of the following podocyte tissue mRNAs compared to controls: nephrin: 0.76 (0.32-1.58) and 2.84 (1.41-4.24), respectively, P=0.021; podocin: 0.61 (0.43-1.50) and 1.99 (0.90-3.99), P=0.032; podocalyxin: 0.70 (-0.09-1.60) and 1.94 (0.64-4.00), P=0.041; alpha-actinin-4: 0.10 (-0.47-0.96) and 2.27 (0.45-3.70), P=0.026 and TGF-β1: -0.95 (-0.21-0.36) and 1.00 (-0.83-2.86), P=0.033.
Figure 1.

Box plot representations showing medians and interquartile ranges of the expression of podocyte-associated mRNAs in the kidney tissue of patients with lupus nephritis (N=33) compared to controls (N=10); Mann-Whitney test for comparisons.
On the other hand, urine mRNA levels were significantly higher in patients with LN than controls (Figure 2), and this difference was most significant for class III-IV-V patients compared to class I-II (Figure 3).
Figure 2.

Box plot representations showing medians and interquartile ranges of the expression of podocyte-associated mRNAs in the urine of patients with lupus nephritis (N=33) compared to controls (N=10); Mann-Whitney test for comparisons.
Figure 3.
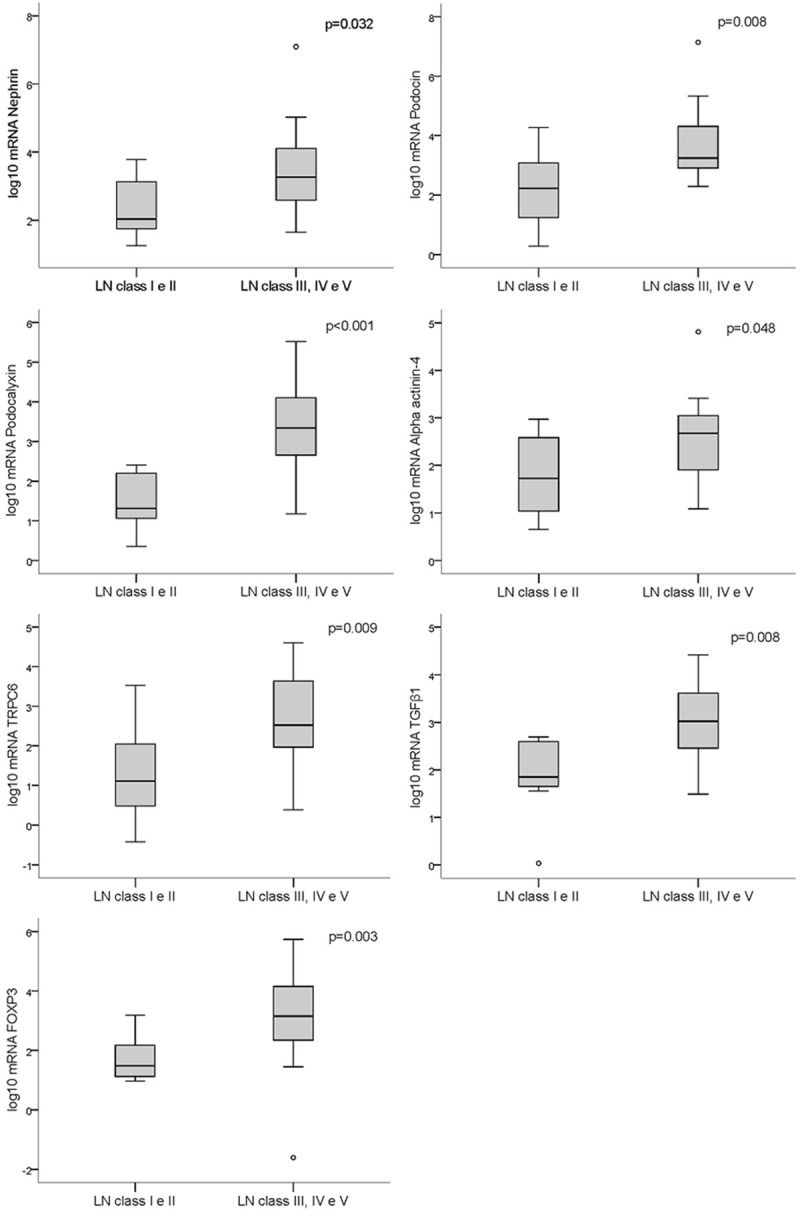
Box plot representations showing medians and interquartile ranges of the expression of podocyte-associated mRNAs in the urine of patients with lupus nephritis classes I and II (N=8) compared with patients with classes III, IV and V (N=25); Mann-Whitney test for comparisons.
A strong positive correlation was observed between the expression of VEGF-A and TGF-β1 mRNA in kidney biopsies (r=0.743, P<0.001) and urine (r=0.812, P<0.001) of patients with LN. No correlations were found between the tissue expression of podocyte-associated mRNAs and proteinuria, eGFR or anti-dsDNA levels. However, correlations were found between proteinuria and nephrin (r=0.531, P<0.001), podocin (r=0.473, P=0.002), podocalyxin (r=0.398, P=0.005), TGF-β1 (r=0.310, P=0.041) and FOXP3 (r=0.296, P=0.039) in urine samples. The duration of LN did not correlate with podocyte-associated mRNA expression.
Kidney immune deposits and podocyte mRNAs expression
Most class I-II patients (75% of cases) obtained scores of 0 to 1+ for IgG and C3 deposits in kidney biopsy as quantified using immunofluorescence, but 14 (56%) and 16 (64%) of class III-IV-V patients received scores of 2+ and 3+, respectively (P<0.05 for all comparisons). Patients presenting scores of 2+ to 3+ had higher urinary mRNA levels of nephrin: 3.54 (2.68-4.10) vs. 2.45 (1.98-3.51), P=0.047; TRPC6: 2.83 (2.01-4.02) vs. 1.6 (0.81-2.51), P=0.012; TGF-β1: 3.12 (2.46-3.89) vs. 2.15 (1.60-2.88), P=0.021, and FOXP3: 3.40 (2.61-4.25) vs. 2.05 (1.42-3.16), P=0.041. Patients with greater amounts of immune deposits also had lower tissue VEGF-A expression than patients with fewer deposits: -0.61 (-1.13-0.04) vs. 0.10 (-0.51-1.43), P=0.016.
Correlations of the inflammatory infiltrate with LN classes
Figure 4 illustrates the immunohistochemical findings of kidney biopsies, showing a higher density of cytotoxic CD8+ T cells, B CD20+ lymphocytes and CD68+ macrophages in the tubulointerstitial compartment compared to glomeruli. The median level of each inflammatory cell marker in both compartments was compared between class I-II and class III-IV-V LN (Figure 5). The number of CD8+ T cells was significantly higher in class III-IV-V patients. Although the number of CD68+ cells was greater in class III-IV-V patients, this result did not reach statistical significance compared with class I-II, most likely due to the large variability of macrophage counts. The number of CD20+ B lymphocytes in both compartments did not differ between LN class groups.
Figure 4.
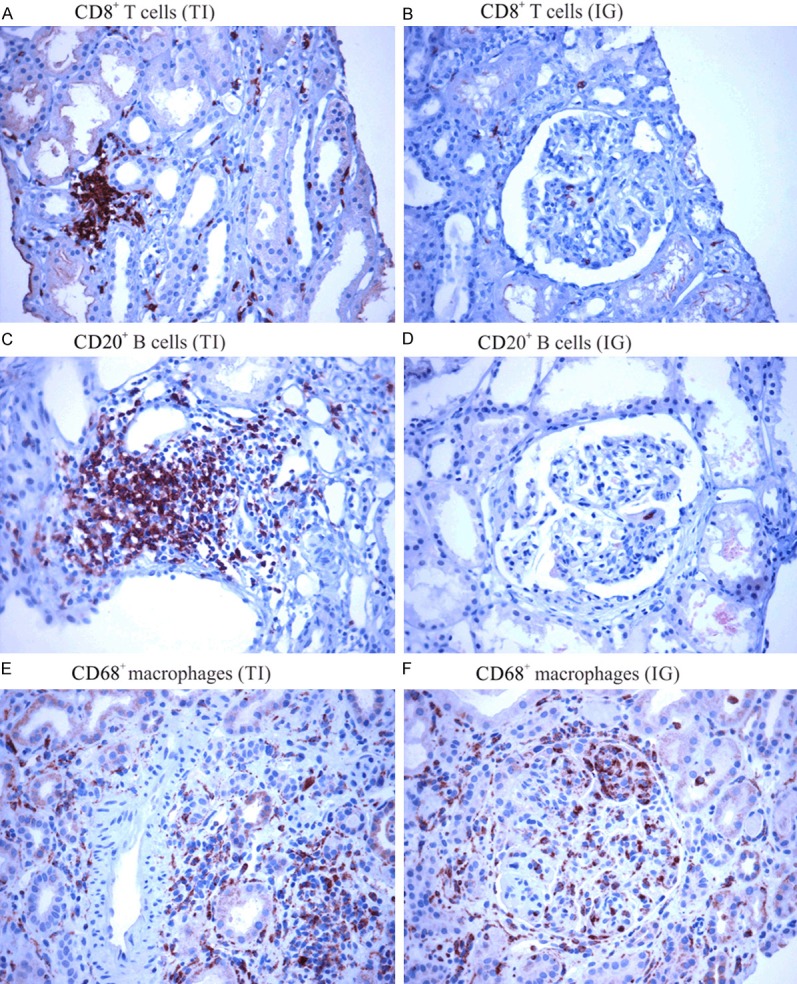
Immunostaining of the inflammatory cell infiltrates in tubulointerstitial (TI) and intraglomerular (IG) sections of kidney biopsies. A and B: CD8+ T cells; C and D: CD20+ B cells; and E and F: CD68+ Macrophages (A-F are at 400× magnification).
Figure 5.
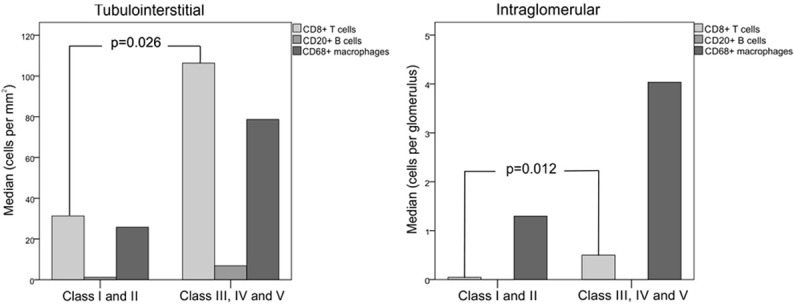
Median number of CD8+ T lymphocytes, CD20+ B cells and CD68+ macrophages in the tubulointerstitium and glomeruli of kidney biopsy samples of patients with classes I and II lupus nephritis (N=8) compared with patients with classes III, IV and V (N=25); Mann-Whitney test for comparisons.
Positive correlations were observed between the number of CD8+ T cells and urine mRNA of nephrin (r=0.591, P=0.003), podocin (r=0.363, P=0.041), and podocalyxin (r=0.429, P=0.014). Urine mRNA of podocin (r=0.471, P=0.009) and podocalyxin (r=0.557, P=0.001) significantly correlated with B lymphocytes, and urinary nephrin (r=0.511, P=0.006), podocalyxin (r=0.552, P=0.001), and alpha-actinin-4 (r=0.385, P=0.032) correlated with macrophages. Unlike B lymphocytes and macrophages, CD8+ T cell numbers also correlated with TGF-β1 (r=0.354, P=0.047) and FOXP3 (r=0.410, P=0.021) mRNAs in kidney biopsies. No correlations were found between the inflammatory infiltrate and renal function or anti-dsDNA serum levels.
Class IV lupus nephritis compared to other classes
Patients with proliferative class IV LN were compared to class III and the non-proliferative forms, classes I-II-V, as a group. Class IV patients had lower serum C3 and C4 levels and a greater AI than the other two groups. Baseline eGFR was lower in class IV, but this difference was not statistically significant. We included in Table 2 selected podocyte-associated tissue or urine mRNAs whose expression differed significantly among the histological classes of LN. Lower levels of TRPC6 and TGF-β1 mRNAs in kidney tissue and higher podocin, podocalyxin and TGF-β1 mRNAs in urine were also found in class IV. Tubulo-interstitial and intra-glomerular density of CD8+ T cells and macrophages in class IV were higher than patients with the other histological classes.
Table 2.
Comparison of clinical and histological parameters and podocyte-associated mRNA levels between patients with proliferative lupus nephritis and non-proliferative forms of the disease
| Class IV (N=11) | Class III (N=10) | Classes I, II and V (N=12) | p | |
|---|---|---|---|---|
| eGFR | 28 (19-98) | 74 (24-98) | 88 (61-116) | 0.304 |
| PCR | 4.99 (2.53-6.8) | 4.62 (2.5-6.1) | 2.41 (0.4-3.9) | 0.063 |
| AI | 12.6 (12-14)a | 5.3 (2-7.25)b | 1.3 (1-2)b | <0.001 |
| Serum C3 | 40 (33-61)a | 83 (57-107)b | 86 (69-114)b | 0.001 |
| Serum C4 | 7 (6-10)a | 14 (8-26)b | 18 (12-21)b | 0.008 |
| Serum anti-dsDNA (dilution) | 320 (100-320) | 320 (160-320) | 120 (27-280) | 0.228 |
| Urinary podocin | 3.80 (2.90-4.80)a | 3.60 (2.90-4.50)a | 2.50 (2.0-3.10)b | 0.024 |
| Urinary podocalyxin | 3.60 (2.75-4.20)a | 3.20 (2.50-4.30)a | 2.0 (1.20-2.40)b | 0.008 |
| Urinary TGβ1 | 3.21 (2.52-3.85)a | 2.90 (2.21-3.63)a | 1.80 (1.61-2.63)b | 0.015 |
| Tissue TGβ1 | -0.7 (-1.4 - -0.16)a | - 0.4 (-0.22-1.22)a | 0.6 (-0.5-1.7)b | 0.028 |
| Tissue TRPC6 | -1.23 (-1.61 - -0.34)a | -0.25 (-1.57 - -0.66)b | 0.45 (-0.80-1.88)c | 0.010 |
| CD8+ T cells | ||||
| TI | 147.6 (71-255)a | 106.9 (35.5-172)a | 36.6 (18.3-51.6)b | 0.060 |
| IG | 0.8 (0.5-1.5)a | 0.2 (0.09-1.2)a | 0.06 (0.008-0.2)b | 0.002 |
| Macrophages | ||||
| TI | 136.6(47.6-238.6)a | 47.7 (9.6-98.4)b | 22.6 (6.8-90.4)b | 0.048 |
| IG | 7.0 (4.7-16)a | 3.5 (0.9-5.3)a | 0.6 (0.2-2.7)b | <0.001 |
AI: Activity Index; eGFR: estimated glomerular filtration rate; PCR: proteinuria/creatinuria ratio; TI: tubulointerstitial; IG: intraglomerular;
letter denote significant between-group differences in mean ± SD values (P<0.05).
letter denote significant between-group differences in mean ± SD values (P<0.05).
letter denote significant between-group differences in mean ± SD values (P<0.05).
Relationship between podocyte-associated mRNA and clinical outcomes
A logistic model adjusted for the presence of class III or IV LN showed that the expression of podocyte-associated mRNAs in kidney or urine samples did not predict eGFR below 60 ml/min/1.73 m2 after a median of 14 months of follow up. By the end of the study period, 10 of the 33 patients had Pr/Cr greater than 1. This outcome was predicted by the expression of podocin mRNA in tissue (Odds Ratio, OR=2.417, [95% CI 1.131-5.167], P=0.023) and urine (OR=3.309 [95% CI 1.246-8.792], P=0.016) at the time of the biopsy. Therefore, the risk of developing a Pr/Cr ratio >1 was 2.4 times greater in patients with reduced podocin mRNA levels in a baseline biopsy specimen, and 3.3 times greater if urinary podocin mRNA was elevated at biopsy. Although urinary podocalyxin (OR=1.845 [95% CI 0.930-3.660], P=0.080), alpha actinin-4 (OR=2.660, [95% CI 0.927-7.628], P=0.069) and FOXP3 mRNA levels (OR=1.768, [95% CI 0.923-3.386], P=0.086) were possibly associated with proteinuria, these mRNAs did not predict a Pr/Cr>1 according to the regression model.
Discussion
Lupus nephritis is triggered when immune complex deposits activate complement, pro-inflammatory pathways and resident renal cells. Inflammatory cells are recruited via engagement of Fc and Toll-like receptors in the background of cytokine, chemokine and growth factor overexpression [17]. Specific patterns of glomerular injury, such as mesangial, subendothelial and/or subepithelial, depend on the accumulation site of immunoglobulins, their antigenic specificity, their capacity to bind complement, and their ability to induce an anti-inflammatory response [14]. It has been demonstrated that anti-dsDNA antibodies bind to glomerular structures in vivo, including podocytes [18]. The clinical presentation of LN is likely to correlate with the severity of histopathology, but at the molecular level our understanding about the extent of podocyte damaged is less clear. It seems reasonable to associate more intense immune complex deposition, endocapillary proliferation and inflammation to higher degree of podocyte injury. Thus, this study was designed to investigate the extent of podocyte injury in lupus patients with more or less severe renal pathology. The tissue expression of podocyte mRNAs in patients with classes III, IV and V did not differ from what was found in classes I and II. Patients with minimal mesangial or mesangial proliferative LN, who had less immune deposits on IF, also had lower tissue mRNA expression compared to individuals without glomerular disease. In contrast, a different pattern was found in patients with moderate-to-severe lesions, which had higher excretion of podocyte mRNAs in urine. This finding may reflect a more intense structural podocyte damage induced by cell proliferation and inflammation, causing detachment of podocytes from the glomerular basement membrane and excretion of their byproducts in urine.
Recently, another type of lupus podocytopathy has been reported by some authors [19-21], manifested by nephrotic proteinuria and extensive podocyte foot process effacement. An abnormal release of cytokines from aberrant T cells with a cytokine-related injury intrinsic to SLE was postulated as the pathogenic mechanism. Rezende et al. [22] also suggested the existence of different patterns of podocyte injury: injuries involving immune complex deposition with structural podocyte damage, such as in classes III and IV where endocapillary proliferation, necrosis and inflammation predominate, and injuries presenting with diffuse podocyte foot process effacement and dysfunction without inflammation, as in non-proliferative forms of LN.
The diagnostic and prognostic potential of podocyte biomarkers for the activity and progression of glomerular disease may be greater than traditional parameters, such as proteinuria and glomerular filtration rate, as suggested by previous experimental [23] and clinical studies [3]. The range of proteinuria is poorly correlated with immune deposits and disease activity in LN, but it correlates with the severity of histological nephritis [24], diffuse podocyte foot process effacement [19,25] and the growing expression of urine podocyte-associated mRNAs [5]. We confirmed the association between proteinuria and higher urinary podocyte-associated mRNAs, but not found a correlation with mRNA tissue expression. Recently, it has been suggested that podocyturia may be a more accurate marker of disease activity and progression than proteinuria [3,26]. Clinical studies that quantified tissue and urine podocyte markers and growth factors have been showing a correlation between the expression of podocyte-associated mRNAs and the activity, severity, and prognosis of LN [5,6,11,13,27,28], including of our own group [16]. Despite the small sample size, we found that reduced expression of podocin mRNA in kidney biopsy and higher podocin mRNA amounts in urine were both predictive of a higher proteinuria after one year of follow up.
Pro-inflammatory cytokines and chemokines promote the infiltration of different cell lineages, such as CD4+ T helper and CD8+ T cytotoxic lymphocytes, and B cells, into the kidney. CD8+ T lymphocytes, stimulated by type-I interferon, may be involved in the breakdown of tolerance by unknown mechanisms [29]. CD20 cells, neutrophils and macrophages, together with CD8 T lymphocytes, are recruited to sites of inflammation to react with specific nuclear antigens and act as effector cells via the secretion of reactive oxygen species and proteolytic enzymes. Therefore, the influx of inflammatory cells into the glomeruli may lead to cytotoxic activity, which results in tissue damage and podocyte injury [30]. We demonstrated a high density of those cell phenotypes in biopsies with high activity indexes, mostly in proliferative forms of LN, which localized in the tubulointerstitial compartment, and less in glomeruli. Interestingly, CD8+ T cells positively correlated with FOXP3 and TGF-β1 mRNAs in kidney tissue, and in urine both lymphocytes and macrophages correlated with mRNAs coming from various podocyte microdomains. Couzi et al. [31] reported a predominance of CD8+ T lymphocytes in the periglomerular area in patients with proliferative lupus nephritis, linking this infiltrates with disease activity, cellular crescents and a poor outcome after therapy. These authors described similar findings to our study regarding the composition and location of inflammatory cell subsets, specifically the higher number of interstitial CD8+ T cells and intra-glomerular macrophages. However, Couzi did not correlate infiltrating cell phenotypes with podocyte mRNAs as we did. This finding adds useful information, as cytotoxic mechanisms disrupt the slit diaphragm complex and induce reorganization of the cytoskeleton and podocyte processes. As a result, detachment of damaged podocytes from the GBM is followed by their excretion and concentration in urine [5,6,27].
Growth factors, such as TGF-β1 and VEGF, play important roles in inflammation, tissue repair and the progression to renal fibrosis in several glomerular diseases. TGF-β1 is a potent mediator of VEGF secretion, which supports the strong correlation we found between these two factors in tissue and urine samples. Recent data have shown that urinary TGF-β1 and VEGF mRNAs expression was significantly greater in patients with class IV LN than in other histological classes. Interestingly, VEGF expression is reduced in kidney biopsies of patients with proliferative LN and correlates positively with podocyturia but negatively with endocapillary proliferation, histological activity and crescent formation [13,28]. We confirmed these previous reports, showing increased expression of urinary TGF-β1 and VEGF-A mRNAs in patients with active LN compared to healthy individuals. Furthermore, the expression of TGF-β1 in class III and class IV LN was lower in kidney tissue and higher in urine compared to the non-proliferative forms of LN.
Regulatory CD4+CD25+FOXP3+ T cells (Tregs) suppress the function of effector T cells inhibiting antigen-specific immune responses and the secretion of anti-inflammatory cytokines in autoimmune diseases and graft rejection [32]. A deficiency of Tregs induces the expansion of self-reactive T cells and antibody production [33]. Patients with SLE present a lower number of circulating Tregs primarily during the active phase of the disease, which results in reduced suppressive activity [34]. In a clinical study, Xing et al. [35] observed a reduction in circulating FOXP3+ Tregs and increased urinary TGF-β1 in patients with LN, which suggest the involvement of these factors in the immune dysregulation of SLE. Consistent with our findings, Wang et al. [11] also demonstrated high urinary FOXP3 mRNA in patients with active LN, especially in the presence of proliferative lesions.
One limitation of our study is the small sample size in each histological class. However, molecular studies of podocyte markers in LN to date did not include more than 50 patients, and these studies also had short follow-up times. Another limitation is the variability of glomerular filtration rates in our patients at the time of biopsy, and therefore, the expression of podocyte molecules should be corrected for renal function using a logarithmic mRNA/creatinine ratio [3]. Despite the higher age of the tissue control group, their eGFRs were substantially higher than of the patients and did not differ from the urine controls. Furthermore, their urinary protein rates were normal. However, we cannot exclude a confounding effect of age on mRNAs expression levels in tissue controls. Finally, the long-term effects of the immunosuppressive therapy on the functional and structural podocyte recovery require further study by comparing responders to therapy with non-responders in a prospective study, and analyzing podocyte-associated mRNAs expression in a second renal biopsy and serial urine samples.
In summary, this study showed that podocyte-associated mRNAs were inhibited in kidney tissue regardless of class severity in LN. A different pattern of expression was found in patients with moderate-to-severe histological lesions, who presented higher amounts of podocyte mRNAs in urine, reflecting a greater burden of glomerular damage with detachment of podocyte cell products into the urine. Messenger mRNA of VEGF-A, TGF-β1, and FOXP3, which promote cellular proliferation, renal fibrosis and down-regulation of the immune response respectively in systemic lupus, were increased expressed in the urine of patients with active LN. Further research is necessary to determine whether podocyte-associated molecules could act as diagnostic and prognostic biomarkers of kidney damage in patients with SLE.
Acknowledgements
The Research Incentive Funding of the Hospital de Clínicas de Porto Alegre, Porto Alegre, RS, Brazil, and the Brazilian Federal Agency for the Support and Evaluation of Graduate Education (CAPES) for the scholarship awarded to Mariane dos Santos, and the Laboratory of Molecular Biology in Nephrology of the Nephrology Department of the Hospital de Clínicas de Porto Alegre for their technical support.
Disclosure of conflict of interest
None.
References
- 1.Seshan SV. Renal Pathology: SY23-1 CLASSIFICATION OF LUPUS GLOMERULONEPHRITIS: AN UPDATE. Pathology. 2014;46:S40–41. [Google Scholar]
- 2.Schmid H, Henger A, Cohen CD, Frach K, Gröne HJ, Schlöndorff D, Kretzler M. Gene expression profiles of podocyte-associated molecules as diagnostic markers in acquired proteinuric diseases. J Am Soc Nephrol. 2003;14:2958–2966. doi: 10.1097/01.asn.0000090745.85482.06. [DOI] [PubMed] [Google Scholar]
- 3.Wickman L, Afshinnia F, Wang SQ, Yang Y, Wang F, Chowdhury M, Graham D, Hawkins J, Nishizono R, Tanzer M, Wiggins J, Escobar GA, Rovin B, Song P, Gipson D, Kershaw D, Wiggins RC. Urine podocyte mRNAs, proteinuria, and progression in human glomerular diseases. J Am Soc Nephrol. 2013;24:2081–2095. doi: 10.1681/ASN.2013020173. [DOI] [PMC free article] [PubMed] [Google Scholar]
- 4.Szeto CC, Lai KB, Chow KM, Szeto CY, Yip TW, Woo KS, Li PK, Lai FM. Messenger RNA expression of glomerular podocyte markers in the urinary sediment of acquired proteinuric diseases. Clin Chim Acta. 2005;361:182–190. doi: 10.1016/j.cccn.2005.05.016. [DOI] [PubMed] [Google Scholar]
- 5.Wang G, Lai FM, Tam LS, Li KM, Lai KB, Chow KM, Li KT, Szeto CC. Messenger RNA expression of podocyte-associated molecules in urinary sediment of patients with lupus nephritis. J Rheumatol. 2007;34:2358–2364. [PubMed] [Google Scholar]
- 6.Bollain-Y-Goytia JJ, González-Castañeda M, Torres-Del-Muro F, Daza-Benitez L, Zapata-Benavides P, Rodríguez-Padilla C, Avalos-Díaz E, Herrera-Esparza R. Increased excretion of urinary podocytes in lupus nephritis. Indian J Nephrol. 2011;21:166–171. doi: 10.4103/0971-4065.83029. [DOI] [PMC free article] [PubMed] [Google Scholar]
- 7.Crispín JC, Liossis SN, Kis-Toth K, Lieberman LA, Kyttaris VC, Juang YT, Tsokos GC. Pathogenesis of human systemic lupus erythematosus: recent advances. Trends Mol Med. 2010;16:47–57. doi: 10.1016/j.molmed.2009.12.005. [DOI] [PMC free article] [PubMed] [Google Scholar]
- 8.Renaudineau Y, Deocharan B, Jousse S, Renaudineau E, Putterman C, Youinou P. Anti-alpha-actinin antibodies: a new marker of lupus nephritis. Autoimmun Rev. 2007;6:464–468. doi: 10.1016/j.autrev.2007.02.001. [DOI] [PubMed] [Google Scholar]
- 9.Sterner RM, Hartono SP, Grande JP. The Pathogenesis of Lupus Nephritis. J Clin Cell Immunol. 2014;5 doi: 10.4172/2155-9899.1000205. pii. 205. [DOI] [PMC free article] [PubMed] [Google Scholar]
- 10.Sawla P, Hossain A, Hahn BH, Singh RP. Regulatory T cells in systemic lupus erythematosus (SLE); role of peptide tolerance. Autoimmun Rev. 2012;11:611–614. doi: 10.1016/j.autrev.2011.09.008. [DOI] [PubMed] [Google Scholar]
- 11.Wang G, Lai FM, Tam LS, Li EK, Kwan BC, Chow KM, Li PK, Szeto CC. Urinary FOXP3 mRNA in patients with lupus nephritis--relation with disease activity and treatment response. Rheumatology (Oxford) 2009;48:755–760. doi: 10.1093/rheumatology/kep074. [DOI] [PubMed] [Google Scholar]
- 12.Edelbauer M, Kshirsagar S, Riedl M, Billing H, Tönshoff B, Haffner D, Dötsch J, Wechselberger G, Weber LT, Steichen-Gersdorf E. Soluble VEGF receptor 1 promotes endothelial injury in children and adolescents with lupus nephritis. Pediatr Nephrol. 2012;27:793–800. doi: 10.1007/s00467-011-2062-z. [DOI] [PubMed] [Google Scholar]
- 13.Avihingsanon Y, Phumesin P, Benjachat T, Akkasilpa S, Kittikowit V, Praditpornsilpa K, Wongpiyabavorn J, Eiam-Ong S, Hemachudha T, Tungsanga K, Hirankarn N. Measurement of urinary chemokine and growth factor messenger RNAs: a noninvasive monitoring in lupus nephritis. Kidney Int. 2006;69:747–753. doi: 10.1038/sj.ki.5000132. [DOI] [PubMed] [Google Scholar]
- 14.Weening JJ, D’Agati VD, Schwartz MM, Seshan SV, Alpers CE, Appel GB, Balow JE, Bruijn JA, Cook T, Ferrario F, Fogo AB, Ginzler EM, Hebert L, Hill G, Hill P, Jennette JC, Kong NC, Lesavre P, Lockshin M, Looi LM, Makino H, Moura LA, Nagata M. The classification of glomerulonephritis in systemic lupus erythematosus revisited. Kidney Int. 2004;65:521–530. doi: 10.1111/j.1523-1755.2004.00443.x. [DOI] [PubMed] [Google Scholar]
- 15.Austin HA, Boumpas DT, Vaughan EM, Balow JE. Predicting renal outcomes in severe lupus nephritis: contributions of clinical and histologic data. Kidney Int. 1994;45:544–550. doi: 10.1038/ki.1994.70. [DOI] [PubMed] [Google Scholar]
- 16.Rodrigues PG, Bringhenti RN, do Nascimento JF, Joelsons G, dos Santos M, Pereira S, Veronese FV. Expression patterns of podocyte-associated mRNAs in patients with proliferative or non-proliferative glomerulopathies. Int J Clin Exp Pathol. 2014;7:2185–2198. [PMC free article] [PubMed] [Google Scholar]
- 17.Liu Z, Davidson A. Taming lupus-a new understanding of pathogenesis is leading to clinical advances. Nat Med. 2012;18:871–882. doi: 10.1038/nm.2752. [DOI] [PMC free article] [PubMed] [Google Scholar]
- 18.Mjelle JE, Rekvig OP, Van Der Vlag J, Fenton KA. Nephritogenic antibodies bind in glomeruli through interaction with exposed chromatin fragments and not with renal cross-reactive antigens. Autoimmunity. 2011;44:373–383. doi: 10.3109/08916934.2010.541170. [DOI] [PubMed] [Google Scholar]
- 19.Kraft SW, Schwartz MM, Korbet SM, Lewis EJ. Glomerular podocytopathy in patients with systemic lupus erythematosus. J Am Soc Nephrol. 2005;16:175–179. doi: 10.1681/ASN.2004050350. [DOI] [PubMed] [Google Scholar]
- 20.Han TS, Schwartz MM, Lewis EJ. Association of glomerular podocytopathy and nephrotic proteinuria in mesangial lupus nephritis. Lupus. 2006;15:71–75. doi: 10.1191/0961203306lu2264oa. [DOI] [PubMed] [Google Scholar]
- 21.Gutiérrez S, Petiti JP, De Paul AL, Torres AI, Mukdsi JH. Lupus-related podocytopathy. Could it be a new entity within the spectrum of lupus nephritis? Nefrologia. 2012;32:245–246. doi: 10.3265/Nefrologia.pre2011.Nov.11138. [DOI] [PubMed] [Google Scholar]
- 22.Rezende G, Viana V, Malheiros D, Borba E, Silva N, Silva C, Leon EP, Noronha IL, Bonfa E. Podocyte injury in pure membranous and proliferative lupus nephritis: distinct underlying mechanisms of proteinuria? Lupus. 2014;23:255–262. doi: 10.1177/0961203313517152. [DOI] [PubMed] [Google Scholar]
- 23.Fukuda A, Wickman LT, Venkatareddy MP, Wang SQ, Chowdhury MA, Wiggins JE, Shedden KA, Wiggins RC. Urine podocin:nephrin mRNA ratio (PNR) as a podocyte stress biomarker. Nephrol Dial Transplant. 2012;27:4079–4087. doi: 10.1093/ndt/gfs313. [DOI] [PMC free article] [PubMed] [Google Scholar]
- 24.Perysinaki GS, Moysiadis DK, Bertsias G, Giannopoulou I, Kyriacou K, Nakopoulou L, Boumpas DT, Daphnis E. Podocyte main slit diaphragm proteins, nephrin and podocin, are affected at early stages of lupus nephritis and correlate with disease histology. Lupus. 2011;20:781–791. doi: 10.1177/0961203310397412. [DOI] [PubMed] [Google Scholar]
- 25.Desai N, Cimbaluk D, Lewis EJ, Whittier WL. Proteinuria in membranous lupus nephritis: the pathology is in the podocyte. Lupus. 2013;22:461–468. doi: 10.1177/0961203313477225. [DOI] [PubMed] [Google Scholar]
- 26.Yu D, Petermann A, Kunter U, Rong S, Shankland SJ, Floege J. Urinary podocyte loss is a more specific marker of ongoing glomerular damage than proteinuria. J Am Soc Nephrol. 2005;16:1733–1741. doi: 10.1681/ASN.2005020159. [DOI] [PubMed] [Google Scholar]
- 27.Nakamura T, Ushiyama C, Suzuki S, Hara M, Shimada N, Sekizuka K, Ebihara I, Koide H. Urinary podocytes for the assessment of disease activity in lupus nephritis. Am J Med Sci. 2000;320:112–116. doi: 10.1097/00000441-200008000-00009. [DOI] [PubMed] [Google Scholar]
- 28.Avihingsanon Y, Benjachat T, Tassanarong A, Sodsai P, Kittikovit V, Hirankarn N. Decreased renal expression of vascular endothelial growth factor in lupus nephritis is associated with worse prognosis. Kidney Int. 2009;75:1340–1348. doi: 10.1038/ki.2009.75. [DOI] [PubMed] [Google Scholar]
- 29.Waters ST, McDuffie M, Bagavant H, Deshmukh US, Gaskin F, Jiang C, Tung KS, Fu SM. Breaking tolerance to double stranded DNA, nucleosome, and other nuclear antigens is not required for the pathogenesis of lupus glomerulonephritis. J Exp Med. 2004;199:255–264. doi: 10.1084/jem.20031519. [DOI] [PMC free article] [PubMed] [Google Scholar]
- 30.Rovin BH, Parikh SV. Lupus nephritis: the evolving role of novel therapeutics. Am J Kidney Dis. 2014;63:677–690. doi: 10.1053/j.ajkd.2013.11.023. [DOI] [PMC free article] [PubMed] [Google Scholar]
- 31.Couzi L, Merville P, Deminière C, Moreau JF, Combe C, Pellegrin JL, Viallard JF, Blanco P. Predominance of CD8+ T lymphocytes among periglomerular infiltrating cells and link to the prognosis of class III and class IV lupus nephritis. Arthritis Rheum. 2007;56:2362–2370. doi: 10.1002/art.22654. [DOI] [PubMed] [Google Scholar]
- 32.Dummer CD, Carpio VN, Gonçalves LF, Manfro RC, Veronese FV. FOXP3+ regulatory T cells: from suppression of rejection to induction of renal allograft tolerance. Transpl Immunol. 2012;26:1–10. doi: 10.1016/j.trim.2011.08.009. [DOI] [PubMed] [Google Scholar]
- 33.Bagavant H, Tung KS. Failure of CD25+ T cells from lupus-prone mice to suppress lupus glomerulonephritis and sialoadenitis. J Immunol. 2005;175:944–950. doi: 10.4049/jimmunol.175.2.944. [DOI] [PubMed] [Google Scholar]
- 34.Liu MF, Wang CR, Fung LL, Wu CR. Decreased CD4+CD25+ T cells in peripheral blood of patients with systemic lupus erythematosus. Scand J Immunol. 2004;59:198–202. doi: 10.1111/j.0300-9475.2004.01370.x. [DOI] [PubMed] [Google Scholar]
- 35.Xing Q, Su H, Cui J, Wang B. Role of Treg cells and TGF-β1 in patients with systemic lupus erythematosus: a possible relation with lupus nephritis. Immunol Invest. 2012;41:15–27. doi: 10.3109/08820139.2011.578189. [DOI] [PubMed] [Google Scholar]